
 ?Mathematical formulae have been encoded as MathML and are displayed in this HTML version using MathJax in order to improve their display. Uncheck the box to turn MathJax off. This feature requires Javascript. Click on a formula to zoom.
ABSTRACT
The availability of vast amounts of location-based data from social media platforms such as Twitter has enabled us to look deeply into the dynamics of human movement. The aim of this paper is to leverage a large collection of geo-tagged tweets and the street networks of two major metropolitan areas—London and Tokyo—to explore the underlying mechanism that determines the heterogeneity of human mobility patterns. For the two target cities, hundreds of thousands of tweet locations and road segments were processed to generate city hotspots and natural streets. User movement trajectories and city hotspots were then used to build a hotspot network capable of quantitatively characterizing the heterogeneous movement patterns of people within the cities. To emulate observed movement patterns, the study conducts a two-level agent-based simulation that includes random walks through the hotspot networks and movements in the street networks using each of three distance types—metric, angular and combined. Comparisons of the simulated and observed movement flows at the segment and street levels show that the heterogeneity of human urban movements at the collective level is mainly shaped by the scaling structure of the urban space.
1. Introduction
A quantitative understanding of human movement dynamics (Barabási Citation2005) has the capacity to support a variety of urban applications, including disaster management (Osaragi et al. Citation2018) and transportation planning (Gao et al. Citation2014). Space syntax theory summarizes two core factors that affect people’s movements on an urban scale: the underlying spatial environment and the moving behavior of individuals (Hillier Citation2012). The underlying spatial environment usually refers to the structural properties of the street network. These structural properties are de facto a set of network morphological parameters (Freeman Citation1979). Individual moving behavior can be abstracted as movement along the shortest path between origins and destinations in the network. The shortest path in urban movement models, as proposed by Hillier and Iida (Citation2005), includes three types of the minimum route distances: shortest length (metric), least angular change (angular), and lowest number of direction changes (fewest-turn). The choice of shortest path is determined by spatial cognition, that is, the way the individual perceives the space. Many studies in this area conclude that an individual’s conceptualization of space plays an important role in his/her movement by seeking correlations between street network centrality measures based on different kinds of shortest-paths and observed movement flows (e.g. Hillier and Iida Citation2005, Jayasinghe et al. Citation2015). However, critics from later studies have pointed out that centrality measures based on the collection of shortest paths may not be the most effective means of characterizing urban movement flows, as they ignore the spatial heterogeneity of urban space (e.g. Omer and Jiang Citation2015).
Urban space is essentially very heterogeneous. The highly-heterogeneous statistics were commonly found in either morphological or functional urban quantities, which follows well-defined scaling laws (Bettencourt et al. Citation2007, Batty Citation2008, Bettencourt Citation2013). Mathematically, the scaling structure of urban space indicates a power-law distribution (Clauset et al. Citation2009), or a heavy-tailed distribution in general. In this paper, heterogeneity, scaling, and power law are generally treated as interchangeable terms. To inspect a city’s scaling structure, a topology-based representation is prerequisite. For example, a topological representation of axial lines or natural streets would enable us to see that there are far more less-connected or short streets than well-connected or long streets (Carvalho and Penn Citation2004, Ma et al. Citation2018). Jiang (Citation2017) developed another topological representation that views city hotspots as a whole in order to derive a city’s scaling hierarchy. Together, street networks and city hotspots can be said to constitute a city’s heterogeneous spatial configuration. Influenced by this complex spatial configuration, human activities on an urban scale tend to follow a heavy-tailed distribution rather than a normal or uniform one. Prior studies have reported heterogeneous human mobility in an urban space in terms of travel length, known as the levy flight characteristic (Gonzalez et al. Citation2008, Song et al. Citation2010, Rhee et al. Citation2011), and have argued that human movement flows in urban street networks are well-predicted by the scaling properties of axial lines and natural streets (Ma et al. Citation2018). However, few studies consider the combined influence of city hotspots and street networks on the heterogeneity of human movements. Thus, the motivation for the present paper is to illustrate that it is essentially the scaling structure of city hotspots and street networks together shapes human urban movements.
The paper is further motivated by the era of geospatial big data. Geospatial big data from location-based social media such as OpenStreetMap and Twitter provide unprecedented opportunities to develop new insights into collective-level human mobility at a very fine spatio-temporal resolution and with very low cost (e.g. Azmandian et al. Citation2013, Jurdak et al. Citation2015). Big data is not only big but also heterogeneous in nature (Mayer-Schonberger and Cukier Citation2013). Thus, comprehending human activities from massive and diverse datasets requires complexity science methods (e.g. Blumenfeld-Lieberthal and Portugali Citation2010) such as complex networks, scaling analysis and agent-based modeling (ABM). Fundamental to the topological perspective of city hotspots and natural streets is the complex-network thinking that enables us to perceive the scaling pattern of the underlying spatial environment and human activities therein. Such scaling patterns can be quantitatively analyzed through scaling analyses such as power law models for heavy-tailed distribution characterization and head/tail breaks for scaling hierarchy derivation (see section 2.3 for details). To reveal effectively the development of scaling statistics, ABM simulates the interaction between individuals and the spatial environment, and presents related metrics for the process in a real-time fashion. The comparison of simulated and observed measurements can further assist us in finding the mechanisms responsible for the scaling pattern of human activities. Accordingly, the present study is positioned in the context of complexity science and aims to use these complexity tools to explore the underlying mechanism of human movement dynamics.
The contributions of this study can be described in terms of its three main aspects: Firstly, we make use of two kinds of topological representations, based on city hotspots and natural streets, for two world-class metropolitan areas, London and Tokyo, in order to probe into the universal scaling pattern of urban space and the human activities contained therein. Moreover, the clearly-identified differences in human activities that were found in the Tokyo area before and after a major earthquake opens the real possibility of extending the use of topological representations to the field of disaster management. Secondly, we show that a topological representation of city hotspots, i.e. a hotspot network, constructed from extracted city hotspots and user movement trajectories, can effectively capture the spatial heterogeneity of human urban movements. Thirdly, the study mimics observed mobility patterns by conducting a two-level ABM using the hotspot and street networks. The simulated movement flows were very close to those observed, both in terms of their similar power law metrics and their high correlations, uncovering the interplay between urban movements and angular or metric effects and further supporting the argument that human urban movements are primarily shaped by the scaling structure of underlying geographical space.
The remainder of this paper proceeds as follows: Section 2 introduces the proposed methodological framework; Section 3 presents results, focusing on the heterogeneity explored in two metropolitan areas (London and Tokyo) with respect to user trajectories, urban hotspots, and observed and simulated movement flows; Section 4 further discusses the heterogeneity of human urban movements and its underlying mechanism; Section 5 offers conclusions and outlines future research directions.
2. Methodology
The methodology used in this study is to explore the underlying heterogeneity of human urban movements is described by the flowchart in . As shown, raw geo-tagged tweets are first processed to remove any tweets that may be ineligible. Next, each user’s trajectory is extracted in chronological order, and a spatial clustering approach is applied to detect city hotspots. Based on these user trajectories and detected city hotspots, a hotspot network is constructed, with nodes representing the hotspots and edges representing user movements between hotspots. The hotspot network is then used to conduct an agent-based simulation for random walkers in order to generate a series of movement trajectories. Each simulated hotspot-based trajectory is then projected onto the street network, and a simulation of street-constrained movements based on three possible routing strategies (using metric, angular, and combined distance types) is conducted. Finally, we characterize the heterogeneity of movement flows at both the segment and street levels through scaling analysis, which includes the mathematical characterization of power law models and the calculation of ht-indexes.
Figure 1. The methodological framework of this study
2.1. Twitter user trajectory, urban hotspots and the hotspot network
The geotagged tweets in this study contain three types of information: user id, location (XY coordinate-pair), and timestamp. As a first step, we process the raw geo-tagged tweets for three purposes: user trajectory extraction, urban hotspot detection, and hotspot network construction. Before extracting the user trajectory, we eliminate unsuitable users and tweets using suggested criteria by Wu et al. (Citation2014) and Shen et al. (Citation2019). Specifically, we remove (1) tweet locations outside the study area, (2) users with only one tweet during the study timespan (since movement requires at least two points), (3) tweet locations outside a 10 m radius of the street network (since our focus is on street movements), and (4) tweets sent by a suspected robot user that has sent an abnormally large number of tweets during a very short period. After filtering, we extracted each user trajectory, as defined in EquationEquation (1)(1)
(1) :
whereby each trajectory is structured using a user id and a list of tweets sorted by publishing time. Note that we also examine and delete some abnormal trajectories whose rate of speed is faster than 400 kilometers per hour.
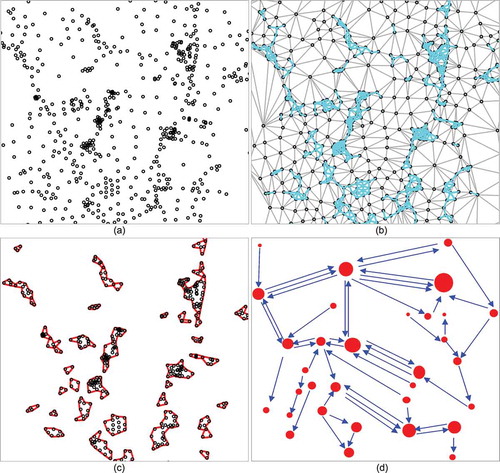
The next step is to detect the hotspots in the city. A hotspot indicates a concentration of human activities. To this end, we adopt a spatial clustering approach based on the triangulated irregular network (TIN) as suggested by Jiang (Citation2017). Given the set of tweet locations, the procedure starts with constructing a large TIN by linking all tweet locations, then selecting the TIN edges that are shorter than the average of all the TIN edge lengths (where a high density of tweets exists, as indicated in )). We next convert these small edges into triangle polygons. Finally, we dissolve proximate triangles into patches ()). These patches are detected hotspots – or city attractions – as determined by tweet locations. The advantage of this method is that it clusters different sets of points with various locally high densities without the need for predefined input parameters.
Given user trajectories and the detected hotspots, a hotspot network can be constructed to model urban movement patterns. To accomplish this, we let nodes represent hotspots, with edges indicating movement from one hotspot to another by an individual user. We first make the connection between consecutive tweets in a user’s trajectory and change each tweet location to the corresponding hotspot. By repeating this operation for every trajectory, a hotspot network can then be established. The resulting network is a directed and weighted graph ()). The weight of an edge equals to the number of repeated movements between two hotspots. The proposed graph-based model effectively abstracts people’s movements by gauging quantitatively both the attractions of the city (i.e. the hotspots) and the movement between them based on the massive amount of social media data being processed.
Figure 2. (Color online) An illustration of hotspot detection using the TIN-based approach and hotspot network construction using extracted user trajectories
2.2. A two-level ABM to simulate human urban movements
ABM has proved to be an effective way to simulate collective human behaviors. In this section, we propose a two-level ABM using detected hotspots and street networks. In the hotspot network, we use random walk behavior for every agent when moving between hotspots; in the street network, we let the agents use any of three street distance types (or routing strategies) to move from one street to another.
2.2.1. Random walk through the hotspot network
The purpose of using ABM with the hotspot network is to generate a hotspot-based simulated trajectory for each agent. Since hotspots are connected based on real user movements, we consider that human mobility displacement on an urban scale can be captured by the random walk (Noh and Rieger Citation2004) of agents across the hotspot network. In this study, the ABM is regarded as a Markov chain process (Stroock Citation2005) since an agent’s next movement depends solely on the current state. Moreover, each agent’s walk behavior is influenced by the weight of each connection. That is, for any single node, the more in-links directed towards it (as shown in )), the greater the chance that the node will be visited. Specifically, the simulation process for each agent entails a stochastic search of neighboring nodes where the immediate local attraction defines the next step in the agent’s movement. In other words, agents moving through space always tend to go to a node that has a relatively larger in-degree, just as people are more likely to go to the more popular places (e.g. shopping malls, sightseeing spots, etc.) within the city.
To set the simulation, we use 1000 agents and allow them to continue to move until a saturated state is reached. A saturated state is defined as a state in which there is a very high correlation between each hotspot’s frequency of visits and corresponding PageRank score (Page and Brin Citation1998). This idea is borrowed from prior studies (Jiang et al. Citation2009, Jia et al. Citation2012). In this study, we apply a saturation threshold of 0.95. When the correlation reaches the threshold level, the simulation stops automatically. It should be noted that we calibrate the number of times that each agent moves from one node to another using a power-law random number, where the power-law exponent is derived according to the number of tweets associated with each extracted trajectory. In this way, we think that an agent’s simulated trajectory closely matches its real counterpart.
2.2.2. Street movement simulation and movement flow
It has been widely accepted that urban-scale human movements are constrained by the road network. We thus use street segments as the underlying spatial environment for our second-level simulation. Before conducting this second-level simulation, we convert each hotspot-based trajectory to a segment-based trajectory by replacing each hotspot with one of its contained segments. Due to the one-to-many spatial relationship between hotspot and segment, the same hotspot can result in different corresponding segments. We set an equal selection probability for each corresponding segment contained in a hotspot.
The segment-based network or graph G consists of a set of nodes N and undirected edges E, i.e. . N stands for individual street segment, and E is the adjacency relationship between any pair of intersected segments (
) at either end vertex, where
and
. Each edge is weighted according to either of two types of distances – metric or angular (Dalton Citation2003, Hillier and Iida Citation2005). Note that the study follows Serra and Hillier (Citation2018) in excluding the fewest-turn distance since the fewest-turn distance is very similar to the angular distance. For each edge, metric distance
denotes half the sum of the lengths of two adjacent segments in metric units; angular distance
is defined as the deflection angle between the two adjacent segments.
Based on the edge weights, each agent can use either type of shortest path (i.e. metric or angular) between each pre-computed, segment-based origin-destination (OD) pair. EquationEquations (2(2)
(2) ) and (Equation3
(3)
(3) ) denote, respectively, the network topological distance
of the metric and angular shortest-paths from segment
to segment
:
where denotes metric,
denotes angular, and k is the number of intermediate segments in between an OD pair. Hence, the shortest path is defined as the path with the minimum sum of the metric or angular weights.
Given that human wayfinding and co-presence potential in the built environment is very likely to be considered as a hybrid effect of metric and angular distance types (Stephen and Traunmueller Citation2017, Shen et al. Citation2019), we adopt a combined shortest path, as indicated by EquationEquation (4)(4)
(4) ,
where the combined shortest path is determined by – the Euclidean distance between the two mid-points of the OD segment pair. It is common that individuals make their long-distance movements on streets with the least angular change. Hence, we use the angular shortest-path between OD pairs when
is long; when
is short, we use the metric shortest-path. (Note: average observed trajectory length
is used to calibrate the ABM by determining whether
is long or short.)
Having defined different types of shortest paths, it is important that we describe how movement flow is measured in a street network. The movement flows in this study are computed based not only on segments, but also on streets. A street can be termed a ‘stroke’ or ‘natural street’, which is defined as merged segments with good continuity (Jiang et al. Citation2008). Good continuity implies small deflection angles (e.g. less than 45 degrees) between adjacent segments. The shortest path between an OD can thus be in the form of segments or streets, as defined below:
or
The calculation of movement flow can be made simply by adding 1 for each segment or street element of the shortest path. Note that because of inclusion relationship between a street and segments, a street can be repeatedly counted if there is more than 1 segment member along the shortest path.
The three types of shortest paths determine how agents move along the streets of a city. As the use of different movement strategies will affect the movement flow or the amount of traffic at both the segment and street levels, we conducted simulations using metric, angular, and combined shortest-paths, respectively, and compared each simulated movement flow with the observed flow in order to determine which routing strategy mimics actual human mobility patterns most closely and whether different route choices affect the degree of heterogeneity in urban-scale human movements.
2.3. Scaling analysis of the movement flow
The heterogeneity of the movement flow can be characterized using scaling analysis. Scaling analysis consists of two elements: the detection of power law distributions, and head/tail breaks, with its induced ht-index. Power law metrics have been used frequently across multiple disciplines (e.g. Newman Citation2005) as an effective measurement of a phenomenon exhibiting great heterogeneity. Head/tail breaks (Jiang Citation2013) and the induced ht-index (Jiang and Yin Citation2014) act as an effective complement to power law detection by providing an indicator to describe the level of heterogeneity.
A power law distribution can be denoted as in EquationEquation (5)(5)
(5) :
The most straightforward way to identify a power law distribution is by creating a log-log plot of the data, with values in descending order. Ideally, the distribution will appear as a straight line if the data is perfectly power-law distributed. However, in real cases, taking logarithms can lead to many unpleasant fluctuations in the tail (Newman Citation2005). Furthermore, this method is limited in calculating the probability distribution of the data. Thus, rather than using a rough estimate, Clauset et al. (Citation2009) proposed a robust method using maximum likelihood estimation to accurately assess whether a set of data follows a power law, relying on several parameters, including the power law exponent α and the goodness-of-fit index p-value. Exponent is given by:
where is the smallest value for which the power law holds. Normally, an acceptable exponent
falls in the range [1, 3]. For evaluating how well the data fits a power law distribution, the goodness-of-fit index p-value is used. The p-value ranges from 0 (non-power law) to 1 (perfect power law). In this study, the critical p-value is set to 0.01 for accepting the hypothesis of a power law distribution. For more details regarding the calculation of α and the p-value, readers can refer to Newman (Citation2005) and Clauset et al. (Citation2009), and to the public code in Python and Matlab (http://www.santafe.edu/~aaronc/powerlaws/).
In practice, it is not assured that data with substantial heterogeneity follows a power law distribution. In fact, such data can be characterized by other types of heavy-tailed distributions, including lognormal and exponential distributions. In this regard, the head/tail breaks method and corresponding ht-index can be of supplementary usefulness. Given data with a heavy-tailed distribution, the arithmetic mean, or average, can be used to divide the data values into two parts: large values above the mean, called the head; and the rest of the values, consisting of small values below the mean, called the tail. The proportion of values in the head and tail should always be imbalanced; for example, a minority head of 40% versus a majority tail of 60%. The process recursively continues for the head until the new head is no longer the minority (e.g. >40%). The number of times that the head/tail division can be applied, plus 1, is the ht-index (Jiang and Yin Citation2014). In other words, the ht-index indicates the number of times the scaling pattern of far more ‘smalls’ than ‘larges’ recurs, and thereby capturing the data’s scaling hierarchy. To determine whether the data is heterogeneous, the ht-index should be at least 3. The higher the ht-index, the more heterogeneous is the data. Because power law distribution is the focus of this study, it should be stressed that we compare two ht indexes only if both data sets pass the power law examination. This study applies a percentage threshold of 40% for determining the minority. In sum, we computed three parameters for conducting scaling analysis on both segment and street-based movement flows: the power law exponent , the goodness-of-fit index p-value, and the ht-index value ht.
3. Case studies
3.1. Case study I: London
London is used as a case study to investigate urban activity patterns. The boundary was delimited by applying the natural city approach to all UK tweet locations (Jiang Citation2017). Using Twitter Streaming API, we extracted 110,754 geo-tagged tweet locations for 14,661 Twitter users in metropolitan London between 1 June and 8 June 2014 as a proxy for urban human activity within the London metropolitan area ()). After data filtering, 91,234 tweet locations and 12,589 users remained. By grouping the tweets according to individual user and publishing time, 12,589 trajectories were obtained. A preliminary analysis was conducted to evaluate the heterogeneity of the extracted trajectories and found that the tweet numbers for each trajectory followed a power law distribution (with = 2.36 and p-value = 0.12, )). However, trajectory lengths and durations did not appear to be power-law distributed, as their
values were outside the acceptable range. To comprehensively check the heterogeneous pattern of trajectory lengths and durations, we applied the head/tail breaks method and produced their ht-indexes of 6 and 10, respectively. The large ht-index values indicate that both trip lengths and durations exhibit fat-tail distribution characteristics, although they don’t pass the power law test. As is the case with the trip lengths (), we noted that each head percentage was quite low (< 30%). The head/tail breaks statistics showed that only a minority of users travel long distances (longer than ~6 km) and that most users travel only very short distances.
Figure 3. (Color Online) The spatial distribution of London geo-tagged tweets (a) and power-law distributions of #tweets per extracted trajectory, trajectory lengths, and durations (b)
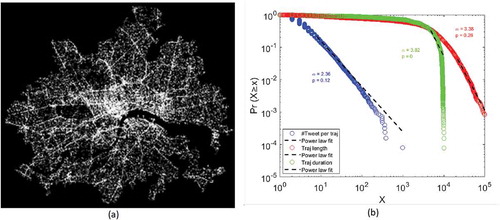
Table 1. Head/tail breaks statistics for the length of user trajectories (Note: # = number, Traj = User trajectories, = average length of user trajectories in meters)
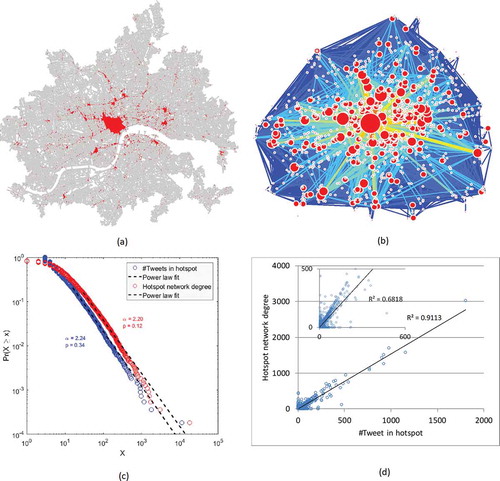
Next, we applied the TIN-based clustering approach to detect London area hotspots. In all, 4,704 hotspots were identified. The spatial distribution of the detected hotspots was consistent with that of the tweet location densities. We spotted a very large patch in the downtown area that included a number of city attractions (e.g. Trafalgar square and Soho) and numerous smaller hotspots scattered throughout the city ()). The different-sized hotspots were accurately represented by the power law distribution of the number of tweets in each hotspot ()). Both the value and the p-value confirmed a strikingly heterogeneous pattern of human activities at the city level. Moreover, the size of detected hotspots corresponded well with the number of users too, as the correlation between number of tweet locations and number of users for each hotspot was 0.72. The hotspot network was further constructed including user trajectories along with the detected hotspots. The resulting network consists of 4,704 nodes and 17,328 edges; it is a scale-free network, as node degrees are power-law distributed ()). A visualization of the network ()) shows clearly that urban movements happen mostly between the more popular places (thick links among large nodes). Furthermore, the constructed network can be validated by taking into account the close
values (alpha = 2.20 and 2.24) and the very high correlation (R2 = 0.91) between node degrees and hotspot sizes ()).
Figure 4. (Color Online) (a) Detected hotspots; (b) the hotspot network in the London area; (c) the power law distribution of the number of tweets at each hotspot and the node degrees in the hotspot network; and (d) the correlation (R square) of number of tweets and hotspot degrees shown in a scatter plot
The London street data set used in this study is the same as that used in the previous work of Ma et al. (Citation2018). The data includes 89,494 street segments and 29,609 natural streets. Before conducting the simulation, observed movement flows were collected using Near Function in ArcGIS to snap each tweet location to its nearest segment and street. The number of snapped tweets for each segment and street was used as the observed movement flow. To our surprise, the observed segment-based movement flows also had a power law distribution, with an even higher ht-index value than that of the streets (). To mimic this mobility pattern, we conducted a two-level simulation. On the hotspot network, when saturated status was reached, 1000 hotspot-based trajectories, including 3,200 OD pairs, were generated; on the street network, the simulation was run using each of the three routing strategies. In our results, the simulated segment-based flows based on angular and combined strategies passed the power-law test. Notably, the exponent of the simulated segment-based flow using the combined strategy was closest to that of the observed segment-based flow (). It should also be noted that the high ht-index value of the segment-based flow based on the metric strategy was of no use since these flows were not power-law distributed (p-value = 0). For the simulated street-based flows, the scaling characteristics were striking among all strategies. In general, the , p-value and ht-index for the simulated street-based flow varied only slightly from the corresponding values for the observed flow.
Table 2. Scaling properties of the observed flow and simulated flow in London at segment and street levels, respectively
3.2. Case study II: Tokyo
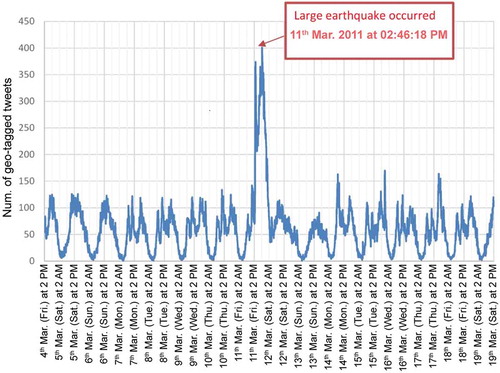
We chose the Tokyo Metropolitan area as our second study area. In this case study, we analyzed human movements using a total of 131,987 geotagged tweets posted before and after a major event – the Great East Japan Earthquake that occurred on 11 March 2011 at 02:46 PM JST. The timespan of tweet data was from 4 March 2011 to 19 March 2011. We divided the tweet data into two sets: one week right before and one week right after the earthquake occurred. In general, the number of geotagged tweets varied periodically over the observed time (). However, the pattern of geotagged tweets for the 24-hour period after the earthquake occurred shows a significant difference from the other days. Specifically, the number of tweets drastically increased immediately after the earthquake (nearly three times more than on an average day) as people posted tweets about the event. The number remained large for roughly an hour before the tsunami struck, then gradually decreased. Notably, many of the tweets sent in the evening related to congestion in the cities (Oki Citation2018).
Figure 5. (Color Online) The temporal distribution, at 10-minute intervals, of geotagged tweets written in Japanese around the time of the Great East Japan Earthquake
Next, we extracted the user trajectories and conducted hotspot detection before and after the earthquake. As shown in , the decreased number of tweets indicated that human movements were significantly influenced after the earthquake. Both the total size of the hotspots and the average trajectory length were reduced after the earthquake, indicating a shrinking human action sphere. The increased number of hotspots, in fact, pointed out that human activities became more discontinuous following the event ()). Moreover, striking scaling patterns appear in the city hotspots ()). Comparing the hotspots over the two time periods, we can see that, after the earthquake, the spatial continuity of human movements broke into several pieces in the downtown and popular business districts (e.g. Shibuya, Roppongi and Tokyo station). These changes were mainly due to the temporary shutdown of rest facilities and intra- and inter-city transportation (e.g. some subways and rail lines), as well as limited time that shops were opening, etc. We further identified the difference of human movements on the streets before and after the earthquake. The Tokyo street network data, which included 365,735 segments, was downloaded from OpenStreetMap, resulting in 94,141 natural streets. To accomplish this, we assigned tweet locations in each time period to the nearest streets, and then calculated the difference in number of tweets at the street level. As a result, we found that the difference in tweet numbers was also power-law distributed ()). As ) demonstrates, large changes were not uniformly distributed across the city but rather were concentrated on major roads in the city center and the roads around large public transportation facilities (e.g. Haneda International Airport).
Figure 6. (Color Online) The differences of human movement patterns before and after the earthquake reflected respectively by city hotspots and natural streets
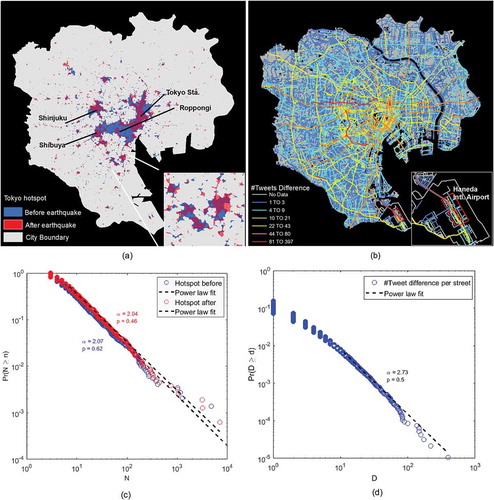
Table 3. Some statistics on Tokyo tweets before and after the earthquake (Note: # = number, = aggregated hotspot size (area); the number in brackets indicates the number of tweets after filtering)
The hotspot networks in both periods exhibit scaling patterns in terms of node degrees and edge weights. As can be seen in , because of the interrupted human activities in the more popular areas of the city caused by the earthquake, network scaling hierarchical levels decreased after the event. The scaling properties of the observed movement flows on segments and streets before and after the earthquake were subsequently examined (). For both the observed segment-based and street-based flows, there was very little difference in terms of power law statistics and ht-index values between the two time periods. Notably, however, the exponent values of the observed segment-based flows were nearly out of the acceptable range (2.98 and 2.96). Using the simulated trajectories based on the constructed hotspot networks, we found that the simulated segment-based flows for almost all the distance types failed to follow a power law distribution, as values were greater than 3, even though the ht-index values were large. Despite this, the
values for the combined distance type were closest to the observed values. In contrast, the simulated flows at the street level, irrespective of the distance type, were power-law distributed in both time periods. Overall, the scaling characteristics of the movement flows were better captured by streets.
Figure 7. (Color Online) The constructed hotspot network before (a) and after (b) the earthquake
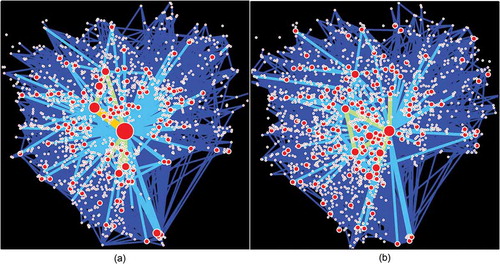
Table 4. Scaling properties of the observed flow and simulated flow in Tokyo before and after the earthquake at segment and street levels, respectively
3.3. Correlation between observed flow and simulated flow
As a further verification of our simulation results, we chose three large hotspots located in the downtown area of the two target cities and correlated the street-based observed flow with the street-based simulated flow for each hotspot. In order to make results comparable among the three cases, we selected the largest hotspot for London, and the second largest hotspot (around Shinjuku station) for Tokyo, before and after the earthquake, respectively (), as the number of streets in each hotspot was similar. The relevant R square value turned out to be relatively high (between 0.67 and 0.88, ), indicating that the simulation model quite accurately reflected the actual urban movements. It is noteworthy that for each hotspot, the highest correlation was always produced when the combined distance type was used (followed, in order, by the angular and metric distances).
Figure 8. (Color Online) (a) Selected hotspots for correlation tests in London; (b) selected hotspots in Tokyo before the earthquake and (c) after the earthquake, along with the contained natural streets
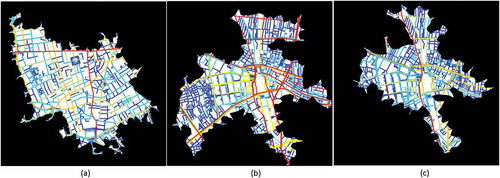
Table 5. R-square values indicating the correlation between street-based observed flow and simulated flow within the selected hotspots
4. Discussion
In this study, the heterogeneity of human urban movements is represented in many different ways, e.g. number of tweets per trajectory, trajectory lengths and durations, the size of detected hotspots, and observed movement flows. Almost all these metrics can be characterized as having a power law distribution, which is consistent with numerous previous studies (e.g. Brockmann et al. Citation2006, Gonzalez et al. Citation2008, Song et al. Citation2010, Hawelka et al. Citation2014, Han et al. Citation2017). The remarkable presence of the power law distribution leads us to important insights into human mobility patterns. Starting with user trajectory, the wide range between the maximum and minimum number of tweets indicates imbalanced human activities. Such imbalance is also apparent over the urban space, as the various densities of tweet locations are represented by different-sized urban hotspots. With respect to observed movement flow, this study finds that both segment- and street-based flows have power-law characteristics, indicating that a minority of segments/streets account for a majority of urban traffic. Therefore, urban-scale human movements at a collective level have a strong power law nature.
This study also attempts to explore the underlying mechanism of human mobility patterns using a two-level ABM, although readers may question whether the constructed simulation model is capable of effectively capturing the essence of human movements. Apart from the high correlation between simulated flow and observed flow (Section 3.3), we address this question from two perspectives: (1) What if human movements are not confined to the hotspot network? and (2) What do the movement flows based on different route choices imply? To address these two questions, we introduce a jumping factor (JF) into our model. JF is one of the parameters needed for calculating PageRank scores (Page and Brin Citation1998), as shown in EquationEquation (7)(7)
(7) :
where is PageRank, is number of hotspots,
are the hotspots that point to hotspot
, and
represents the number of outgoing links from hotspot
.
According to EquationEquation (7)(7)
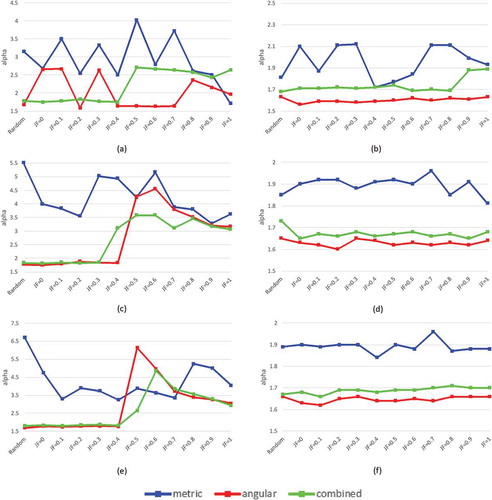
(7) , the smaller the JF, the greater the chance that the agent hops randomly from one hotspot to an unconnected hotspot. We can, therefore, tune the JF value in the range of 0 to 1 to make the agent’s walk progressively constrained by the hotspot network. We also added a totally random scenario to ensure that our test is comprehensive. The difference between JF = 0 and complete randomness is that, in the former scenario, agents can only hop randomly between hotspots, whereas in the latter scenario agents can move with complete freedom across the entire city. We conduct a series of simulations with the three distance types for both London and Tokyo. ,c,e) show that the power law exponents (i.e. the
values) become increasingly closer to the observed
value as we go from fully random to totally restricted, as is the case with the segment-based movement flow. In this regard, the observed human urban movements are highly influenced by the urban hotspots.
To address the second question, which concerns the implications of the various movement flows based on the different routing strategies, we examine the value of each movement flow at both the segment and street levels for every test scenario. One very interesting finding is that the
values for the combined strategy are generally between the metric and angular
values and show the least fluctuations. In the London case, the
values for the simulated segment- and street-based flows using the combined strategy are closest to those of the observed flows. This is in line with our correlation results, where the R square value based on the combined strategy is the largest ().
The good performance of mixed distance implies the essential interactions between the geographical (metric distance for short trips) and geometric costs (angular distance for long trips) which refer respectively to the energy consumption and cognitive efforts, and thus revealing how people utilize geometrically the urban physical space. Readers may notice that the mixed distance used the mean length of extracted trajectories for classifying short and long trips during the simulation. The reason why the mean trip length works because it appears to be very effective to identify the imbalanced ratios between short and long trips (e.g. 70% versus 30% as the case in London) rather than balanced ones (e.g. 50% versus 50%). The imbalance contrast between short and long trips underlies the long-tail statistics of the urban-scale human activities so that it can facilitate the ABM to mimic, to a great extent, observed human urban movements.
From ) we can also see that, compared to the segment-based flows, the values for the street-based flows vary only slightly between the various routing strategies. This echoes previous research (Jiang et al. Citation2009) that found that human movement patterns formed by different moving behaviors remain similar at the street level. Furthermore, while all the
values derived from the street-based flows are within the range 2
0.4, the range is much wider for the
values associated with the segment-based flows, where some of the
values are far beyond the upper power-law limit. In this regard, streets significantly outperform segments in terms of modeling the heterogeneity of human movements regardless of the choice of routing strategy.
Figure 9. (Color Online) The relationship between the JF and power law exponent values of simulated segment- and street-based flows using three distance types in London (Panels a and b), in Tokyo before (Panels c and d) and after the earthquake (Panels e and f)
Based on the above findings, we conjecture that the scaling structure of geographic space governs human mobility patterns. In other words, it is the heterogeneous spatial configuration that leads to the uneven spatial distribution of individual locations and the power-law characteristics of the movement flows. This spatial configuration is effectively revealed by a topological representation based on the detected hotspots and natural streets. The topological representation enables us to see not only the scaling statistics of the urban space but also the complexity of the urban geometrical patterns. A city is comprised of many interrelated, coherent hotspots. In many ways, the city-to-hotspot relationship resembles the relationship of a country to its numerous coherent cities (Jiang Citation2017). Cities are complex systems and can represent the most important aspects of a country, such as economic and culture. In the same vein, hotspots can reveal the key aspects of a city. By considering the collection of hotspots as a whole (i.e. the hotspot network), we are better able to understand a city’s structure, as well as its relationship with human activities, from the angle of organized complexity (Jacobs Citation1961). Natural streets can be viewed as the skeleton of the city whose dual graph is itself a complex network (Jiang et al. 2008). Both hotspots and natural streets possess a striking scaling hierarchy that includes a great many small things, a few large things, and some things in between, all of which results in the great heterogeneity of human urban movements.
5. Conclusion
The grasp of human urban movements is the key to solving complex urban problems. The paper develops an innovative methodology to explore the underlying mechanisms of the heterogeneity of human movements in the urban space. Two kinds of topological representations: abstract networks of city hotspots and underlying street networks, in London and Tokyo help us understand the scaling structure of urban space. The subsequent two-layered ABMs provided explicit evidence supporting that the urban structure, i.e. the combination of uneven spatial distributions of city hotspots and power-law characteristics of street networks, lead to scaling properties of human mobility patterns at the collective level. The study also considers the cognitive effect by setting three moving strategies on the street network: metric, angular, and mixed. As results, the value of simulated segment-based flow adopting the mixed strategy is the closest to that of the corresponding observed flow, which means that people tend to perform a mixed route choice between least-angular-change and shortest-length for urban movements. Moreover, the similar scaling statistics among three types of simulated street-based flows indicate that the cognitive effects impact more on the individual movement patterns, but less on the scaling nature – an essential aspect of the heterogeneity of collective movements.
The proposed methodology in this study can be positioned in the complexity science context and is embedded with data-intensive computing. The methods used, such as TIN-based clustering, head/tail breaks, complex network analysis and ABM, may be useful to many urban applications. Particularly, urban clusters or city hotspots derived in different time periods may give opportunities for traffic congestion detection and disaster management; ABM would be very effective in monitoring urban traffics based on different moving behaviors, and thereby exploring the relationship between city’s spatial structure and human movements. Through simulating the interactions between moving agents, city hotspots, and urban streets from the bottom up, our work exemplifies the emergence of collective behavior (Goldstone and Gureckis Citation2009) in the urban space. Further research can improve the noise filtering method of trajectory extraction, such as refining the cutoff setting for the removal of abnormal tweets or users by referring to other big data sources like mobile phone data. Insofar as the proposed methodology has proven workable in modeling collective movement behaviors, we anticipate extending this methodological framework to study other collective behaviors in a wider spatial setting, e.g. at the country level.
Data and codes availability statement
The source code and data that support the findings in this study are available on figshare. To protect research participant privacy and consent, Tokyo tweet data cannot be made publicly available. The link to source code and data: https://doi.org/10.6084/m9.figshare.5677516.
Disclosure statement
No potential conflict of interest was reported by the authors.
Additional information
Funding
Notes on contributors
Ding Ma
Ding Ma is a postdoctoral fellow in the School of Environment and Society at Department of Architecture and Building Engineering, Tokyo Institute of Technology, Japan. His research interests concentrate on topological and scaling analysis, and complexity modeling of urban structure, particularly in the context of big data.
Toshihiro Osaragi
Toshihiro Osaragi is Professor of School of Environment and Society, Tokyo Institute of Technology. He has served as Associate Professor in the same institution before (1993), and was Visiting Scholar at the Centre for Advanced Spatial Analysis (CASA), University College London (2001). His research interest includes spatiotemporal analysis of urban activities, modeling of human behavior, spatial cognition, spatial statistics, decision support systems, planning theory of housing estates, disaster mitigation planning, simulation and visualization of pedestrian movement, and so on.
Takuya Oki
Takuya Oki is Associate Professor in the School of Environment and Society at Department of Architecture and Building Engineering, Tokyo Institute of Technology, Japan. His research interests include architectural planning, geographic information science, and big data analysis.
Bin Jiang
Bin Jiang is Professor of computational geography at Division of GIScience, University of Gävle, Sweden. His research interests center on geospatial analysis of urban structure and dynamics, e.g. topological analysis, and scaling hierarchy applied to buildings, streets, and cities, or geospatial big data in general, for better understanding cities, as well as for better making and remaking cities.
Related Research Data
References
- Azmandian, M., et al., 2013. Following human mobility using tweets. In: L. Cao, et al., eds. Agents and data mining interaction. 2012. Berlin: Springer, 139–149.
- Barabási, A.L., 2005. The origin of bursts and heavy tails in human dynamics. Nature, 435, 207–211. doi:10.1038/nature03459
- Batty, M., 2008. The size, scale, and shape of cities. Science, 319, 769. doi:10.1126/science.1151419
- Bettencourt, L., et al., 2007. Growth, innovation, scaling and the pace of life in cities. PNAS, 104 (17), 7301. doi:10.1073/pnas.0610172104
- Bettencourt, L., 2013. The origins of scalling in cities. Science, 340, 1438. doi:10.1126/science.1235823
- Blumenfeld-Lieberthal, E. and Portugali, J., 2010. Network cities: a complexity-network approach to urban dynamics and development. In: B. Jiang and X. Yao, eds. Geospatial analysis of urban structure and dynamics. Berlin: Springer, 77–90.
- Brockmann, D., Hufnage, L., and Geisel, T., 2006. The scaling laws of human travel. Nature, 439, 462–465. doi:10.1038/nature04292
- Carvalho, R. and Penn, A., 2004. Scaling and universality in the micro-structure of urban space. Physica A, 332, 539. doi:10.1016/j.physa.2003.10.024
- Clauset, A., Shalizi, C.R., and Newman, M.E.J., 2009. Power-law distributions in empirical data. SIAM Review, 51, 661–703. doi:10.1137/070710111
- Dalton, R.C., 2003. The secret is to follow your nose: route path selection and angularity. Environment and Behavior, 35 (1), 107–131. doi:10.1177/0013916502238867
- Freeman, L.C., 1979. Centrality in social networks: conceptual clarification. Social Networks, 1, 215–239. doi:10.1016/0378-8733(78)90021-7
- Gao, S., et al. 2014. Detecting origin-destination mobility flows from geotagged tweets in greater Los Angeles area. In: Proceedings of the eighth international conference on geographic information science. Vienna, Austria, 1–4.
- Goldstone, R.L. and Gureckis, T.M., 2009. Collective behavior. Topics in Cognitive Science, 1 (3), 412–438. doi:10.1111/tops.2009.1.issue-3
- Gonzalez, M., Hidalgo, C.A., and Barabási, A.-L., 2008. Understanding individual human mobility patterns. Nature, 453, 779–782. doi:10.1038/nature06958
- Han, S.Y., Tsou, M.-H., and Clarke, K.C., 2017. Revisiting the death of geography in the era of big data: the friction of distance in cyberspace and real space. International Journal of Digital Earth, 11, 1–19
- Hawelka, B., et al., 2014. Geo-located Twitter as proxy for global mobility patterns. Cartography and Geographic Information Science, 41, 260–271. doi:10.1080/15230406.2014.890072
- Hillier, B. and Iida, S., 2005. Network and psychological effects in urban movement. In: A.G. Cohn and D.M. Mark, eds. Proceedings of the International Conference on Spatial Information Theory, COSIT 2005, 14-18 September. Ellicottville, NY, LNCS 3693, 475–490.
- Hillier, B., 2012. Studying cities to learn about minds: some possible implications of space syntax for spatial cognition. Environment and Planning B: Planning and Design, 39 (1), 12–32. doi:10.1068/b34047t
- Jacobs, J., 1961. The death and life of Great American cities. New York: Random House.
- Jayasinghe, A., Sano, K., and Nishiuchi, H., 2015. Explaining traffic flow patterns using centrality measures. International Journal for Traffic and Transport Engineering, 5 (2), 134–149. doi:10.7708/2217-544X
- Jia, T., et al., 2012. An empirical study on human mobility and its agent-based modeling. Journal of Statistical Mechanics: Theory and Experiment, 2012 (11), P11024. doi:10.1088/1742-5468/2012/11/P11024
- Jiang, B., 2013. Head/tail breaks: A new classification scheme for data with a heavy-tailed distribution. The Professional Geographer, 65 (3), 482–494. doi:10.1080/00330124.2012.700499
- Jiang, B., 2017. A topological representation for taking cities as a coherent whole. Geographical Analysis, 50 (3), 298–313. doi:10.1111/gean.12145
- Jiang, B. and Yin, J., 2014. Ht-index for quantifying the fractal or scaling structure of geographic features. Annals of the Association of American Geographers, 104 (3), 530–541. doi:10.1080/00045608.2013.834239
- Jiang, B., Yin, J., and Zhao, S., 2009. Characterizing human mobility patterns in a large street network. Physical Review E, 80, 021136. doi:10.1103/PhysRevE.80.021136
- Jiang, B., Zhao, S., and Yin, J., 2008. Self-organized natural roads for predicting traffic flow: A sensitivity study. Journal of Statistical Mechanics: Theory and Experiment, P07008.
- Jurdak, R., et al., 2015. Understanding human mobility from Twitter. PloS One, 10 (7), e0131469. doi:10.1371/journal.pone.0131469
- Ma, D., et al., 2018. Why topology matters in predicting human activities? Environment and Planning B: Planning and Design, 46 (7), 1297–1313.
- Mayer-Schonberger, V. and Cukier, K., 2013. Big data: a revolution that will transform how we live, work, and think. New York: Eamon Dolan/Houghton Mifflin Harcourt.
- Newman, M.E.J., 2005. Power laws, Pareto distributions and Zipf’s law. Contemporary Physics, 46 (5), 323–351. doi:10.1080/00107510500052444
- Noh, J.D. and Rieger, H., 2004. Random walks on complex networks. Physical Review Letters, 92 (11), 118701. doi:10.1103/PhysRevLett.92.118701
- Oki, T., 2018. Possibility of using tweets to detect crowd congestion: a case study using tweets just before/after the Great East Japan Earthquake. In: Proceedings of 15th International Conference on Information Systems for Crisis Response and Management (ISCRAM 2018). Rochester, NY, 584–596.
- Omer, I. and Jiang, B., 2015. Can cognitive inferences be made from aggregate urban flow data? Computers, Environment and Urban Systems, 54, 219–229. doi:10.1016/j.compenvurbsys.2015.08.005
- Osaragi, T., Kishimoto, M., and Oki, T., 2018. Assessment of street network accessibility in Tokyo metropolitan area after a large earthquake. Journal of Disaster Research, 13 (2), 262–271. doi:10.20965/jdr.2018.p0262
- Page, L. and Brin, S., 1998. The anatomy of a large-scale hypertextual Web search engine. In: Proceedings of the Seventh International Conference on World Wide Web. Brisbane, Australia, 107–117.
- Rhee, I., et al., 2011. On the levy-walk nature of human mobility. IEEE/ACM Transactions on Networking, 19 (3), 630–643. doi:10.1109/TNET.2011.2120618
- Serra, M. and Hillier, B., 2018. Angular and metric distance in road network analysis: a nationwide correlation study. Computers, Environment and Urban Systems. doi:10.1016/j.compenvurbsys.2018.11.003
- Shen, Y., et al., 2019. Physical co-presence intensity: measuring dynamic face-to-face interaction potential in public space using social media check-in records. PloS One, 14 (2), e0212004. doi:10.1371/journal.pone.0212004
- Song, C., et al., 2010. Modelling the scaling properties of human mobility. Nature Physics, 6, 818–823. doi:10.1038/nphys1760
- Stephen, L. and Traunmueller, M., 2017. Off the shortest path: betweenness on street network level to study pedestrian movement. In: Proceedings of 2017 IEEE 20th International Conference on Intelligent Transportation Systems (ITSC), 971–976. doi:10.1177/1753193417718417
- Stroock, D.W., 2005. An introduction to Markov processes. Heidelberg, Germany: Springer-Verlag.
- Wu, L., et al., 2014. Intra-urban human mobility and activity transition: evidence from social media check-in data. PloS One, 9 (5), e97010. doi:10.1371/journal.pone.0097010