
 ?Mathematical formulae have been encoded as MathML and are displayed in this HTML version using MathJax in order to improve their display. Uncheck the box to turn MathJax off. This feature requires Javascript. Click on a formula to zoom.
ABSTRACT
Covid-19 left many employees with life-altering challenges— deaths or illnesses of loved ones, health problems, and economic upheavals. Even during ordinary years, adverse events affect around 50% of employees, exacerbating work/non-work demands and depleting personal resources. In order to identify supports for employee recovery from the pandemic and similar crises, we examine inclusive relational practices. Drawing on a conservation-of-resources framework, we posit that inclusive practices are a greater resource for employees following adverse life-events. Using data on U.S. employees from the 2016 National Study of the Changing Workforce, we examine relationships between workplace inclusion and self-rated health, presenteeism and work-to-personal/family spillover. We find that inclusive practices are negatively associated with poorer health/well-being, with benefits significantly higher for employees following adverse life-events. Our study contributes to work-life and diversity-inclusion scholarships by studying dimensions of inclusion rarely captured in nationally-representative data and replicating prior evidence in a more diverse sample of U.S. employees. This is the first study to investigate the role of relational practices among coworkers and between employees and their leaders, in aiding recovery following adverse life-events. Findings indicate that workplace inclusion may be an underutilized resource for supporting recovery from the pandemic and in a post-Covid world.
Introduction
In December 2020, 3 million people in the U.S. were on temporary lay-off; 15.8 million reported not working or unable to work their regular number of hours because their employer had shut down or lost business due to the pandemic, with only 12.8% receiving some pay for this missed work (U.S. Department of Labor, January 8, Citation2021). In addition to such personal repercussions on employment, researchers estimate each Covid-19 related death to be associated with nine individuals losing a close relative (Verdery et al., Citation2020). Given that the U.S. Covid-19-related death count at the start of July 2021 was more than 600,000 (U.S. Department of Health and Human Services, July 8, Citation2021), many employees returning to work will be under the shadow of lost loved ones, economic adversities and other challenges brought on by changing life and work circumstances.
While Covid-19 may be a once-in-a-lifetime scenario affecting the entire workforce, in ‘normal’ times before the pandemic, a smaller yet still significant proportion of the workforce regularly faced somewhat similar crises. A long line of studies has established adverse health and well-being consequences of adverse life-events, including increased risks for physical and mental illnesses, and increased presenteeism through increases in role demands and time demands (Cohen et al., Citation1997, Citation2019; Kessler, Citation1997; MacGregor et al., Citation2008; Miraglia & Johns, Citation2016; Pries et al., Citation2020; Shor et al., Citation2012). Unsurprisingly, health consequences of the pandemic have been widespread with more than half of U.S. adults (53%) reporting negative effects of stress during the 2019–2020 pandemic (Panchal et al., Citation2020). There is thus an urgent need to know now and for the future, what workplace actions could help mitigate negative consequences and support employees as they recover from adverse life-events that deplete their personal resources, pose new work versus non-work demands, and test their health and well-being.
In this scenario, how might workplace practices help in the recovery and ultimately, the renewal, of employee health? Our study is prompted by this concern and our purpose is to identify practices by supervisors, organizational leaders and coworkers that could support employees’ recovery from adverse life-events. Specifically, we examine inclusive relational practices (IRPs) – informal, interpersonal behaviors and exchanges between employees and leaders, and among coworkers, that enable employees to feel accepted, valued, supported, and involved in their workplaces (Mor-Barak & Cherin, Citation1998; Mor Barak & Levin, Citation2002; Ryan & Kossek, Citation2008). We will examine the relationship between workplace inclusiveness and self-rated health status, presenteeism, and work-to-personal/family spillover.
Our focus on IRPs as a potential resource for aiding employee recovery, is motivated by recent developments in the work-life and diversity-inclusion scholarships.
Contributions from work-life (W-L) literature. The more typical place to turn to for answers regarding how to help employees recover after challenging life-events, may seem to be policies and programs like paid leaves and flexibility in working time and place. Indeed, these types of strategies remain the major focus for employees’ recovery and readjustment as they return to work after the Covid-19 crisis as well.Footnote1 Yet, in a previous study we conducted, we find that access to workplace flexibility policies was not related to job engagement, job satisfaction, or health. The most significant predictor of employee well-being and health was the extent of supervisor and coworker support for working flexibly (Kim et al., Citation2020). Evidence from studies in the work-life field continue to accumulate, showing time and again, that such policies set a floor but are not sufficient, and that supervisors, organizational leaders and coworkers play an essential role in ensuring that flexible policies achieve their intended effect without unintended backlash (Behson, Citation2005; Blair-Loy & Wharton, Citation2002; Bond et al., Citation1998; Roehling et al., Citation2001; Ryan & Kossek, Citation2008; Thompson et al., Citation1999).
Studies have conceptualized and examined multiple inter-connected relational practices that, by promoting inclusion of diverse non-work roles and life circumstances, act as key work-based resources for employee health and well-being (Arnold, Citation2017; Kelly et al., Citation2014; Kossek et al., Citation2011, Citation2018; Moen et al., Citation2016; Ryan & Kossek, Citation2008). The majority of research in this area has examined relational practices of leaders. Among inclusive practices of leaders, family supportive supervisory behavior (FSSB), conceptualized as a contextual resource involving provision of both practical or instrumental support and emotional support (Hammer et al., Citation2007, Citation2009; Kossek et al., Citation2018), has been extensively investigated and linked to less work-family spillovers and better psychological health (Greenhaus et al., Citation2012; Hammer et al., Citation2011; Inceoglu et al., Citation2018; Kelly et al., Citation2014; Thomas & Ganster, Citation1995). Similarly, a transformational leadership style, conceptualized as one that creates or increases access to work-based resources, including but not limited to FSSB (Kossek et al., Citation2018), has been linked to reduced stress and increased trust, well-being and better psychological health (Arnold, Citation2017; Inceoglu et al., Citation2018; Kossek et al., Citation2018; Nielsen et al., Citation2008; Nielsen & Daniels, Citation2016).
A related, albeit smaller, body of work has additionally examined relational practices by coworkers as a key work-based resource for employee health and well-being, linking it to higher job satisfaction, lower exhaustion and greater mental and emotional well-being overall (Minnotte & Varud, Citation2020). Coworker support is specifically linked to emotional and mental health benefits, including protection against the stresses of negative relational experiences at work and job satisfaction (Ducharme et al., Citation2007; Sloan, Citation2012; Zacher et al., Citation2014).
Contributions from diversity-inclusion (D/I) literature. Other fields have similarly concluded that workplace practices are essential, over and above policies, and that relationship-based approaches are core work-based resources for employees (Mor-Barak, Citation2000; Mor-Barak & Cherin, Citation1998; Roberson, Citation2019). Diversity-inclusion scholarship underscores the critical role of leadership in bridging the policy-practice gap and in the ‘adoption of policies intended to value employees for who they are and involve them in organizational processes’ to the ‘enactment of practices intended to implement these policies’ (Mor Barak et al., Citation2021). Studies emphasize positive leader-member exchanges or interactions, especially those that demonstrate to employees that leaders are attentive to their personal needs (Mor Barak et al., Citation2021; Graen & Uhl-Bien, Citation1995; Brimhall et al., Citation2017; Nishii & Mayer, Citation2009). Such high-quality interactions are negatively associated with employee stress, psychological distress and depression (Gregory & Osmonbekov, Citation2019; Rousseau et al., Citation2008). Studies have also shown that lack of inclusion, specifically workgroup support and belonging (access to information, connectedness to coworkers, and work-group involvement) or ability to influence decision-making, are associated with lower well-being (Mor Barak & Levin, Citation2002).
Yet significant gaps in our knowledge remain. First, most studies in the work-life and diversity-inclusion fields are conducted with samples drawn from specific firms, occupations or industries, that typically do not reflect the diversity of the U.S. labor force, limiting the extent to which findings can be generalized. Second, most studies focus on a specific set of practices and rarely include multiple dimensions or sources of inclusive relational practices. Third, while inclusion has become a critical goal for organizations in managing a workforce with increasingly diverse identities and circumstances, its implications for employees’ health/ well-being remain underexplored. These are the gaps our study is designed to address. Finally, to our knowledge, this is the first study to investigate the role of inclusive relational practices in aiding employee recovery following adverse events.
Using data from the 2016 National Study of the Changing Workforce (NSCW), a nationally representative survey of U.S. employees, we identify multiple indicators of inclusive practices as well as key health/well-being outcomes. We first examine whether inclusive relational practices (IRPs) are associated with employees’ self-reported health status, presenteeism behavior and work-to-family spillover, using the entire sample of employees. Next, we examine whether these associations vary for employees who have experienced recent adverse life-events. To do so, we identify a subsample of employees who reported experiencing adverse life-events in the last year, events that closely resembled adverse health-related and economic consequences of the pandemic, such as experiencing a serious illness, the passing away of a close relative or friend, providing care for someone with a serious illness, job loss of a spouse or partner, close coworkers being laid off and being unemployed for part of the year. We then compare them with employees who did not have these experiences.
Because of our interest in the role of IRPs as resources in the context of recovery from crises, we draw on the Conservation of Resources (Hobfoll & Shirom, Citation1993; Hobfoll et al., Citation2018) theory. According to this theory, employees who experience resource losses or threats to resource losses (such as would be expected for those facing adverse life-events) will be motivated to conserve resources and, as a result, be more effective in utilizing remaining resources or benefit more from remaining resources. In this study, we indeed find inclusive relational practices to be associated with a significantly lower likelihood of adverse health and well-being outcomes for all employees, and even more so for employees who had recently experienced adverse life-events.
Theoretical framework
Below, we present a more in-depth theorization of workplace inclusion and its relationship with employee health/well-being that has guided our hypotheses.
Workplace inclusion
Despite overlaps in concepts, approaches, and a common goal of identifying practices that would improve the lives of employees who are more likely to be excluded from opportunities, there has been limited engagement between the diversity-inclusion and work-life scholarships. An important exception is an analytical essay where, drawing on the central ideas of acceptance, support, involvement, integration, and value highlighted in the diversity-inclusion scholarship (Mor-Barak & Cherin, Citation1998; Pelled et al., Citation1999; Roberson, Citation2006), work-life scholars Ryan and Kossek (Citation2008) conceptualize a workplace as inclusive with regard to work-life issues when it accepts employees’ non-work and caregiving identities, values diversity in managing work versus non-work roles, supports employees in successfully combining work and non-work demands, and does not hold the non-work aspects of their lives as barriers to employee involvement in the organization (Ryan & Kossek, Citation2008).
Keeping this idea of inclusion in mind, we focused on four common ideas, or thematic groupings, identified in the diversity-inclusion scholarship (Roberson, Citation2019; Shore et al., Citation2018) to conceptualize workplace inclusion. We introduce each dimension or set of related practices based on concepts in the diversity-inclusion literature, highlight its connection with the work-life literature and provide examples of actionable steps found in one or both of these literatures.
| (1) | Workgroup Support and Belonging (WGSB): The WGSB dimension of workplace inclusion captures the extent to which an employee feels accepted and treated as an insider, their involvement in the workgroup, as well as their access to critical information and resources (Mor-Barak & Cherin, Citation1998; Pelled et al., Citation1999; Randel et al., Citation2018; Shore et al., Citation2011, Citation2018). It encompasses supportive practices related to both task-based and non-task-based functions, and reflects the extent to which workplace interactions and behaviors among coworkers and between employees and supervisors, could be perceived as promoting the ‘involvement of all employees regardless of their non-work demands and preferences’ (Ryan & Kossek, Citation2008). | ||||
Fostering WGSB could involve setting up shared norms by leaders to encourage belongingness without insisting on assimilation (Randel et al., Citation2018; Shore et al., Citation2011), thus allowing employees with a diverse set of backgrounds and life circumstances to feel included. Encouraging ‘collective responsibility’ is a particularly important actionable step (Dulebohn et al., Citation2012; Nelson et al., Citation2019).
| (2) | Participatory Decision-Making (PDM): The PDM dimension of workplace inclusion captures the degree to which individuals feel a part of critical organizational processes, are allowed to participate and to contribute fully (Mor Barak, Citation2000; Miller, Citation1998; Shore et al., Citation2018). It is aligned with the idea in work-life scholarship that inclusive workplaces do not allow employees’ non-work or caregiving roles to become ‘barriers to an individual fully contributing and fulfilling one’s potential at work’ (Ryan & Kossek, Citation2008). Leaders could foster PDM by helping all employees fully express their ideas (Leroy et al., Citation2021), invite participatory contributions from employees and express appreciation for differing viewpoints (Nembhard & Edmondson, Citation2006). | ||||
| (3) | Culture of Respect and Trust (CRT): The CRT dimension of workplace inclusion captures the extent to which workplace exchanges are ‘characterized by mutual respect’ such that employees ‘feel part of the in-group where trust is equally shared’ (Mor Barak et al., Citation2021). It reflects inclusive leadership practices (such as transformational leadership) that impart a sense of psychological safety (Arnold, Citation2017; Nembhard & Edmondson, Citation2006) and could thus reduce threats to exclusion often felt by employees who are different from the majority of their coworkers or leaders, in terms of non-work identities, roles or life circumstances. In this way, it is aligned with the notion of inclusive workplaces as those that ‘support variation in domestic backgrounds and in blending work and non-work demands’ (Ryan & Kossek, Citation2008). Scholars have argued that ‘interdependent helping behaviors’ among coworkers especially in collaborative settings, could be instrumental in fostering trust among coworkers (Nelson et al., Citation2019), with some suggesting such helping behavior be actively encouraged and be embedded into the organizational reward system (Halbesleben & Wheeler, Citation2015). | ||||
| (4) | Whole Employee Approach (WEA): The WEA dimension of workplace inclusion captures the extent to which employees feel that they are respected and valued as whole persons, and not merely for their roles as employees. It reflects relational practices such as ‘showing a genuine interest in others’ that are a hallmark of inclusive leadership (Mor Barak et al., Citation2021; Roberson & Perry, Citation2021) and is conceptually aligned with behaviors exhibited by transformational leaders, like ‘expressing genuine concern about individual employees’ needs’ that are considered important for creating resources like family supportive supervisory behaviors (Kossek et al., Citation2018). | ||||
We additionally consider the extent to which workplaces value the health needs of employees as an essential element of a whole employee approach. Supervisor’s perceived support for family needs and perceived support for health are both associated with better health outcomes (Katz et al., Citation2019; Kim et al., Citation2020; Kwon & Marzec, Citation2019).
Experimental studies suggest that a whole employee approach may be promoted through leadership training focused on modifying interactions to demonstrate support for employees’ non-work roles; such interventions have modest but significant impact on increasing family supportive behaviors (Kelly et al., Citation2014).
Workplace inclusion and employees’ health/well-being
As mentioned in the introduction, IRPs are considered work-based resources for supporting employees’ health and well-being. In this section, we first develop hypotheses connecting workplace inclusion to our three specific health/well-being outcomes, which are fair/poor self-rated health status, going to work sick (presenteeism) and negative work-to-personal/family spillover. We then extend the analysis to the context of employees’ recovery from adverse life-events and describe how IRPs are potentially more consequential for employees’ health and well-being after crises.
Workplace Inclusion and Self-Rated Health Status The first outcome of interest in this study is self-rated health status, a widely-used summary measure of overall health and valid predictor of mortality in a wide variety of populations (Idler & Benyamini, Citation1997; Jylhä, Citation2009); we are specifically interested in the negative outcome, fair or poor self-rated health. There are direct and indirect ways through which inclusive relational practices could affect employees’ overall health.
First, an extensive body of work has established that social relationships and social support, in general, are key determinants of individual health and well-being (Cohen, Citation2004; Cohen & Wills, Citation1985; House et al., Citation1988; Thoits, Citation2011; Uchino et al., Citation2012). In the context of workplace social support as well, applications of the job-demands-resources model (Bakker & Demerouti, Citation2007; Karasek, Citation1979) show that supportive leader and coworker behaviors are key psycho-social resources that moderate the effect of job-demands and stressors on employees’ health and well-being (Bavik et al., Citation2020; Ganster & Rosen, Citation2013; Peckham et al., Citation2019; Thoits, Citation2011).
Second, workplace inclusion may indirectly affect employees’ overall health through its association with job satisfaction (Shore et al., Citation2011), a significant and consistent predictor of employee health (Faragher et al., Citation2005, Citation2013; Fischer & Sousa-Poza, Citation2009). Third, negative relational experiences like discrimination, hostility, bullying, and mistreatment are associated with increased likelihood of hypertension, sickness-related absences, as well as fair/poor self-reported health status (Asfaw et al., Citation2014; Kaur et al., Citation2014; Luckhaupt et al., Citation2017). To the extent that increased inclusiveness reduces such experiences, an indirect health effect may be observed.
Hypothesis 1: workplace inclusiveness will be negatively associated with fair/poor self-rated health among employees overall.
Workplace Inclusion and going to work sick (Presenteeism). Presenteeism behavior – employees going to their place of work even when they are sick – has repeatedly emerged as a public health concern because of its role in the spread of contagious diseases. Current research provides mixed messages regarding the relationship of presenteeism with workplace inclusion because of two opposing influences. More job resources are typically expected to reduce unhealthy behaviors (Bakker et al., Citation2005, Citation2014; Schaufeli & Taris, Citation2014). Inclusive practices may thus decrease presenteeism through job resources like employees’ control over their jobs via participatory decision-making, or through workplace social support via a whole employee approach. Hammer et al. (Citation2013) have shown that FSSB, a construct most aligned with the whole employee approach described earlier, is negatively associated with an employee inclination to work when sick.
On the other hand, inclusive leadership practices such as transformational leadership, increase participation, engagement and organizational citizenship behavior, which are associated with increased presenteeism behavior (Arnold, Citation2017; Inceoglu et al., Citation2018; Macey & Schneider, Citation2008; Miraglia & Johns, Citation2016; Nielsen & Daniels, Citation2016). Workgroup support and belonging may similarly increase presenteeism by enhancing job satisfaction and organizational citizenship behavior (Miraglia & Johns, Citation2016). However, a culture of respect and trust can increase self-disclosure of health issues (Munir et al., Citation2005) and thereby reduce the likelihood of employees coming in to work sick. Additionally, presenteeism behavior may itself be an indicator of a workplace culture where employees are expected to prioritize workplace presence above all else. Taken together, prior research does not provide a clear indication about the relationship between overall workplace inclusion and presenteeism.
Question 1: What is the relationship between workplace inclusiveness and presenteeism? Workplace Inclusion and Work-to personal/family spillover. Past and current research shows informal mechanisms of work-family support to be more predictive of work-to-family spillover, than formal benefits (Behson, Citation2002, Citation2005) and may, in fact, encourage employees to utilize formal benefits that support better management of work versus non-work responsibilities (Allen, Citation2001; Thompson et al., Citation1999). The strongest prior evidence on the work-life consequences of inclusive relational practices come from experimental and quasi-experimental studies linking family supportive supervisory behaviors to reductions in work-to-personal/family spillovers (Hammer et al., Citation2009, Citation2013; Kelly et al., Citation2014; Kossek et al., Citation2011, Citation2018).
Additionally, the psychological safety accorded by a culture of respect and trust, as well as the emotional support provided through workgroup support and belonging, also suggests a greater likelihood that employees will be less likely to fear exclusion on account of non-work demands, better able to disclose needs and request support, and therefore, be able to manage work and non-work demands.
Hypothesis 2: workplace inclusiveness will be negatively associated with negative work-to-personal/family spillovers among employees overall.
Workplace Inclusion as a resource for employees after crises. In order to understand how workplace actions might benefit employees during recovery from adverse life-events, we draw on Conservation of Resources (COR) (Hobfoll & Shirom, Citation1993; Hobfoll et al., Citation2018), which is relevant here. A core tenet of the COR theory is that workplace resources will be particularly consequential in the context of resource loss, when the need to conserve existing resources is higher. Thus, employees who recently experienced adverse life-events and therefore experienced a loss of or threats to personal and social resources, are expected to be motivated to conserve remaining resources and make better utilization of the available resources. Specifically, it follows from the ‘gain paradox principle’ of COR, ‘Resource gain increases in salience in the context of resource loss. That is, when resource loss circumstances are high, resource gains become more important—they gain in value.’
Prior experimental and quasi-experimental studies also indicate that supportive resources for managing work versus non-work demands, may be most beneficial to employees who are more vulnerable to work-life conflict (Hammer et al., Citation2009, Citation2011; Kelly et al., Citation2014). We therefore expect that employees who experienced adverse life-events recently, will gain significantly more health/well-being benefits from inclusive relational practices, compared with employees who experienced no such change of circumstances.
Hypothesis 3 (a): Workplace inclusiveness will be associated with larger reductions in fair/poor health status for employees who experienced adverse life-events recently compared with employees who did not experience any such events.
Hypothesis 3 (b): The association between workplace inclusiveness and presenteeism will differ significantly between employees who faced adversities and those who did not.
Hypothesis 3 (c): Workplace inclusiveness will be associated with larger reductions in negative work-to-personal/family spillovers for employees who experienced adverse life-events recently compared with employees who did not experience any such events.
Materials and methods
Data and sample
The National Study of the Changing Workforce (NSCW) is an ongoing nationally representative survey of adult employees in the U.S. Building on the U. S. Department of Labor’s 1977 Quality of Employment Survey, this study was designed and conducted by Families and Work Institute (FWI) in 1992, 1997, 2002, 2008 and in 2016, becoming a project of the Society for Human Resource Management (SHRM) in 2016. To our knowledge, NSCW is the only nationally representative dataset with information on relational aspects and practices of the workplace, along with health outcomes, that would additionally allow us to identify employees who have recently experienced adverse life-events of the sort that may be expected during and after the pandemic. Moreover, this dataset provides information on a variety of relational practices, giving us the opportunity to incorporate multiple domains and indicators of inclusiveness in our analysis. We used the 2016 wave of this survey. Our analytic sample consisted of wage and salaried employees, 18–85 years old (n = 1516, representing 114,113,066 employees in the U.S.).
Key independent variables – indicators of workplace inclusion
Given that a consistent measure of inclusiveness does not yet exist in the research literature (Shore et al., Citation2018), we attempted to capture its complexity by employing four dimensions. Each describes a different facet of workplace relational practices based on the extant literature on inclusion and our experience with practitioners. We were, however, limited to the scope and available data from the NSCW. While it efficiently covers a breadth of topics of an employee’s life on and off the job, it was not designed to cover all aspects of inclusion with great depth. There are, however, enough questions for us to measure inclusion sufficiently. For the full list of variables, please see Appendix 1.
We conducted confirmatory factor analysis of all the indicators and assessed model fit by examining a standard set of fit indices. We considered the following criteria applied in prior social science research as indicative of good model fit: a standardized root mean square residual (SRMR) of 0.08 or lower, a comparative fit index (CFI) of 0.95 or higher and a Tucker-Lewis index (TLI) of 0.95 or higher (Browne & Cudeck, 1989; Hu & Bentler, 1999; Kline, 2005, as cited in Schreiber et al., Citation2006). We assessed reliability of all indicators by examining the Cronbach’s alpha statistic; we considered alpha above 0.7 as adequate (Nunnally & Bernstein, Citation1994).
Our main indicator of workplace inclusion is a composite measure consisting of four dimensions or clusters of inclusive relational practices that we previously described. Each indicator is a linear combination of multiple items, asking respondents how far they agreed with a given statement about perceived workplace practices; all item responses are measured on a four-point Likert scale (strongly agree, somewhat agree, somewhat disagree and strongly disagree) and we reverse code all items so that lower scores represent lower levels of inclusion.Footnote2 Our main results are based on the overall inclusiveness score (Cronbach’s alpha for the overall inclusiveness = 0.90, CFI = 0.99, TLI = 0.98, SRMR = 0.013) and we additionally present results for the four separate components in the appendices.
Workgroup support and belonging
Workgroup Support and Belonging (WGSB): To measure WGSB, we combined nine items capturing supervisor and coworker practices related to providing task-based or instrumental support (aggregating 5 items, such as ‘My supervisor or manager keeps me informed of the things I need to know to do my job well’; Cronbach’s alpha = 0.89, CFI = 0.98, TLI = 0.97, SRMR = 0.019), non-task-based support or collective responsibility (aggregating 3 items, such as, ‘My coworkers and I appropriately share credit for success and responsibility for shortcomings’; Cronbach’s alpha = 0.88, CFI = 1, TLI = 1, SRMR = 0) and workgroup belongingness (1 item, ‘I feel I am really a part of the group of people I work with’); For the WGSB sub-component of inclusion, Cronbach’s alpha = 0.78, CFI = 1, TLI = 1, and SRMR = 0.
Participatory Decision Making (PDM): To measure PDM, we combined three items capturing practices by organizational leaders regarding employees’ involvement in decision-making processes, such as ‘Managers at my workplace actively seek out information and new ideas from employees at all levels of the organization to guide their decision-making'. For the PDM sub-component of inclusion, Cronbach’s alpha = 0.84, CFI = 1, TLI = 1, SRMR = 0.
Culture of Respect and Trust (CRT): To measure CRT, we combined four items capturing the extent to which workplace exchanges related to coworkers, supervisors and organizational leaders are characterized by mutual respect, such that employees can trust others in their workplace (items include ‘I can trust what my coworkers say’) For the CRT sub-component of inclusion, Cronbach’s alpha = 0.85, CFI = 0.99, TLI = 0.98, SRMR = 0.02.
Whole Employee Approach (WEA): To measure WEA, we combined five items capturing supervisors’ and coworkers’ behaviors that demonstrate the extent to which non-work aspects of employees’ lives are accepted, supported and valued (items include ‘My supervisor or manager is responsive to my needs when I have family or personal business to take care of'). For the WEA sub-component of inclusion, Cronbach’s alpha = 0.86, CFI = 0.98, TLI = 0.96, SRMR = 0.03.
Key independent variable: adverse life-events
We measure adverse life-events based on employees’ reports of one or more of the following health-related or economic events in the last 12 months: ‘A close relative or friend passed away,’ ‘I had a serious illness,’ ‘I started caring for someone with a serious illness or other health issues,’ ‘My spouse/partner was laid off,’ ‘Some of my close coworkers have been laid off,’ and ‘I was unemployed for part of the year.’ About half the employees in the U.S. reported experiencing at least one of these adversities. Footnote3 There were differences by type of life-event –the most common was the passing away of a close relative or friend, an experience shared by 35% of employees.
Outcomes
We examined three binary outcomes to capture employees’ health/ well-being: (1) Self-reported health status: fair or poor (versus excellent or good); (2) Went to work sick: responses of once or more to the question ‘In the past 12 months, how often have you gone to work when you were sick and ought to have stayed at home?’; response of ‘never’ is coded as zero;(3) Negative work to personal/ family spillover: scores above the 75th percentile in linear combinations of four items measuring the extent of spillovers in terms of lack of performance, energy, concentration and time from work to personal or family life.Footnote4
Selection issues and control variables
A key challenge in our estimation strategy is that inclusiveness may not be random and may co-vary with factors that also influence health (such as occupation, education, gender, race). It is thus possible that any observed differences in health by the degree of workplace inclusiveness simply reflects differences in demographic, socio-economic or occupational characteristics. For example, we know that higher incomes are typically associated with better overall health; so, if employees with higher earnings tend to experience higher participatory decision making (PDM) at their workplaces, then any observed relationship between PDM and health may be spurious unless we account for the effect of these differences.
We therefore incorporated several demographic, socio-economic and occupation-related control variables in our analyses. These are demographic characteristics like gender, age, race and ethnicity (non-Hispanic white, non-Hispanic black, Hispanic and Other, or dichotomized as white/ non-white in some models), partnership status (married or cohabiting with partner = 1, versus no partner, never married, widowed, divorced, separated = 0), parental status (having a child less than 18 in the household), socio-economic characteristics like education status (college graduate and above = 1, did not finish college and below = 0), financial insecurity (not able to make ends meet at the end of each month=1, able = 0), family income, own earnings and occupation (manager or professional = 1, Others = 0), occupational characteristics like industry, sector, full or part-time status and other characteristics like chronic health issues (currently receiving treatment for high blood pressure, high cholesterol, heart conditions, diabetes or mental health) or caregiver status (childcare, eldercare or both). Not all variables entered into each model.
Relational practices are, of course, not the only job-related factors affecting inclusion/exclusion and employee health/well-being. Key aspects of the job such as the type of schedule and control over it, job demands, level of autonomy, among other things, could be important confounders of the relationship between inclusive relational practices and employee health/well-being. We therefore also ran models controlling for these job-related variables.
Even though our data allowed adjustments for a variety of potential covariates, results may still be biased due to unobserved heterogeneity.
Analytic strategy
Following the standard approach for estimating binary dependent variables in related literature, we too employed logistic regression models. We modeled the probability of each outcome occurring P (Yi = 1) as a function of each measure of inclusiveness Ij and a set of k controls. Specifically, we estimated the following logit transformation of the ratio of probabilities (or the odds) as a linear function of inclusiveness and the controls.
(1)
(1)
Each Ij in the above multiple logistic regression model is a parameter of interest. In the first part of our analyses, we present the exponentiated coefficient, or the estimated odds ratio and interpret the result as follows –a unit increase in Ij multiplies the odds of Yi = 1 by exp (βj), controlling for the k other variables. These results give us a summary measure of the association between health and workplace inclusiveness and represent the constant effect of each indicator on the likelihood of each outcome, irrespective of the score on the indicator.
A key advantage of the logistic regression model is that it allows the probability of the outcome to vary over the range of values for the independent variable. For our study, this means an increase in the inclusion score at the lower end of the distribution may have different health consequences from a similar increase at the higher end. To capture these more nuanced patterns, we present predicted probabilities (or the weighted proportions adjusted for control variables) at representative values of inclusiveness.
While the above analyses can tell us the potential role for inclusive relational practices in improving employee health in general, they do not tell us if such practices matter more for employees who experienced adversities than for employees who did not. To examine this variation, we followed Long and Mustillo’s (Citation2018) approach for assessing group differences in the effect of a regressor in non-linear models. We introduced an additional control for adverse life-event, ran fully interacted models, and compared group differences in predicted probabilities. Using the marginal effects on probabilities, we examined whether workplace inclusion had the same effect on the probabilities of health/well-being outcomes for employees who experienced adverse life-events and those who did not.
We present two sets of graphs for each outcome to explain our findings. First, we plot the predicted probabilities of outcomes for employees who experienced adverse life-events and those who didn’t, over the full range of inclusion scores, holding other variables at their means. In a second graph, we plot the differences in the outcome probabilities between the two groups, at each inclusion score, along with the 95% confidence interval. Where the CI crosses 0, the difference between employees who experienced adverse life-events and those who didn’t, is not significant.
Results
Descriptive results
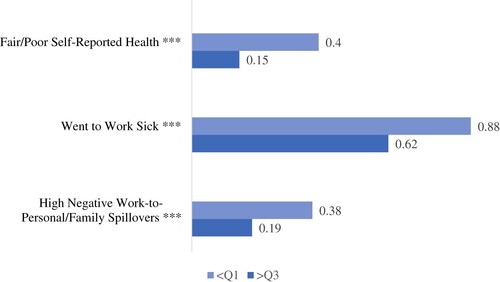
We first examine the proportion of employees reporting fair/poor health, presenteeism and negative work-to-personal/family spillover at low and high values of workplace inclusion. For ease of comparison, presents unadjusted proportions corresponding to scores below the 1st quartile (Q1) and above the 3rd quartile (Q3) of the inclusion distribution. We find a significantly lower proportion of employees reporting adverse health/well-being outcomes at the most inclusive workplaces – those represented above Q3 of inclusion scores – compared with the least inclusive workplaces – those represented below Q1 of inclusion scores.Footnote5 For example, 40% of employees below Q1 whereas 15% of employees above Q3 reported fair/poor health. Again, 38% of employees below Q1 but only 19% of employees above Q3 reported high negative work-to-personal/family spillovers. At 88%, an alarming share of employees below Q1, the least inclusive workplaces, went to work sick and even though the proportion is significantly lower among employees above Q3, the highly inclusive workplaces, the majority in those workplaces (62%) still reported presenteeism. Recall that prior findings on workplace relational practices suggest both a negative health effect as well as a positive motivation effect of higher inclusion, in the case of presenteeism.
Figure 1. Unadjusted proportions of employee health and well-being outcomes, by workplace inclusiveness. Source: SHRM National Study of the Changing Workforce 2016.
Note: <Q1 and >Q3 respectively denote the proportion of employees reporting the adverse outcome in workplaces with scores below the 1st quartile and in workplaces with scores above the third quartile of the distribution of overall inclusiveness scores. (N for <Q1 subsamples=352–369 and N for >Q3 subsamples=358–365). ***p < 0.001, **p < 0.01, *p < 0.05, +p < 0.10. Please see Appendix C for unadjusted proportions of employee outcomes, by each of the four workplace components of workplace inclusiveness.
Appendix 4 presents descriptive statistics for potential demographic, socio-economic and work-related confounders, separated again by high and low overall inclusion scores. We find perceived workplace inclusion to vary significantly by various measures of financial status, such as occupational status, earnings, and family financial security. For example, managers are over-represented in highly inclusive workplaces; 16% of employees overall are managers, the proportion is 10% in the least inclusive but 19% in the most inclusive workplaces. Again, family financial insecurity is more likely for employees in the least inclusive workplaces; whereas 58% of employees’ overall report having enough at the end of the month to make ends meet, this proportion ranges from 42% in the least inclusive workplaces to 73% in the most inclusive workplaces. Another notable difference relates to caregiving responsibilities. Employees who have eldercare responsibilities are significantly less likely to report high levels of inclusion. Thus, the above-mentioned patterns of health and well-being outcomes could very well represent differences in the composition of employees in more versus less inclusive workplaces, in terms of their economic or caregiving status. We take these differences into account in the adjusted results presented in the next sub-section.
Along with examining the overall association between inclusive practices and employee health/well-being, we are interested in assessing the extent to which such practices could be a resource for employees’ recovery in the wake of adverse life-events.
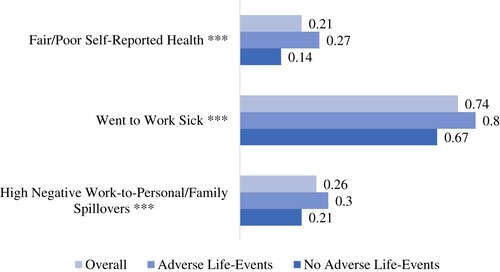
presents the average share of employees reporting each negative outcome and additionally, provides differences by whether or not they experienced an adverse life-event. For all outcomes, those who experienced one or more adverse life-events in the recent past, tend to fare significantly worse, as expected from a long line of prior research on adverse life-events. For instance, 27% of employees who experienced challenging life-events reported fair/poor self-rated health, compared with 14% of employees who did not experience any such event (p < 0.001). Again, 80% of employees who experienced challenging life-events went to work sick, compared with 67% of employees who did not experience any such events (p < 0.001). Thus, if inclusive relational practices have a significantly greater impact on the health/well-being of employees with recent adverse life-events, as we have hypothesized, we should see these outcome gaps close as inclusion increases. In the final part of the results section, we explore these possibilities.
Figure 2. Mean health outcomes and differences by adverse/challenging life-events. Source: SHRM National Study of the Changing Workforce 2016.
Note: Adverse life events refer to at least one of the following in the past 12 months –close relative or friend passed away, had a serious illness, started caregiving for someone with a serious illness/ health condition, was unemployed for part of the year, close coworkers were laid off, or spouse was laid off. N = 1413 (adverse life-event subsample = 762, no adverse life-event subsample = 651). ***p < 0.001, **p < 0.01, *p < 0.05, +p < 0.10.
Regression results
For reasons described in the methodology section earlier, we present results from regression analyses in two parts. First, we present the summary effects of inclusion on employee health and next, we plot predicted probabilities of each outcome over the range of inclusion scores. Note that while we use the term ‘effects,’ our results cannot be interpreted causally.
Hypothesis 1, Hypothesis 2 and Question 1: association between workplace inclusion and fair/poor health, presenteeism and negative work-to-personal/family spillover
presents odds ratios for each combination of outcome and inclusion indicator for the full sample of employees, adjusted for demographic, socio-economic and occupation-related controls. We find the same overall pattern for all outcomes: inclusion is associated with significantly lower odds of reporting fair/poor health, presenteeism, and negative work-to-personal/family spillovers. There are differences by indicator and outcome, reflecting the distinct purposes that each domain of inclusive practices is expected to serve. For instance, a one-point increase in the Whole Employee Approach score (which involves increasing support for employees’ non-work demands as well as increasing concern for their health needs), is associated with half the odds (or a 50% reduction in odds) of reporting fair/poor health and negative work-to-personal/family conflict but the same increase in the Participatory Decision Making or Culture of Respect and Trust scores are associated with a lesser effect, 35–43% reduction in odds of reporting the same adverse outcomes.Footnote6
Table 1. Odds ratios from logistic regressions of employee outcomes on inclusiveness.
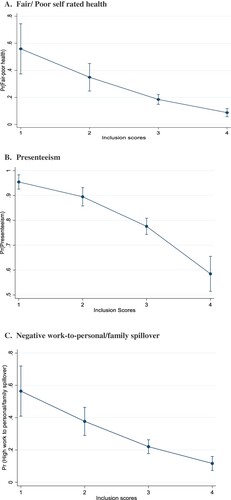
In , we plot the covariate-adjusted population share of employees reporting each health outcome at different values of the overall inclusion score. The general pattern is consistent across all outcomes and measures of inclusion; workplace relational practices that promote inclusion are negatively associated with the probability of fair/poor health, presenteeism, and negative work–to-personal/family spillovers. However, the presenteeism curve is concave whereas both fair/poor health and negative work-to-personal/family spillover are convex shaped, suggesting that presenteeism may be more responsive to increases in inclusion at the higher end (such as between scores 3 and 4) than at the lower end (such as between scores 1 and 2), whereas both general health and work-personal/family spillover show the opposite tendency. Footnote7
Figure 3. Adjusted proportions of employee health/well-being outcomes, by overall workplace inclusion scores. A. Fair/ Poor self-rated health. B. Presenteeism. C. Negative work-to-personal/family spillover. Source: National Study of the Changing Workforce 2016.
Note: Predicted probabilities from logistic regression of fair/poor self-rated health on inclusiveness score, adjusted for age, sex, race/ethnicity, education, partner, caregiver, occupation, fulltime, schedule, sector, earnings, industry, financial security and health condition. Regressions use survey sampling weights.
Hypotheses 3 (a), 3 (b) and 3 (c): group differences by adverse/serious life-events
In , we compare the difference in effect of inclusion on health/ well-being, by life-events. Each figure contains two panels. In the top panel, we present covariate-adjusted outcome probabilities at scores 1, 2, 3 and 4, separately for employees who experienced adverse life-events (solid line with square pattern) and employees who did not experience any adverse life-events (solid line with circle pattern). We then take the difference in the probability values represented by these two lines at each score, and plot that difference in the bottom panel (solid line with a triangle pattern). Dashed lines show the 95% confidence interval and where the dashed lines cross the zero line, the difference between the two groups is not significant.
Figure 4. Workplace inclusion and self-rated health – comparison of employees with and without adverse life-events. A. Probability of fair/poor health by life-events and workplace inclusion. B: Difference between employees with and without life-events in probability of fair/poor health (95% confidence interval), by workplace inclusion. Source: SHRM National Study of the Changing Workforce 2016.
Note: N = 1413 (adverse life-event = 762, no adverse life-event = 651). Predicted probabilities from logistic regression of fair/poor self-rated health on inclusiveness score, adjusted for age, sex, race/ethnicity, education, partner, caregiver, occupation, fulltime, schedule, sector, earnings, industry, financial security and health condition. Regressions use survey sampling weights. Dashed lines show 95% confidence intervals. Differences are not significant where dashed lines touch 0.
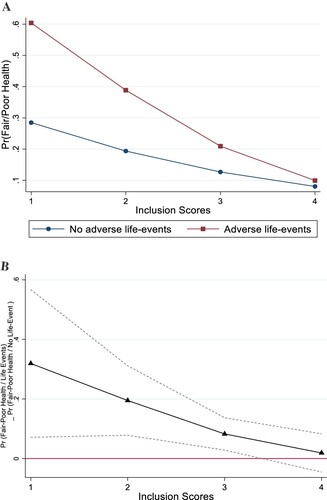
Figure 5. Workplace inclusion and going to work sick (presenteeism) – comparison of employees with and without adverse life-events. A. Probability of presenteeism by life-events and workplace inclusion. B. Difference between employees with and without life-events in probability of presenteeism (95% confidence interval), by workplace inclusion. Source: SHRM National Study of the Changing Workforce 2016.
Note: N = 1413 (adverse life-event = 762, no adverse life-event = 651). Predicted probabilities from logistic regression of presenteeism on inclusiveness score, adjusted for age, sex, race/ethnicity, education, partner, caregiver, occupation, fulltime, schedule, sector, earnings, industry, financial security and health condition. Regressions use survey sampling weights. Dashed lines show 95% confidence intervals. Differences are not significant where dashed lines touch 0.
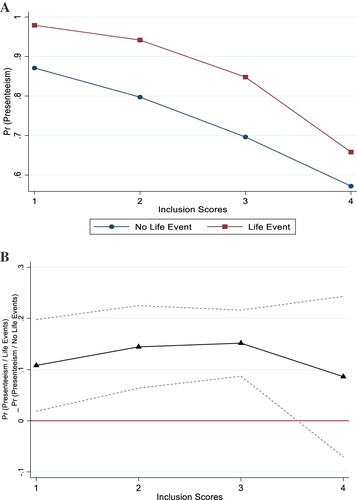
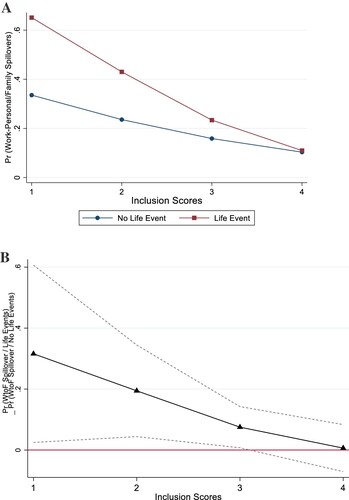
Figure 6. Workplace inclusion and work-to-personal/family spillover – comparison of employees with and without adverse life-events. A. Probability of work-to-personal/family spillover by life-events and workplace inclusion. B: Difference between employees with and without life-events in probability of work-to-personal family spillover (95% confidence interval), by workplace inclusion. Source: SHRM National Study of the Changing Workforce 2016.
Note: N = 1413 (adverse life-event = 762, no adverse life-event = 651). Predicted probabilities from logistic regression of high negative work-to-personal/family spillover on inclusiveness score, adjusted for age, sex, race/ethnicity, education, partner, caregiver, occupation, fulltime, schedule, sector, earnings, industry, financial security and health condition. Regressions use survey sampling weights. Dashed lines show 95% confidence intervals. Differences are not significant where dashed lines touch 0.
In , we present these two plots for fair/poor self-reported health. The top panel of thus shows that the probability of reporting fair/poor health reduces from 0.6 at score 1–0.4 at score 2–0.21 at score 3 and 0.09 at score 4, for the employees who experienced adverse life-events. For the same change in inclusion scores, the probability of fair/poor health reduces from 0.28 when inclusion score is 1, to is 0.19 at score 2, to 0.13 at score 3 and 0.08 at score 4, for the adverse life-event group. Thus, for both groups, the probability of fair/poor health reduces with increase in workplace inclusion. However, the reduction is significantly higher for the group with adverse life-events. When the differences in probabilities are plotted in the bottom panel, we can see that the absolute value of the difference reduces with increase in workplace inclusion from 0.319 at score 1 (p < 0.05), to 0.195 (p < 0.001) at score 2, to 0.083 at score 3 (p < 0.001), but at score 4, the difference reduces to a negligible 0.019, and this last difference is no longer statistically significant (p = 0.560), as evidenced by the dashed line crossing the zero line.
This same pattern is replicated in the case of negative work-to-personal/family spillovers in , where the probability difference between the two groups can be seen to reduce from 0.31 at score 1, to 0.194 at score 2, to 0.075 at score 3 (all differences significant at p < 0.05), and finally to a negligible and statistically insignificant 0.006 at score 4 (p = 0.871). For both these outcomes, the gap in probability of negative outcomes, between employees who experienced adversity and those who did not, reduces in absolute value as the inclusion score increases. The reduction in the health gap is driven primarily by the changes in probability for the group that experienced adversities. The probability plot for the no-adverse life-event group is noticeably flat. Thus, the group facing adversities appears to benefit significantly more from increases in workplace inclusiveness.
The case of presenteeism () is a little different. While both groups show a reduction in probability of presenteeism in response to increase in inclusion, the difference remains relatively stable. As depicted in the bottom panel, the difference in probability of presenteeism reduces in absolute value from 0.108 to 0.144 to 0.152 between scores 1 to 3 (all differences are still statistically significant at p < 0.05, p < 0.01 and p < 0.001 respectively). However, it becomes statistically non-significant at score 4, with the difference itself only slightly different at 0.09. Thus, even though there is no significant difference at the highest levels of inclusion, we are unable to say the difference reduced meaningfully with increases in inclusion.
Discussion
A significant number of employees are returning after the Covid-crisis in the wake of life-altering experiences such as the loss of loved ones, serious health challenges and economic upheavals. It is clear that the pandemic is affecting both employees and employers. Given these circumstances, could workplaces help in the recovery and ultimately, the renewal, of employee health and well-being? Employers depend on the health and well-being of their employees. These are the concerns that motivated our study.
Prior research has considered relational practices of leaders and peers as key work-based resources for employees in successfully managing work-nonwork demands and minimizing negative health consequences of such stressors (Arnold, Citation2017; Kelly et al., Citation2014; Kossek et al., Citation2011, Citation2018; Moen et al., Citation2016; Ryan & Kossek, Citation2008). We draw on this resource perspective in our analysis of inclusive relational practices in the workplace. As we hypothesized, workplace inclusion is positively associated with employee health/ well-being. Specifically, we found that increases in inclusivity lowered the odds of reporting fair/poor health, going to work sick and negative work-to-life spillovers. Our study replicates findings from prior studies on inclusive relational practices in a nationally representative sample (Graen & Uhl-Bien, Citation1995; Gregory & Osmonbekov, Citation2019; Hammer et al., Citation2009, Citation2013; Kelly et al., Citation2014; Kossek et al. Citation2011, Citation2018; Mor Barak & Levin, Citation2002; Nishii & Mayer, Citation2009; Rousseau et al., Citation2008).
We apply the resource perspective to inclusive relational practices in the context of employees’ recovery from adverse life-events. Such events necessitate work/ non-work role adjustments and threaten personal resources, in turn motivating employees to conserve their remaining resources. Employees facing adverse life-events are therefore, more likely to benefit from IRPs. Our findings confirm this expectation of ‘gain paradox’ posited by the conservation of resources theory, which we think is the notable contribution of this study (Hobfoll & Shirom, Citation1993; Hobfoll et al., Citation2018). We find that while inclusive practices are beneficial in general, they are significantly more beneficial for employees who are recovering from adverse life-events. Specifically, increases in inclusion reduced the gap in probabilities of reporting fair/poor health and negative work-to-life spillovers, between employees who experienced adverse life-events and employees who did not.
Results for presenteeism are not conclusive. While for the full sample and for each subgroup, inclusion is associated with reduced probability of presenteeism, the proportions themselves remain high throughout and group differences by adversity, remained more or less stable. The worst-off group, employees who experienced adversities and are working in the least inclusive workplaces, report an almost certain likelihood of working sick (a 0.98 probability). Arguably the best-placed group, those without adverse life-events at the highest scores of inclusivity, have a probability of 0.66 for going to work sick. While the mechanisms may indicate a positive experience –increased motivation or engagement stemming from exposure to an inclusive, transformative leader – as posited in prior studies, the end results are still a cause for concern. These results are consistent with prior findings that suggest the presence of both a negative as well as a positive effect of different inclusive practices. Additionally, it is possible that presenteeism captures less of individual employee behavior and is more indicative of the culture and pressures that employees face.
Our finding that inclusive practices are most likely to impact high-need employees, mirrors prior evidence that the health and well-being benefits of work-life supportive relational practices are concentrated mostly among employees with higher work-life conflict (Hammer et al., Citation2009, Citation2011; Kelly et al., Citation2014). An important distinction between prior work-life studies and ours is in the implications of these findings. Based on the differential impacts of inclusive leadership practices on work-family outcomes, scholars have advocated for a targeted intervention strategy focused on high-need employees (Hammer et al., Citation2011). While we recognize that high-need employees are often the same ones with less access to workplace support, we believe that an important distinction here is between the variation in effects and variation in actions. High quality of leader-member exchanges coupled with low differentiation of exchanges among members, is essential for fostering workplace inclusion (Nishii & Mayer, Citation2009; Shore et al., Citation2018). We therefore argue that inclusive practices should not be targeted at potentially high-need employees. Instead, a universally applied set of IRPs may allow higher-need employees to gain more without the threat of exclusion or backlash.
Our study has several limitations. First, while we attempted to capture it through multiple constructs, our approach is by no means a comprehensive account of workplace inclusion. There are some dimensions of inclusion that our measures and data fail to capture. We hope future studies will pay attention to and include employees’ perceptions regarding recognizing, honoring, and advancing of diversity (Shore et al., Citation2018) in their workplaces.
Second, we dichotomized adverse life-events into whether or not an individual experienced at least one such event, and therefore, we may have lost information related to the cumulative effect of multiple stressors. This may not be a major problem since many employees, about 30%, reported experiencing any one of the challenges, another 12% reported experiencing two challenges, and the remaining 7% reported three or more. However, dichotomization may have masked key demographic and socio-economic patterns or the distinct effect of stressors related to health versus those related to economic security. For instance, while we found no race differences in experiencing at least one life-event, a closer examination of the number of challenges revealed significant differences in their distribution by race (p < 0.05). we found that white (non-Hispanic) employees were more likely to report a single event (34% versus 26%), whereas non-white employees were more likely to report multiple events (30% versus 18%). Similarly, we found no differences by age-group overall, but looking by type of challenge, significant differences emerged (p < 0.01). Older employees were more likely to report health-related challenges (56% of employees aged 60–85 years versus 40% of employees aged below 60 years). Unfortunately, small cell sizes made detailed analyses of such patterns unfeasible in our study and we hope future research will pursue these questions.
Third, our study is limited by the workplace culture particular to the U.S. context and its findings may not be generalizable to other countries and contexts. Workplace interactions, expectations and norms related to various actions and behaviors are key to the experience and perception of inclusive relational practices and these things are likely to vary from country to country and even within countries. Cross-national or sub-national comparative studies on the role of workplace practices in employees’ recovery under different institutional contexts, may be particularly insightful.
Fourth, with cross-sectional data, we are unable to draw any causal interpretations of our findings. Additionally, even though the data allows controlling for a wide variety of potential confounders, unmeasured confounding may still be present.
Despite these limitations, our study makes important contributions to the work-life and diversity-inclusion scholarships by examining relational aspects of the workplace that have received inadequate attention in nationally representative data, increasing the generalizability of prior evidence on the health/well-being consequences of family-supportive practices of supervisors, and providing new evidence on the consequences of a broad set of inclusive practices of coworkers, supervisors and organizational leaders.
Our findings have important practice implications in the current context as workplaces strive to figure out post-Covid recovery plans. We advocate for a strategy for rebuilding workplaces that puts relational practices of leaders and coworkers front and center. The widespread nature of pandemic-related life-events made us pay attention to employees in crisis, but as our pre-pandemic data makes clear, such crises are experienced by almost half of employees during ordinary years, requiring stressful readjustments and negatively affecting health, productivity and work-life fit. Inclusive relational practices could act as a critical resource for mitigating health and well-being consequences of adverse life-events, during the recovery from Covid and in a post-Covid world. As we re-imagine the world of work after a public health crisis, these health and well-being implications provide a valuable and timely argument for creating more inclusive workplaces that can benefit employees and employers alike.
Acknowledgements
We are grateful to James ‘Terry’ Bond for his significant contributions in the preparation and analyses of the 2016 National Study of the Changing Workforce (NSCW) survey. Additionally, Pal acknowledges support from the Families and Work Institute and the Society for Human Resource Management for access to and use of the 2016 NSCW. Our study has benefited greatly from the comments and feedback of four anonymous reviewers and the guest editors of this special edition, as well as from the comments of participants at the 2018 Work and Family Researchers Network conference.
Disclosure statement
No potential conflict of interest was reported by the author(s).
Additional information
Notes on contributors
Ipshita Pal
Ipshita Pal is an Assistant Professor of Health and Human Services at St. John’s University, New York. Her research interests center around the world of work, focusing on how public and organizational policies shape health and well-being. Her research has been supported by the Families and Work Institute and the Society for Human Resource Management. She earned her doctorate in Social Work and Social Policy at Columbia University and worked as Postdoctoral Research Scientist at the Columbia Population Research Center. Pal is a 2020–2021 Early Career Fellow of the Work and Family Researchers Network.
Ellen Galinsky
Ellen Galinsky is the president and co-founder of Families and Work Institute. In addition, she serves as Chief Science Officer at the Bezos Family Foundation. She’s conducted research on child-care, parent-professional relationship, parental development, work-family issues and youth voice. She is currently at work on a book about adolescence called The Breakthrough Years. Ellen is the author of the best-selling Mind in the Making, more than 100 books/reports and 300 articles. Other highlights include being the elected President of the National Association for the Education of Young Children (NAEYC); and being elected to the National Academy of Human Resources. In 2018, the Work and Family Researchers Network established the ongoing Ellen Galinsky Generative Researcher Award.
Stacy Kim
Stacy Kim is the founder of Life Junctions LLC and a Professional Certified Coach (PCC) helping talented and caring women find time and energy for meaningful work and the people they love. She is the author of The Lighthouse Method: How Busy Overloaded Moms Can Get Unstuck and Figure Out What To Do With Their Lives. Through her coaching, writing, and speaking, she translates research into practical strategies in a style that is intellectually stimulating yet fun. Dr. Kim has over 15 years’ experience in work-family research. She earned her doctorate in educational policy and leadership at the University of Pennsylvania and has worked for such institutions as Columbia University and the Families and Work Institute.
Notes
1 See for example:
https://www.theguardian.com/society/2021/sep/03/stress-test-burnout-breaks-staff-recover-pandemic
https://www.nytimes.com/2021/09/03/business/economy/covid-urban-service-economy.html
https://www.washingtonpost.com/business/2021/08/17/work-from-home-permanently/
2 For the full list of variables, please see Appendix 1.
3 Appendix 2 presents the share of employees who reported life events by number and type of event.
4 Items measuring Work to Personal/ Family Spillovers
How often has work kept you from doing as good a job at home as you could?
How often have you NOT had the energy to do things with your family or other important people in your life because of your job?
How often has your job kept you from concentrating on important things in your family or personal life?
How often have you NOT had enough time for your family or other important people in your life because of your job?
All questions were asked with reference to the past three months and response categories were very often, often, sometimes, rarely and never.
5 Please see Appendix 3 for unadjusted proportions of employee outcomes, by each of the four components of overall workplace inclusion. The patterns are same across all indicator and outcome combinations.
6 Appendix 5 presents additional models with expanded sets of occupational controls –job demands, job control and autonomy. These expanded models show slightly lowered odds (higher odds ratios) associated with increases in inclusion, but the overall pattern remains consistent.
7 Probability plots for each component reveals very similar patterns. Separate graphs for each indicator and outcome combination are therefore not presented here, but available upon request.
References
- Allen, T. D. (2001). Family-supportive work environments: The role of organizational perceptions. Journal of Vocational Behavior, 58, 414–435.
- Arnold, K. A. (2017). Transformational leadership and employee psychological well-being: A review and directions for future research. Journal of Occupational Health Psychology, 22(3), 381–393. https://doi.org/10.1037/ocp0000062
- Asfaw, A. G., Chang, C. C., & Ray, T. K. (2014). Workplace mistreatment and sickness absenteeism from work: Results from the 2010 National Health Interview survey. American Journal of Industrial Medicine, 57(2), 202–213. https://doi.org/10.1002/ajim.22273
- Bakker, A. B., & Demerouti, E. (2007). The job demands-resources model: State of the art. Journal of Managerial Psychology, 22(3), 309–328. https://doi.org/10.1108/02683940710733115
- Bakker, A. B., Demerouti, E., & Euwema, M. C. (2005). Job resources buffer the impact of job demands on burnout. Journal of Occupational Health Psychology, 10, 170–180. https://doi.org/10.1037/1076-8998.10.2.170
- Bakker, A. B., Demerouti, E., & Sanz-Vergel, A. A. (2014). Burnout and work engagement: The JD-R approach. Annual Review of Organizational Psychology and Organizational Behavior, 1, 389–411.
- Bavik, Y. L., Shaw, J. D., & Wang, X.-H. (2020). Social support: Multidisciplinary review, synthesis, and future agenda. Academy of Management Annals, 14(2), 726–758. https://doi.org/10.5465/annals.2016.0148
- Behson, S. J. (2002). Which dominates? The relative importance of work–family organizational support and general organizational context on employee outcomes. Journal of Vocational Behavior, 61(1), 53–72.
- Behson, S. J. (2005). The relative contribution of formal and informal organizational work-family support. Journal of Vocational Behavior, 66(3), 487–500. https://doi.org/10.1016/j.jvb.2004.02.004
- Blair-Loy, M., & Wharton, A. S. (2002). Employees’ use of work-family policies and the workplace social context. Social Forces, 80(3), 813–845. https://doi.org/10.1353/sof.2002.0002
- Bond, J. T., Galinsky, E., & Swanberg, J. E. (1998). The national study of the changing workforce. The Families and Work Institute.
- Brimhall, K. C., Mor Barak, M. E., Hurlburt, M., McArdle, J. J., Palinkas, L., & Henwood, B. (2017). Increasing workplace inclusion: The promise of leader-member exchange. Human Service Organizations: Management, Leadership & Governance, 41(3), 222–239. https://doi.org/10.1080/23303131.2016.1251522
- Cohen, S. (2004). Social relationships and health. American Psychologist, 59(8), 676–684. https://doi.org/10.1037/0003-066X.59.8.676
- Cohen, S., Line, S., Manuck, S. B., Rabin, B. S., Heise, E. R., & Kaplan, J. R. (1997). Chronic social stress, social status, and susceptibility to upper respiratory infections in nonhuman primates. Psychosomatic Medicine, 59(3), 213–221. https://doi.org/10.1097/00006842-199705000-00001
- Cohen, S., Murphy, M. L., & Prather, A. A. (2019). Ten surprising facts about stressful life events and disease risk. Annual Review of Psychology, 70, 577–597. https://doi.org/10.1146/annurev-psych-010418-102857
- Cohen, S., & Wills, T. A. (1985). Stress, social support, and the buffering hypothesis. Psychological Bulletin, 98(2), 310–357. https://doi.org/10.1037/0033-2909.98.2.310
- Ducharme, L. J., Knudsen, H. K., & Roman, P. M. (2007). Emotional exhaustion and turnover intentions in human service occupations: The protective role of coworker support. Sociological Spectrum, 28(1), 81–104. https://doi.org/10.1080/02732170701675268
- Dulebohn, J. H., Boomer, W. H., Liden, R. C., Brouer, R., & Ferris, G. R. (2012). A meta-analysis of the antecedents and consequences of leader-member exchange: Integrating the past with an eye toward the future. Journal of Management, 38(6), 1715–1759. https://doi.org/10.1177/0149206311415280
- Faragher, E. B., Cass, M., & Cooper, C. L. (2005). The relationship between job satisfaction and health: A meta-analysis. Occupational and Environmental Medicine, 62(2), 105–112. https://doi.org/10.1136/oem.2002.006734
- Faragher, E. B., Cass, M., & Cooper, C. L. (2013). The relationship between job satisfaction and health: A meta-analysis. From Stress to Wellbeing, 1, 254–271. https://doi.org/10.1057/9781137310651_12
- Fischer, J. A., & Sousa-Poza, A. (2009). Does job satisfaction improve the health of workers? New evidence using panel data and objective measures of health. Health Economics, 18(1), 71–89.
- Ganster, D. C., & Rosen, C. C. (2013). Work stress and employee health: A multidisciplinary review. Journal of Management, 39(5), 1085–1122. https://doi.org/10.1177/0149206313475815
- Graen, G. B., & Uhl-Bien, M. (1995). Relationship-based approach to leadership: Development of leader-member exchange (LMX) theory of leadership over 25 years: Applying a multi-level multi-domain perspective. The Leadership Quarterly, 6(2), 219–247. https://doi.org/10.1016/1048-9843(95)90036-5
- Greenhaus, J. H., Ziegert, J. C., & Allen, T. D. (2012). When family-supportive supervision matters: Relations between multiple sources of support and work–family balance. Journal of Vocational Behavior, 80(2), 266–275. https://doi.org/10.1016/j.jvb.2011.10.008
- Gregory, B., & Osmonbekov, T. (2019). Leader–member exchange and employee health: An exploration of explanatory mechanisms. Leadership & Organization Development Journal, 40(6), 699–711. https://doi.org/10.1108/LODJ-11-2018-0392
- Halbesleben, J. R., & Wheeler, A. R. (2015). To invest or not? The role of coworker support and trust in daily reciprocal gain spirals of helping behavior. Journal of Management, 41(6), 1628–1650. https://doi.org/10.1177/0149206312455246
- Hammer, E., Kossek, E., Yragui, N., Bodner, T., & Hansen, G. (2009). Development and validation of a multidimensional scale of family supportive supervisor behaviors (FSSB). Journal of Management, 35(4), 837–856. https://doi.org/10.1177/0149206308328510
- Hammer, L. B., Ernst Kossek, E., Bodner, T., & Crain, T. (2013). Measurement development and validation of the family supportive supervisor behavior short-form (FSSB-SF). Journal of Occupational Health Psychology, 18(3). https://doi.org/10.1037/a0032612
- Hammer, L. B., Kossek, E. E., Anger, W. K., Bodner, T., & Zimmerman, K. L. (2011). Clarifying work–family intervention processes: The roles of work–family conflict and family-supportive supervisor behaviors. Journal of Applied Psychology, 96(1), 134–150. https://doi.org/10.1037/a0020927
- Hammer, L. B., Kossek, E. E., Zimmerman, K., & Daniels, R. (2007). Clarifying the construct of family-supportive supervisory behaviors (FSSB): A multilevel perspective. In P. L. Perrewé & D. C. Ganster (Eds.), Research in occupational stress and well-being: Vol. 6. Exploring the work and non-work interface (pp. 165–204). Elsevier Science/JAI Press.
- Hobfoll, S. E., Halbesleben, J., Neveu, J.-P., & Westman, M. (2018). Conservation of resources in the organizational context: The reality of resources and their consequences. Annual Review of Organizational Psychology and Organizational Behavior, 5(1), 103–128. https://doi.org/10.1146/annurev-orgpsych-032117-104640
- Hobfoll, S. E., & Shirom, A. (1993). Stress and burnout in the workplace: Conservation of resources. In T. Golombiewski (Ed.), Handbook of organizational behavior (pp. 41–61). Marcel Dekker.
- House, J. S., Landis, K. R., & Umberson, D. (1988). Social relationships and health. Science, 241(4865), 540–545.
- Idler, E. L., & Benyamini, Y. (1997). Self-rated health and mortality: A review of twenty-seven community studies. Journal of Health and Social Behavior, 21–37.
- Inceoglu, I., Thomas, G., Chu, C., Plans, D., & Gerbasi, A. (2018). Leadership behavior and employee well-being: An integrated review and a future research agenda. The Leadership Quarterly, 29(1), 179–202. https://doi.org/10.1016/j.leaqua.2017.12.006
- Jylhä, M. (2009). What is self-rated health and why does it predict mortality? Towards a unified conceptual model. Social Science and Medicine, 69, 307–316.
- Karasek, R. A., Jr. (1979). Job demands, job decision latitude, and mental strain: Implications for job redesign. Administrative Science Quarterly, 24, 285–308. https://doi.org/10.2307/2392498
- Katz, A. S., Pronk, N. P., McLellan, D., Dennerlein, J., & Katz, J. N. (2019). Perceived workplace health and safety climates: Associations with worker outcomes and productivity. American Journal of Preventive Medicine, 57(4), 487–494. https://doi.org/10.1016/j.amepre.2019.05.013
- Kaur, H., Luckhaupt, S. E., Li, J., Alterman, T., & Calvert, G. M. (2014). Workplace psychosocial factors associated with hypertension in the US workforce: A cross-sectional study based on the 2010 National Health Interview Survey. American Journal of Industrial Medicine, 57(9), 1011–1021. https://doi.org/10.1002/ajim.22345
- Kelly, E. L., Moen, P., Oakes, J. M., Fan, W., Okechukwu, C., Davis, K. D., Hammer, L. B., Kossek, E. E., King, R. B., Hanson, G. C., Mierzwa, F., & Casper, L. M. (2014). Changing work and work-family conflict: Evidence from the work, family, and health network. American Sociological Review, 79(3), 485–516. https://doi.org/10.1177/0003122414531435
- Kessler, R. C. (1997). The effects of stressful life events on depression. Annual Review of Psychology, 48(1), 191–214. https://doi.org/10.1146/annurev.psych.48.1.191
- Kim, S., Galinsky, E., & Pal, I. (2020). One kind word -flexibility in the time of Covid. New York: Families and Work Institute.
- Kossek, E. E., Petty, R. J., Bodner, T. E., Perrigino, M. B., Hammer, L. B., Yragui, N. L., & Michel, J. S. (2018). Lasting impression: Transformational leadership and family supportive supervision as resources for well-being and performance. Occupational Health Science, 2(1), 1–24. https://doi.org/10.1007/s41542-018-0012-x
- Kossek, E. E., Pichler, S., Bodner, T., & Hammer, L. B. (2011). Workplace social support and work-family conflict: A meta-analysis clarifying the influence of general and work-family-specific supervisor and organizational support. Personnel Psychology, 64(2), 289–313. https://doi.org/10.1111/j.1744-6570.2011.01211.x
- Kwon, Y., & Marzec, M. L. (2019). Unpacking the associations between perceived cultural support and employee health: The approach of social capital. Journal of Occupational and Environmental Medicine, 61(11), 910–915. https://doi.org/10.1097/JOM.0000000000001698
- Leroy, H., Buengeler, C., Veestraeten, M., Shemla, M., Hoever, J. (2021). Fostering team creativity through team-focused inclusion: The role of leader harvesting the benefits of diversity and cultivating value-in-diversity beliefs. Group and Organization Management. https://doi.org/10.1177/10596011211009683
- Long, J. S., & Mustillo, S. A. (2018). Using predictions and marginal effects to compare groups in regression models for binary outcomes. Sociological Methods & Research, 50(3). https://doi.org/10.1177/0049124118799374
- Luckhaupt, S. E., Alterman, T., Li, J., & Calvert, G. M. (2017). Job characteristics associated with self-rated fair or poor health among US workers. American Journal of Preventive Medicine, 53(2), 216–224. https://doi.org/10.1016/j.amepre.2017.03.023
- Macey, W. H., & Schneider, B. (2008). The meaning of employee engagement. Industrial and Organizational Psychology: Perspectives on Science and Practice, 1, 3–30.
- MacGregor, J. N., Cunningham, J. B., & Caverley, N. (2008). Factors in absenteeism and presenteeism: Life events and health events. Management Research News, 31(8), 607–615. https://doi.org/10.1108/01409170810892163
- Miller, F. A. (1998). Strategic culture change: The door to achieving high performance and inclusion. Public Personnel Management, 27, 151–160. https://doi.org/10.1177/009102609802700203
- Minnotte, K. L., & Varud, T. (2020). Job insecurity and coworker support among U.S. Workers. Sociological Spectrum, 40(5), 314–328. https://doi.org/10.1080/02732173.2020.1797601
- Miraglia, M., & Johns, G. (2016). Going to work ill: A meta-analysis of the correlates of presenteeism and a dual-path model. Journal of Occupational Health Psychology, 21(3), 261. https://doi.org/10.1037/ocp0000015
- Moen, P., Kelly, E. L., Fan, W., Lee, S.-R., Almeida, D., Kossek, E. E., & Buxton, O. M. (2016). Does a flexibility/support organizational initiative improve high-tech employees’ well-being? Evidence from the work, family, and health network. American Sociological Review, 81(1), 134–164. https://doi.org/10.1177/0003122415622391
- Mor-Barak, M. E. (2000). Beyond affirmative action: Toward a model of diversity and organizational inclusion. Administration in Social Work, 23, 47–68. https://doi.org/10.1300/J147v23n03_04
- Mor-Barak, M. E., & Cherin, D. A. (1998). A tool to expand organizational understanding of workforce diversity: Exploring a measure of inclusion-exclusion. Administration in Social Work, 22(1), 47–64. https://doi.org/10.1300/J147v22n01_04
- Mor Barak, M. E., & Levin, A. (2002). Outside of the corporate mainstream and excluded from the work community: A study of diversity, job satisfaction and well-being. Community, Work & Family, 5(2), 133–157. https://doi.org/10.1080/13668800220146346
- Mor Barak, M. E., Luria, G., & Brimhall, K. C. (2021). What leaders say versus what they do: Inclusive leadership, policy-practice decoupling, and the anomaly of climate for inclusion. Group & Organization Management. https://doi.org/10.1177/10596011211005916
- Munir, F., Leka, S., & Griffiths, A. (2005). Dealing with self-management of chronic illness at work: Predictors for self-disclosure. Social Science and Medicine, 60, 1397–1407.
- Nelson, J. L., Hayward, K. A., Haardörfer, R., & Hayward, J. L. (2019). Trust and respect at work: Justice antecedents and the role of coworker dynamics. Work and Occupations, 46(3), 307–338. https://doi.org/10.1177/0730888419835261
- Nembhard, I. M., & Edmondson, A. C. (2006). Making it safe: The effects of leader inclusiveness and professional status on psychological safety and improvement efforts in health care teams. Journal of Organizational Behavior: The International Journal of Industrial, Occupational and Organizational Psychology and Behavior, 27(7), 941–966. https://doi.org/10.1002/job.413
- Nielsen, K., & Daniels, K. (2016). The relationship between transformational leadership and follower sickness absence: The role of presenteeism. Work & Stress, 30(2), 193–208. https://doi.org/10.1080/02678373.2016.1170736
- Nielsen, K., Randall, R., Yarker, J., & Brenner, S.-O. (2008). The effects of transformational leadership on followers’ perceived work characteristics and psychological well-being: A longitudinal study. Work & Stress, 22(1), 16–32. https://doi.org/10.1080/02678370801979430
- Nishii, L. H., & Mayer, D. M. (2009). Do inclusive leaders help to reduce turnover in diverse groups? The moderating role of leader–member exchange in the diversity to turnover relationship. Journal of Applied Psychology, 94(6), 1412–1426. https://doi.org/10.1037/a0017190
- Nunnally, J., & Bernstein, L. (1994). Psychometric theory. McGraw-Hill Higher, Inc.
- Panchal, N., Kamal, R., Orgera, K., Cox, C., Garfield, R., Hamel, L., & Chidambaram, P. (2020). The implications of COVID-19 for mental health and substance use. Kaiser Family Foundation.
- Peckham, T., Fujishiro, K., Hajat, A., Flaherty, B. P., & Seixas, N. (2019). Evaluating employment quality as a determinant of health in a changing labor market. RSF: The Russell Sage Foundation. Journal of the Social Sciences, 5(4), 258–281. https://doi.org/10.7758/RSF.2019.5.4.09
- Pelled, L. H., Eisenhardt, K. M., & Xin, K. R. (1999). Exploring the black box: An analysis of work group diversity, conflict and performance. Administrative Science Quarterly, 44(1), 1–28. https://doi.org/10.2307/2667029
- Pries, L.-K., van Os, J., ten Have, M. T., de Graaf, R., van Dorsselaer, S., Bak, M., Lin, B. D., van Eijk, K. R., Kenis, G., Richards, A., O’Donovan, M. C., Luykx, J. J., Rutten, B. P. F., & Guloksuz, S. (2020). Association of recent stressful life events with mental and physical health in the context of genomic and exposomic liability for schizophrenia. JAMA Psychiatry, 77(12), 1296–1304. https://doi.org/10.1001/jamapsychiatry.2020.2304
- Randel, A. E., Galvin, B. M., Shore, L. M., Ehrhart, K. H., Chung, B. G., Dean, M. A., & Kedharnath, U. (2018). Inclusive leadership: Realizing positive outcomes through belongingness and being valued for uniqueness. Human Resource Management Review, 28(2), 190–203. https://doi.org/10.1016/j.hrmr.2017.07.002
- Roberson, Q., & Perry, J. L. (2021). Inclusive leadership in thought and action: A thematic analysis. Group and Organization Management.
- Roberson, Q. M. (2006). Disentangling the meanings of diversity and inclusion in organizations. Group & Organization Management, 31(2), 212–236. https://doi.org/10.1177/1059601104273064
- Roberson, Q. M. (2019). Diversity in the workplace: A review, synthesis, and future research agenda. Annual Review of Organizational Psychology and Organizational Behavior, 6(1), 69–88. https://doi.org/10.1146/annurev-orgpsych-012218-015243
- Roehling, P. V., Roehling, M. V., & Moen, P. (2001). The relationship between work-life policies and practices and employee loyalty: A life course perspective. Journal of Family and Economic Issues, 22(2), 141–170. https://doi.org/10.1023/A:1016630229628
- Rousseau, V., Aubé, C., Chiocchio, F., Boudrias, J., & Morin, E. M. (2008). Social interactions at work and psychological health: The role of leader–member exchange and work group integration. Journal of Applied Social Psychology, 38(7), 1755–1777. https://doi.org/10.1111/j.1559-1816.2008.00368.x
- Ryan, A. M., & Kossek, E. E. (2008). Work-life policy implementation: Breaking down or creating barriers to inclusiveness? Human Resource Management: Published in Cooperation with the School of Business Administration, The University of Michigan and in Alliance with the Society of Human Resources Management, 47(2), 295–310. https://doi.org/10.1002/hrm.20213
- Schaufeli, W. B., & Taris, T. W. (2014). A critical review of the job demands-resources model: Implications for improving work and health. Bridging Occupational, Organizational and Public Health, 43–68. https://doi.org/10.1007/978-94-007-5640-3_4
- Schreiber, J. B., Nora, A., Stage, F. K., Barlow, E. A., & King, J. (2006). Reporting structural equation modeling and confirmatory factor analysis results: A review. The Journal of Educational Research, 99(6), 323–338. https://doi.org/10.3200/JOER.99.6.323-338
- Shor, E., Roelfs, D. J., Curreli, M., Clemow, L., Burg, M. M., & Schwartz, J. E. (2012). Widowhood and mortality: A meta-analysis and meta-regression. Demography, 49(2), 575–606. https://doi.org/10.1007/s13524-012-0096-x
- Shore, L., Cleveland, J., & Sanchez, D. (2018). Inclusive workplaces: A review and model. Human Resource Management Review, 28(2), 176–189. p. 177. https://doi.org/10.1016/j.hrmr.2017.07.003
- Shore, L. M., Randel, A. E., Chung, B. G., Dean, M. A., Ehrhart, K. H., & Singh, G. (2011). Inclusion and diversity in work groups: A review and model for future research. Journal of Management, 37(4), 1262–1289. https://doi.org/10.1177/0149206310385943
- Sloan, M. M. (2012). Unfair treatment in the workplace and worker well-being: The role of coworker support in a service work environment. Work and Occupations, 39(1), 3–34. https://doi.org/10.1177/0730888411406555
- Thoits, P. A. (2011). Mechanisms linking social ties and support to physical and mental health. Journal of Health and Social Behavior, 52(2), 145–161. https://doi.org/10.1177/0022146510395592
- Thomas, L. T., & Ganster, D. C. (1995). Impact of family-supportive work variables on work-family conflict and strain: A control perspective. Journal of Applied Psychology, 80(1), 6–15. https://doi.org/10.1037/0021-9010.80.1.6
- Thompson, C. A., Beauvais, L. L., & Lyness, K. S. (1999). When work-family benefits are not enough: The influence of work-family culture on benefit utilization, organizational attachment, and work-family conflict. Journal of Vocational Behavior, 54(3), 392–415. https://doi.org/10.1006/jvbe.1998.1681
- Uchino, B. N., Bowen, K., Carlisle, M., & Birmingham, W. (2012). Psychological pathways linking social support to health outcomes: A visit with the “ghosts” of research past, present, and future. Social Science & Medicine, 74(7), 949–957. https://doi.org/10.1016/j.socscimed.2011.11.023
- U.S. Department of Health and Human Services. (2021, July 8). Centers for Disease Control and Prevention. “CDC Covid Data Tracker”. https://covid.cdc.gov/covid-data-tracker/#trends_dailytrendscases.
- U. S. Department of Labor. (2021, January 8). Bureau of Labor Statistics “Employment Situation Summary”. https://www.bls.gov/news.release/empsit.nr0.htm.
- Verdery, A. M., Smith-Greenaway, E., Margolis, R., & Daw, J. (2020). Tracking the reach of COVID-19 kin loss with a bereavement multiplier applied to the United States. Proceedings of the National Academy of Sciences, 117(30), 17695–17701. https://doi.org/10.1073/pnas.2007476117
- Zacher, H., Jimmieson, N. L., & Bordia, P. (2014). Time pressure and coworker support mediate the curvilinear relationship between age and occupational well-being. Journal of Occupational Health Psychology, 19(4), 462–475. https://doi.org/10.1037/a0036995
Appendices
Appendix 1. Indicators of workplace inclusion
Appendix 2. Share of employees by number and type of adverse/ challenging life-event
Panel A. Number of adverse/ challenging life-events
Panel B. Type of adverse/ challenging life-events
Source: SHRM National Study of the Changing Workforce 2016 (N = 1413).
Appendix 3. Unadjusted proportions of health outcomes, by inclusion components
Source: SHRM National Study of the Changing Workforce 2016.
Note: <Q1 and >Q3 respectively refer to scores below the 1st quartile and scores above the third quartile in the distribution of overall inclusiveness scores.
***p < 0.001, **p < 0.01, *p < 0.05, +p < 0.10.