
 ?Mathematical formulae have been encoded as MathML and are displayed in this HTML version using MathJax in order to improve their display. Uncheck the box to turn MathJax off. This feature requires Javascript. Click on a formula to zoom.
Abstract
Cyber-attacks pose a growing threat to global commerce that is increasingly reliant on digital technology to conduct business. Traditional risk assessment and underwriting practices face serious shortcomings when encountered with cyber threats. Conventional assessment frameworks rate risk based on historical frequency and severity of losses incurred, this method is effective for known risks; however, due to the absence of historical data, prove ineffective for assessing cyber risk. This paper proposes a conceptual cyber risk classification and assessment framework, designed to demonstrate the significance of proactive and reactive barriers in reducing companies’ exposure to cyber risk and quantify the risk. This method combines a bow-tie model with a risk matrix to produce a rating based on the likelihood of a cyber-threat occurring and the potential severity of the resulting consequences. The model can accommodate both historical data and expert opinion and previously known frameworks to score the Threats, Barriers and Escalators for the framework. The resultant framework is applied to a large city hospital in Europe. The results highlighted both cyber weaknesses and actions that should be taken to bolster cyber defences. The results provide a quick visual guide that is assessable to both experts and management. It also provides a practical framework that allows insurers to assess risks, visualise areas of concern and record the effectiveness of implementing control barriers.
1. Introduction
Rapid digitisation is radically transforming the way business is conducted worldwide. Along with increased productivity and opportunity comes emerging technological dangers such as cyber-attacks. Conventional assessment frameworks rate risk based on historical frequency and severity of losses incurred, this method is effective for known risks but, due to the absence of historical data, prove ineffective for assessing cyber risk. Cyber risk requires innovative assessment methods to provide more accurate management tools and risk transfer pricing. In this paper, we propose a cyber risk classification framework using a combination of a bow-tie and risk matrix approaches and call it QBowtie. We detail the framework and then apply it to a target institution. The resultant analysis allows insurers to easily visualise, classify and quantify the cyber risk of companies and will help guide the creation of insurance products and underwriting decisions. Likewise, it can be used by companies to prioritise risk mitigation strategies and to help promote investment in more secure IT infrastructures and controls within their organisations.
Cyber risk can be defined as the financial loss or reputational damage resulting from a failure in an organisation’s IT systems (The Institute of Cyber Risk Management Citation2014). Cyber-crime has cost the global economy around $600 billion in Citation2017 (McAfee Citation2018). A data breach costs a company on average $3.92MM per breach, according to IBM security report in 2020 (Ponemon Institute Citation2020). Cyber risks are dynamic due to continuous digital innovations, the increased use of internet-enabled devices and the ongoing sophistication of hackers. Business-interruption costs and the reputational damage following an attack can be detrimental to a company’s business. Financial services companies are particularly vulnerable and are key targets for cybercriminals. Vulnerability to cyber-attacks increases exponentially as companies become more reliant on electronic data, the use of cloud computing, social media, mobile devices, third-party software and outsourcing. The fast pace of technological developments, the potential for correlated risk exposures and the lack of historical claims data makes it difficult for insurers to quantify future losses (Bahşi, Franke, and Friberg Citation2019).
Published empirical data on cyber risk is limited; however, an annual report by Ponemon gives a well-documented account of data breaches (Ponemon Institute Citation2020). The report (ibid) says most expensive data breaches occurred in United States with average total cost of a data breach for $8.19MM and the most expensive industry was healthcare with $6.45MM per breach. Average size of a data breach is 25,575 records.Greisiger’s results, which focus on claims payments, are lower than those of the Ponemon report, which reported on expenses incurred. According to a governmental report, more than half of UK businesses have not identified their cybersecurity breaches (Sharf Citation2016).
Cyber insurance protects against financial losses associated with the IT network and system failures. Currently, market penetration is relatively low; only one third of US business have some kind of cyber insurance (Romanosky et al. Citation2017). New legislation relating to cybersecurity is coming into effect in many jurisdictions. These regulatory initiatives are trying to have a positive impact on the uptake of cyber insurance. For instance, the General Data Protection Regulation (GDPR), which came into effect on 24th May 2018, replaced the EU Data Protection Directive 95/45/EC. This changed European data protection laws significantly and applied to all companies storing or processing the personal data of EU citizens. Penalties for non-compliance are severe (Rubinstein and Petkova Citation2018). It is anticipated that the cyber insurance market will grow significantly due to the introduction of these regulations Augustinos et al. (Citation2016). It is anticipated that the cyber insurance market will grow significantly due to the introduction of these regulations (Augustinos et al. Citation2016). The total global premiums are around $2 billion and are estimated to reach $20 billion within a decade (Dobie and Collins Citation2015).
In recent years, there has been an increase in academic literature published in the technology sphere relating to cyber-defence (Von Solms and Van Niekerk Citation2013), cyber risk control systems (Byres and Lowe Citation2004), cyber technology evaluation (Bajcsy et al. Citation2004), and cyber-threat detection techniques (Kaur and Singh Citation2014). In contrast, despite the growing relevance of cyber risk for businesses, there has been a limited academic investigation into the topic from a business, economic and insurance perspective. The main academic articles on cyber risk and insurance highlight the challenges relating to the modelling, quantification and lack of historical data (Biener, Eling, and Wirfs Citation2015; Maillart and Sornette Citation2010), cyber risk correlations and complexity (Hofmann and Ramaj Citation2011; Öğüt, Raghunathan, and Menon Citation2011), and the problem of information asymmetry (Gordon, Loeb, and Sohail Citation2003). According to Toregas and Zahn (Citation2014), the main barriers to the market development are a dearth of standards and difficulties with quantifying risk for insurance purposes. Biener, Eling, and Wirfs (Citation2015) consider information asymmetry to be the most significant hurdle to the expansion of cyber insurance. An obvious obstacle to the development is the lack of claims data because of the early reluctance of companies to admit cyber breaches. California was the first U.S state to bring in mandatory reporting with 90% of the US states following suit. For this reason, more breaches have been documented in the U.S than in Europe. Current cyber insurance has evolved into a product that minimises the cost of a cyber-attack through supportive services. For example, some policies include access to an incident response service, forensic services, and PR and breach coaching.
Another major hindrance for cyber insurers is the difficulty in accurately categorising security breach incidents (Gai et al. Elnagdy, Qiu, and Gai Citation2016a,b). Elnagdy, Qiu, and Gai (Citation2016) develop a cyber-classification model to represent the correlation of cyber-incidences and map cyber-incidences to insurance products in one information system. Insurance policy premiums are predominately based on weighted parameters relating to costs and risks posed (Ma et al. Citation2016). The complexity and potential interconnection of cyber-incidences make it challenging to map the correct risk classification. Elnagdy, Qiu, and Gai (Citation2016) find that an ontology-based approach is a practical solution to connect insurance cover and cyber risks. Cyber insurance differs from other more traditional lines of business such as car insurance because of the difficulty in assigning a value to the digital information. Ruan (Citation2017) endeavours to address this by introducing cyber risk measurement units, using a novel multidisciplinary approach,” Cybernomic”. Cybernomics combines economics and cyber risk management to analyse the requirements of a data bank, which enhances risk analytics, enabling the valuation and assessment of the exposure of digital assets, while improving the management of residual risk.
Gordon, Loeb, and Sohail (Citation2003) specify a framework to utilise insurance as a mechanism for cyber risk management concerning data security, which concerns the entire risk management process, including a comprehensive strategy for making insurance decisions. Gai et al. Elnagdy, Qiu, and Gai (Citation2016a) propose a framework, which combines multiple techniques, both technical and business to assess cyber-security incidences for financial firms to improve decision-making and help to lower the cost of cyber insurance.” Monte Carlo simulation” is used in incident identification to model the correlation between cyber-incidents, with the cyber-incidents hierarchy established through determining the associated relationships (ibid). Others (Böhme and Kataria Citation2006) classify correlated cyber risks properties into internal (within a company) and external (across independent companies). Correlation of cyber risk is an indicator of potential further cyber breaches. Using a Bayesian Belief Network (BBN) model, Mukhopadhyay et al. (Citation2013) propose a cyber vulnerability assessment based on Copula-aided Bayesian Belief Network (CBBN). This model also computes expected loss and can be used by companies to understand their vulnerabilities and therefore, the usefulness of cyber insurance.
This paper covers a gap in the academic literature by proposing a cyber risk classification and quantification framework for insurance companies. It is designed to demonstrate the significance of proactive and reactive barriers in reducing companies’ exposure to cyber risk, enabling the implementation of informed cyber risk management plans and assess the risk regarding different risk factors captured by bow tie analysis. With more data, the framework can be developed into a fully quantitative method to assess cyber risk, enabling a more accurate and comprehensive assessment of the risk by insurers. The framework can also be used as an effective visual mechanism to communicate advice to insurers’ current customer base and potential future customers on how to maintain and/or improve their cyber risk rating. The framework presents a methodological approach to rank organisations based on their cyber-security posture. Cyber-security posture refers to the company’s cyber-security strength, and its vulnerability to cyber-threats, considering the likelihood and potential consequences of cyber-incidents.
In order for a cyber risk classification framework to be effective, it needs to be one that can adapt to the dynamic nature of the risk and evolve when data becomes available as the risk emerges. The proposed method involves combining a bow-tie model with a risk matrix to produce a rating based on the likelihood of a cyber-threat occurring and the potential severity of the resulting consequences. A bow-tie model on its own is limited as it does not produce quantitative conclusions when assessing risk (Lu et al. Citation2015). To overcome this, the framework combines a bow-tie model with a risk matrix. The risk matrix introduces ranking criteria for likelihood and severity/impact, to quantify the overall cyber risk and give a cyber risk rating. The advantage of this methodology is that it allows the use of expert opinion, appended with quantitative and qualitative information, to produce a risk matrix. Presently, quantitative data on economic loss is slowly forthcoming, but its usefulness is limited by the lack of a priori data on cyber-incidences (Re Citation2017). The proposed framework fills the gap by creating an intermediate semi-quantitative method that measures cyber risk from an insurance perspective until there is sufficient data available, which will allow insurers to create a more comprehensive, fully quantitative cyber risk rating framework.
Up to now, there have been many academic and industry endeavours to fulfil the gaps of data and risk management cases shortcoming in cyber risk studies. Many successful models and methods have been creating to deal with different problems regarding these gaps from different perspectives. Our proposed model, QBowtie, builds upon the limitations of these models through building the bow-tie model for risk analysis. summarises significant models, standards, and frameworks used in cyber risk management. These are briefly introduced, critiqued in terms of cyber risk analysis, finally compared to QBowtie.
Table 1. Brief description of IT-based risk/threat/maturity models, their advantage and disadvantages, and their relation to our proposed QBowtie model.
A significant cyber threat assessment methodology is CVSS (Common Vulnerability Scoring System), where a score is given to a cyber vulnerability according to its characteristics (Sheehan et al. Citation2019). The characteristics used for calculation of the score include the impact of the attack (ibid). CVSS can be used by experts to find threats/vulnerabilities and score them in our model. FAIR (Factor Analysis of Information Risk) is another methodology in cyber risk factor assessment that uses risk factors taxonomy to calculate their likelihood and magnitude (Wangen, Hallstensen, and Snekkenes Citation2018). Anything that can impact threats and consequences regarding the risk is a risk factor. NIST SP800 (National Institute of Standards and Technology, Special Edition) is a method to barriers for cyber-threats. This method can be used to find different barriers regarding different threats (Nurliyani Citation2019). OCTAVE (Operationally Critical Threat, Asset, and Vulnerability Evaluation) is a framework for identifying assets in risk, the threats, and vulnerabilities that can make these threats happen (Alberts et al. Citation1999). OCTAVE-S is also used for medium and small businesses. This method has three phases of progressive workshops. Organisational and technological view of risk are reviewed in phases one and two of OCTAVE. Strategies and mitigation plans are developed in the final phase. Another risk assessment and mitigation framework called TARA (Threat Agent Risk Assessment), which is designed in Intel Co. scores cyber threats and chooses the most important ones for mitigation (Rossebo et al. Citation2016). This model is beneficial for experts using QBowtie when they are scoring the threats from 1 to 5. CORAS is another security risk analysis method which tries to find threats and vulnerabilities with a model-based approach ((Lund, Solhaug, and Stølen Citation2010). This approach benefits from a language and UML-based modelling tool. QBowtie can help CORAS in the process of finding threats and vulnerabilities related to a case with bow-tie analysis.
QBowtie can have two different relations with cyber risk analysis models. In some cases, it can fill a gap in a model. In other cases, that model helps QBowtie in one of its phase from identifying to scoring threats. For example, QBowtie can use OWASP (Open Web Application Security Project) to identify security threats and vulnerability in web applications and portals. OWASP produces standards and security checklists and procedures for web-based systems (Kellezi, Boegelund, and Meng Citation2019).
Maturity models have been developed to assess the ability and effectiveness of systems in different situations. The higher the level of maturity of the system, the greater its ability to deal with different situations, including potential and actual risks (Paulk Citation2002). The output of the QBowtie model can be used to examine cyber risks in particular levels of different maturity models. Two famous maturity models can benefit from our risk classification framework, CMMI (Capability Maturity Model Integration) and IoTMM (Internet of Things Maturity Model). A well-known model of maturity used in information technology systems, especially in the software industry, is the CMMI model. CMMI is a requirement in many US governmental contracts. It defines five different maturity steps, where one of the points raised in the third level is the cyber risk dimension (Chaudhary and Chopra Citation2017). In IoT-based systems, there is another maturity model called IoTMM. This model seeks to help developers of IoT systems understand what level of maturity they are at and what they need to achieve the desired level (Almajali et al. Citation2019). Experts can find related cyber threats and vulnerabilities for organisations that use IoT technology.
2. Methodology
The bow tie method is a risk evaluation method used to analyse and demonstrate causal relationships in risky scenarios. It was developed by the Shell Group under the name of HEMP (Hazard, Effect and Management Process), but known internally as the “bow-tie diagram” (Zuijderduijn Citation2000). The approach offers an overview of different risk scenarios under analysis with the causes and consequences of an incident depicted in the diagram. A bow-tie was constructed following steps as described by Mulcahy et al. (Citation2017) and Lu et al. (Citation2015). In brief, this involves identifying the Hazard (e.g. Data Storage) and Top Event (e.g. Cyber Attack/Data Breach). On one side of the bow-tie are Threats, Proactive Barriers and Threat Escalators. On the other side are Consequences, Mitigation or Reactive Barriers and Severity Escalators. The terminology associated with the bow-tie framework varies in different researches. For the sake of clarity, we must note that threats are the same as causes in other bow-tie researches. Reactive barrier escalators can be considered as the potential failure of the safety barriers, and proactive barrier escalators, potential failure of mitigation plans and tools. Finally, consequences are the same as impacts in some other bow-tie research literature.
The bow-tie model construction was based on published data relating to cyber breaches/cyber-attacks (McAfee Citation2014; Ponemon Institute Citation2020), published data sets (Klahr Citation2017) and published claims data (Tungatt Citation2017; Colvin and Dougherty Citation2017). The results recorded from the data sources were ameliorated by IT security experts’ opinions, allowing the fault tree to be grounded on the frequency of occurring risks/threats and the event tree consequences/severity, based on published claims data and cyber breach notification disclosure data. The IT security experts invited to take part in interviews to elicit the most relevant barriers and escalators for inclusion in the bow-tie analysis. Once the framework was constructed, follow-up semi-structured interviews were conducted, and the experts scored the barriers and escalators. Semi-structured interviews give the flexibility to follow different lines of inquiry, once in conversation, rather than being fixed to a set agenda, which gives stronger interview results (Jenner et al. Citation2004; Rabionet Citation2011; Whiting Citation2008). The results were tabulated and entered into the bow-tie model. To be classified as an IT security expert, the candidate has to meet the minimum requirements of possessing a third level qualification and greater than ten years of experience in the subject matter area. For this concept implementation, three experts were chosen as a representation of the IT security expert population.
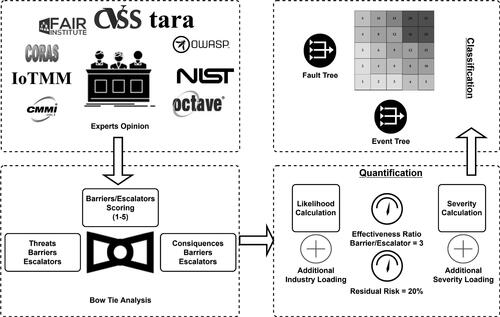
In our QBowtie methodology, we benefit from bow-tie analysis in identifying all risk factors. We use different risk analysis methods and maturity models as tools for experts in the identification process. In , different phases of the QBowtie risk classification methods are presented as a graphical abstract. As the first and second phases of identifying risk factors (threats, impacts, barriers, and escalators) finish, the quantification and classification phases start. In the third phase, we will score the risk factors, and the last phase of QBowtie classifies the cyber risk. In the following, all of these phases are described in detail.
Figure 1. Outline of QBowtie method for risk classification.
We assign variables to the barrier and escalator variables from cyber risk insurance proposal forms. Besides, IT security experts assisted in the process of identifying the components variables to include in the bow-tie. If the consensus was unanimous, then the variable was included. The experts then scored the Barriers and Escalators a value between 1 and 5 and assigned an appropriate weighting based on the rank of the particular threat path. As this score was based on the expert’s opinion, a uni-polar construct was used with a five-point scale, as this is found to be the most reliable for scoring judgement Krosnick and Fabrigar (Citation1997); McKelvie (Citation1978). The five points were labelled as follows: 1 Not at all effective, 2 Slightly effective, 3 Moderately effective, 4 Very effective, 5 Extremely effective.
Today, risk matrices are the most frequently used mechanism to present risk in the workplace (Collier et al. Citation2006) due to their ease of use and suitability for the assessment and ranking of a diverse spectrum of risks. The literature on the employment of risk matrices, in general, comes from the enterprise risk management, safety engineering, strategic and project management fields. A risk matrix is a semi-quantitative method used in risk assessment and is constructed based on the event likelihood and severity. The results of the fault tree provides the likelihood value and the event tree the value for severity. Additional industry loadings were applied to the variables ranks likelihood on five levels: very unlikely, unlikely, possible, likely and very likely, and severity based on low, moderate, critical, severe and catastrophic. Mulcahy et al. (Citation2017) suggest that bow-ties can give a false sense of security through the identification and implementation of barriers. To combat this, an advisory aspect has been incorporated into the framework, which gives prudent advice and information to current/potential customers based on where the company lands on the risk matrix.
Rating scales are the most commonly used measure for qualitative data, such as expert opinion which can be classified as ordinal data as it does not have any numeric value attached to it (Hand Citation1996). Therefore, it is not appropriate to use the mean and standard deviation to interpret the results of the experts’ scores used within the proposed framework, such descriptive measures can only be used when the data is quantitative (Svensson Citation2001). For this study the most suitable measures are the median and, as it is a small sample size, the minimum and maximums scores as appropriate (Svensson Citation2001). Risk is calculated by multiplying likelihood and consequence. As shown in Equationequation 1(1)
(1) ,
is the weighted barrier scores for the ith threat and jth category.
(1)
(1)
Where is the expert barrier score median for the ith threat category and the jth barrier. Similarly,
can be calculated as the weighted escalator score for the ith threat and zth escalator.
In examining the sources of uncertainty when converting qualitative expert opinion to quantitative score, the following should be considered: (1) lack of domain knowledge which is because of the nature of cyber risks and (2) inevitable expert bias. To reduce these destructive effects when gathering score samples, more knowledgeable and experienced experts should be considered. The number of experts referred to in the study should also be as large as possible.
It is unreasonable to assume that all cyber risks can be identified; therefore, to account for this uncertainty, the framework assumes a residual risk of 20%. We also assume that Barriers are 3 times as effective as Escalators giving a Total Barrier effectiveness to Total Escalator effectiveness ratio of 3:1. The number of Barriers/Escalators can vary depending on the Threat category. The assumption of having 20% residual risk and 3:1 Barrier/Escalator effectiveness ratio comes from consensus out of two different methods: Cyber risk experts brainstorming and interviews, and out-of-sample validation set concept in parameter estimation. A part of identified risks from the case study were put in a validation set and were tested with different values extracted from interviews and brainstorming sessions for residual risk and Barrier/Escalator effectiveness ratio. The best values with justifiable results under brainstorm method were chosen as the framework parameters. These parameters are shown as gauges in the to emphasis on the framework users’ ability to set them to any other value that suits different risk domains and applications. As more relevant data becomes available, QBowtie framework may also be adapted to incorporate more robust parameter uncertainty and residual estimation methods such as (Bignozzi and Tsanakas Citation2016).
If is the ith threat allowing for residual risk, then the reduction in the threat likelihood is given by Equationequation 2
(2)
(2) .
(2)
(2)
Now the calculation of the Sum of the Threats Likelihood (STL) will be calculated as presented in Equationequation 3(3)
(3) .
(3)
(3)
An additional industry loading is applied to the results of the fault tree analysis depending on the industry sector of the company being assessed, see .
Table 2. Additional Industry Loadings. (AIG and Claims Intelligence Series 2016).
For the Consequence/Event Tree Calculation, we again assume that residual risk is 20%, and the ratio of Total Barrier effectiveness to Total Escalator effectiveness is 3:1. Using similar notation, we state that the reduction in the consequence severity, SRi is given by Equationequation 4(4)
(4) where j is the nth barrier and z is the mth escalator,
is the applied barrier weight,
is the applied escalator weight. This gives the Sum of the Individual Consequence Severity (SIS) in Equationequation 5
(5)
(5) .
(4)
(4)
(5)
(5)
An additional severity loading is applied to the results of the event tree analysis, depending on the industry sector of the company being assessed, see .
Table 3. Additional Severity Loading by Sector. Data Source: (Ponemon Institute Citation2020).
The values for the Likelihood Rating (L) and the Severity Rating (S) are applied to the risk matrix to calculate the Cyber Risk Rating (CRR).
3. Results
3.1. Expert rating scores
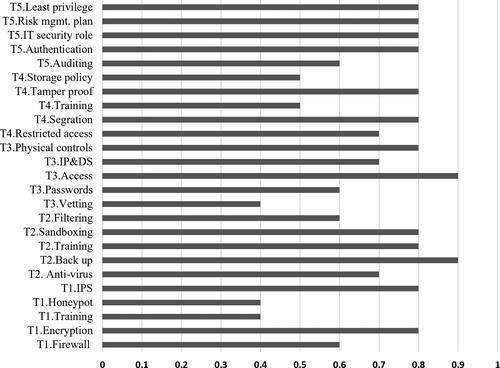
The distribution of the results of the experts’ rating scores for the barriers/escalators used in the bow-tie analysis is presented in the following bar charts. The barriers in below are divided into the five threat categories: Hacker (T1), Anti-Virus (T2), Insider –“Human Error/Malicious” (T3),”Lost/Stolen Device” (T4) and “Other Vulnerabilities” (T5). The threat barriers “Back-up” (T2) and “Restricted Access” (T3) received the highest median scores for level of effectiveness as a control/barrier for their threat category, with “Training” (T1), “Honeypot” (T1), and “Employee Vetting” scoring the lowest median scores 2.
Figure 2. Experts median scores for threat barriers.
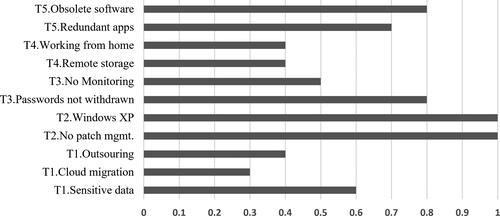
The threat escalators in below are divided into the five threat categories. The threat escalators “No Patch Management” (T2), “Windows XP as Operating System” (T2), both received high median scores in relation to their effectiveness to increase the likelihood of a threat occurring. “Cloud migration” (T1) had the lowest median score.
Figure 3. Experts median scores for threat escalators.
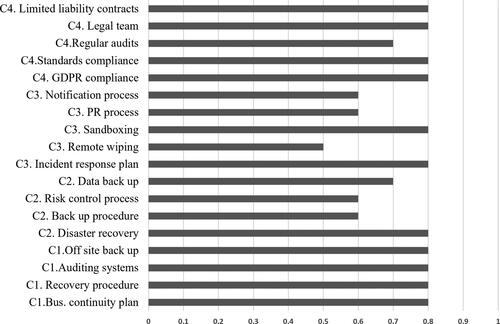
The consequence barriers in are divided into the four consequence categories: Business Interruption (C1), Financial Loss (Incl. Reinstatement of Data costs) (C2), Reputational Damage (Incl. Loss of Clients, Exposure of Sensitive Data) (C3), 3rd Party Claims and Regulatory Fines (C4). The consequence barriers “Business Continuity Plan” (BCP) (C1), “Recovery Procedure” (C1), “Auditing System” (C1), “Offsite Back-up” (C1), “Disaster Recover” (C2), “Incident Response Plan” (C3), “Sandboxing” (C3), “GDPR Compliance” (C4), “Standards Compliance” (C4), “Legal Team” (C4), and” Limited Liability Contract” (C4) all score high median.
Figure 4. Experts median scores for consequence barriers.
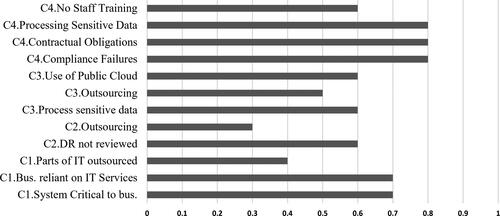
The consequence escalators in are divided into the four consequence categories, as before, for the consequence barriers. “Compliance Failure” (C4), “Contractual Obligation” (C4), and “Processing of Sensitive Data” (C4) all receive high median scores with “Outsourcing” (C2) receiving the lowest median score.
Figure 5. Experts median scores for consequence escalators.
3.2. Threat analysis results
The results of the construction of the fault tree are presented in . The threat categories are listed on the left-hand side of the diagram, in rectangular shapes. The percentage figures on top of each threat category represent the frequency of claims attributed to each threat category, based on data from AIG and Claims Intelligence Series (2016) and Netdiligence (Citation2019). For example, in the first threat category “Hacker” this figure is 27%. The figure underneath each threat category is the percentage frequency of claims less 20% (residual risk). The threat barriers (proactive) are listed running left to right in the ovals. For example, the first threat category is “Hacker”; the first barrier is “Firewall” and the last is “Intrusion Detection and Prevention System” (IDPS). The figure on top of each barrier represents the median score for that barrier divided by the total of the median barrier scores for that category. For the “Firewall” barrier, this figure is 0.20. The total of the weight of each barrier within each threat category equals the threat category frequency less residual risk.
Figure 6. Left hand side of bow-tie diagram for top event Data Breach illustrating threats (rectangles), barriers (ovals) and escalators (hexagons).
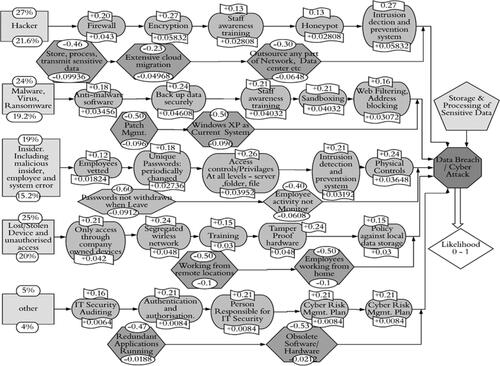
The threat escalators are listed running left to right, represented by hexagon shapes. In the first threat category “Hacker”, the escalators are “Storage, process, transmit sensitive data”, “Extensive cloud migration”, and “Outsource any part of Network, Data centre, etc.”. The figure on top of each escalator represents the median score for that escalator divided by the total of the median escalator scores for that category. The total of the weight of each escalator within each threat category equals the threat category frequency less residual risk. In the framework, barriers are three times as effective as escalators. Therefore, the sum of the escalators for each threat category is divided by three and subtracted from the sum of the barriers. The result is subtracted from the frequency of the threat category. The blue diamond shape on the lower right-hand side of the diagram displays the overall likelihood result, which will be between 0.2 and 1.0 for the threat analysis.
3.3. Consequence analysis results
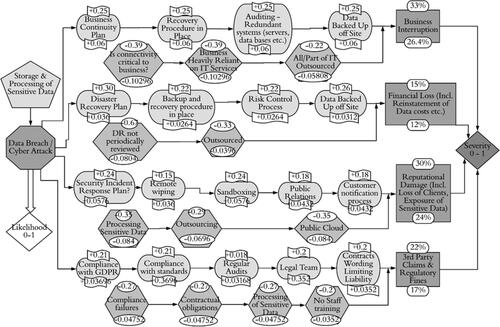
The results of the construction of the event tree are presented in . The consequence categories are listed on the right-hand side of the diagram, in rectangular shapes. The percentage figures on top of each consequence category represent the percentage of resultant insurance claims, following a cyber-attack, which can be attributed to each consequence category, based on data from Corporate, Allianz Global and Corporate, et al. (Citation2017). For example, in the first consequence category Business Interruption, this figure is 33%. The figure underneath each consequence category is the percentage claims” consequences following a cyber-attack less 20% (residual risk). The consequence barriers (reactive) are listed running left to the right in oval shapes for each consequence category, for example, in the first consequence category, the barriers are; “Business Continuity Plan”, “Recovery Procedure Plan in Place”, “Auditing Redundant System” and “Data Backed-up Off-Site”. The Consequence escalators are listed running left to right, represented by shapes, for each consequence category. The same procedure for calculation of the barriers and escalators used in the fault-tree apply to the barriers and escalators in the event tree below. The grey diamond shape on the central right-hand side of the diagram displays the overall severity result, which ranges between 0.2 − 1.0 for the consequence analysis.
Figure 7. Right hand side of Bowtie diagram for top event Data Breach illustrating consequences (rectangles), barriers (ovals) and escalators (hexagons).
3.4. Industry loadings and risk matrix
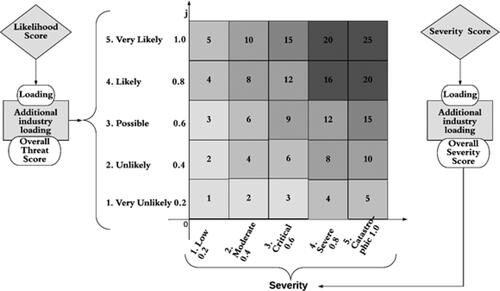
A 5 × 5 risk matrix is used to rank and present the overall score of the analyses, including the additional industrial loadings applied, see . The diamond shapes represent the results of the fault tree and event tree analyses. The industry loadings are applied to the analysis scores. The loadings applied for likelihood and severity depends on the industry ranking applied. The top-ranked industry to suffer a cyber-attack is financial services, and the industry with the highest severity ranking following a cyber-attack is healthcare. The risk matrix (below) is divided into 5 rating bands.
Figure 8. Cyber risk Matrix. The Threat is on the vertical axis, while the severity is on the horizontal. The combined score is mapped to a quadrant, and the top right represents the riskiest company, while the bottom left represents the least risky company.
3.5. Case study application of the conceptual framework
The framework was tested on a city hospital in Europe. One of the IT security experts who participated in the scoring of the bow-tie variables (barriers and escalators) works as an IT manager at the hospital. The details of the particular barriers and escalators employed at the hospital were confirmed. The answers were tabulated and applied to the framework. The hospital (system of hospitals and healthcare facilities) is one of the largest in Europe, with more than 15,000 employees. All employees have access to the computer system. The hospital is divided into five complexes, with sites varying in size. In addition, it includes a large number of smaller healthcare units/centres for out-patient care across the city. The hospital’s central IT organisation shares the operation, administration, management and maintenance of all IT, including the overall policies and risk management plans for all healthcare units that are part of the hospital system. Some of the IT systems are managed at the individual sites. The hospital has its own Chief Information Officer (CIO) and Information Services (IS)/IT division with full responsibility for information security. Each IT manager, on divisional and branch level, is responsible for the education and training of their employees. All IT aspects are conducted in-house.
The results quickly show that there is no staff awareness training for the hacker category and staff process sensitive data. Employees are not vetted, employees can work from home and remotely, and their activities are not monitored. The IT team are conducting a cloud migration. The likelihood score from the threat analysis is 0.42, and the additional likelihood loading for healthcare is 0.034 giving an overall likelihood score of 0.45. From the event tree analysis, it is clear that IT connectivity is critical to the business. The business is heavily reliant on IT services, but there is no effective risk control process in place. There is no capability to wipe data remotely, and there is no customer notification procedure in place despite the storage of sensitive data. No compliance audits are conducted, and finally, they do not conduct staff training for third party claims and regulatory fines. The severity score from the consequence analysis is 0.40; the additional severity loading for healthcare is 0.108. The overall severity score is 0.50. This puts the hospital’s cyber risk rating at 9 in the orange band. This case study demonstrates that the framework can not only offer a risk score (threat and consequence), but it can pinpoint steps that can/should be taken to improve the security measures. Likewise, it affords an insurance company a robust quantitative and qualitative assessment approach.
4. Discussion
4.1. Cyber insurance market
Emerging risks, such as cyber risk, are predicted to be the main growth drivers for the insurance industry (Marotta et al. Citation2017). This expansion is even more challenging without historical claims data to quantify cyber risk plus the ever-changing risk landscape. As the cyber insurance market develops, insurers will require tools to offer competitive premia without exposure to excessive risks. To achieve this, many insurers are looking beyond their traditional alliances, developing new partnerships with IT security vendors who can offer IT security expertise and provide supportive services as part of a cyber insurance product.
The results of our framework show that the threat category “Hacker” is the most likely cause of a cyber-attack/breach. For this category, the experts scored Encryption and Intrusion Detection and Prevention Systems (IDPS) as the most effective barriers of prevention, with firewalls next. Barrier mechanisms such as firewalls, encryption and IDPS have numerous types; for example, a firewall can be a hardware appliance, software on a PC or a router (Oppenheimer Citation2011). Their effectiveness is dependent on the type, for instance, data encryption or network encryption, quality and the deployment technique used. IDPS detection, for example, uses techniques such a “signature-base” or “statistical anomaly” methods to identify malicious traffic (Oppenheimer Citation2011). Therefore, the efficacy of the mechanism/system will vary subject to deployment techniques used by the vendors and where they are implemented within the organisation. Consequently, when evaluating cyber risk, insurers should rate the quality and ensure that best practices and procedures are followed.
Another significant factor when assessing a company’s vulnerability to the Hacker category threat is whether they use outsourcing. Our experts scored Outsourcing high as a potential escalator for this threat category. Hackers are becoming increasingly skilled at using third party companies as channels of attack, extending companies’ cyber vulnerabilities to those of their partners. An example of this is the Petya ransomware attack which originated in Ukraine and spread across the globe, largely through outsourcing partners or subsidiaries (Aidan, Verma, and Awasthi Citation2017). This demonstrates how poor partner cyber-security reduces the effectiveness of a company’s own security investments. One escalation factor barrier would be to require all partners to adhere to certain information security standards, such as the ISO/IEC 27011:2013 Schweizerische (Citation2013).
Staff Awareness Training scored higher than Anti-Virus Software and Web Filtering for the threat category Malware, Virus, and Ransomware. This is most likely due to the fact that human error poses a significant cyber risk, yet trained staff can also be valuable defensive barriers. As an illustration, untrained staff may not be able to identify a phishing e-mail, while a trained staff member can understand preventive procedures and act as an enabler for existing IT security barriers (Augustinos et al. Citation2016). Certification is one method of demonstrating a company’s level of staff awareness training. In 2014 in the UK, the government launched the “Cyber Essentials Scheme” in a bid to improve the level of cyber-security of SMEs (Cyber Essentials Citation2015). Following that, cyber insurers such as AIG and Swiss Re have adopted this as an assurance certificate of UK SMEs (Small and Medium-sized Enterprises) cyber-security.
The results of the framework show that the consequence category Business Interruption is the most likely outcome following a cyber-attack/breach. Connectivity critical to the Business and Business Heavily Reliant on IT Services were scored as the most significant severity escalators for Business Interruption. The experts scored the preparedness barriers, Business Continuity Plan and Disaster Recovery Plan, high as reactive barriers in the event of a cyber-attack/breach. The high score for such barriers is consistent with the results of a study by (Ponemon Institute Citation2020), which found that incidence response barriers are an effective means of containing and reducing the cost of a cyber-attack/breach.
The experts scored Storage and Processing of Sensitive Data high as an escalator for increasing the severity of the consequence categories Reputational Damage and Third Party Claims and Regulatory Fines. Data breach costs for heavily regulated industries such as healthcare, education and financial services are significantly higher than for other less regulated industries, like transport and media (Ponemon Institute Citation2020). It follows that higher accountability increases the severity of consequences following a cyber breach. It is important for companies handling sensitive information to identify their level of sensitivity and criticality, and to categorise it for each stakeholder (Customer, Corporate, Third Party, and Employee), in the data life cycle accordingly. Such an approach would facilitate companies to establish a cyber risk management strategy, which could subsequently be used to guide meaningful cyber protection and mitigation investments. With the introduction of the GDPR in 2018, fines may negatively impact the reputation and revenue of companies falling victim to cyber-attacks/breaches. Perhaps, in anticipation of the implementation of the new regulations, the experts scored Compliance with GDPR and Compliance with Standards as the most important barriers for consequence category Third Party Claims and Regulatory Fines. Along with increasing the demand for cyber insurance, the introduction of the GDPR is likely to increase EU companies’ investment in security protection measures. This may improve the risk posed to EU insurers.
4.2. Results of the case study
From an insurer’s perspective, the analysis of the hospital highlighted that there was no Staff Awareness Training for the Hacker category, and the hospital does not Vet Prospective Employees and Monitor Employee Activity. If these barriers were implemented, and the escalator removed, the hospital’s risk likelihood score would be reduced from 0.45 to 0.39. The event tree analysis shows that the hospital does not have a Risk Control Process in place, nor do they conduct Staff Awareness Training in relation to Third Party Claims and Regulatory Fines. Were this rectified, then the hospital’s risk rating would be reduced from 0.50 to 0.42. In summation, if the recommendations mentioned above were applied, the hospital’s cyber risk rating would be reduced from 9 to 6 on the cyber risk rating matrix.
According to a survey conducted by the UK government (Klahr Citation2017), only 28 per cent of FTSE 350 companies have invested in comprehensive cyber-attack training. The report also highlighted the increased severity of cyber breaches for different sectors, with the healthcare sector ranked highest. In the case study, the hospital has a large number of employees with access to the system, which increases human error vulnerability. Moreover, the hospital has a centralised IT system in place; this increases the potential severity of attacks, as once one part of the system is breached the whole system is potentially at risk. Human negligence can be reduced through awareness training and monitoring of employees. This is something that the framework highlights as an area that needs to be addressed.
Finally, As Mulcahy et al. (Citation2017) mention in their research, there must be a safety management system that supports the bow-tie framework results. This management system must include continuous training and maintenance subsystems. Without a continuous active management process, the bow-tie risk assessment will be a piece of paper and holes in the barriers makes the situation similar to failures that happen in Swiss Cheese model (Reason Citation2000) and the model will lose its practical and advisory value.
5. Conclusion
The rapid digitisation of organisations, along with the widespread use of internet devices, has resulted in the emergence of cyber risk. Most companies either do not fully understand the potential severity or appreciate the extent of their cyber vulnerabilities. This has resulted in a low market penetration of cyber insurance. However, with the increase in cyber-attacks/breaches and the implementation of new data protection regulations in many insurance jurisdictions, the cyber insurance market is predicted to grow rapidly over the coming ten years. The main academic articles on cyber risk and insurance highlight the challenges relating to modelling, quantification and the lack of historical claims data. With this in mind, this research paper presents a methodological approach to rank organisations based on their cyber-security posture. The proposed method involves combining a bow-tie model with a risk matrix to produce a rating based on the likelihood of a cyber-threat occurring and the potential severity of the resulting consequences. The advantage of this methodology is that it allows the use of expert opinion, appended with quantitative and qualitative information.
The application of the proposed cyber risk classification framework has demonstrated that it would allow insurers to assess risks, visualise areas of concern and record the effectiveness of implementing control barriers. This would enable them to give advice on how insureds can improve their rating, thus reducing their insurance premiums. The framework could be reapplied, before insurance renewals, to confirm insureds have maintained an acceptable level of cyber risk. Furthermore, insurers could use the framework to understand the risk posed by individual threats, consequences or risks to different industry sectors, to guide insurance product development. This would facilitate insurers in the development of new standalone cyber insurance products or “add-on” to current cyber insurance policies. Thus enabling them to cater for specific insurance needs and provide additional support services to reduce the likelihood of a cyber-attack and help mitigate the consequences following an attack. From an insured’s perspective, the framework could be used as a visualisation tool to guide their cyber risk management strategies and prioritise their cyber-security investments.
We demonstrate the efficacy of the approach using a large European hospital as a case study. The resultant analysis shows how quickly threats and consequences can be identified and how ameliorating actions can reduce those threats. The quantitative score allows for a comparative analysis. As more data becomes available through regulatory disclosure requirements, insurers claims’ experience and data sharing, the framework can be developed into a fully quantitative cyber risk classification method.
No potential conflict of interest was reported by the author(s).
Disclosure statement
Additional information
Funding
References
- Aidan, Jagmeet Singh, Harsh Kumar Verma, and Lalit Kumar Awasthi. 2017. “Comprehensive Survey on Petya Ransomware Attack.” In 2017 International Conference on Next Generation Computing and Information Systems (ICNGCIS), 122–125. IEEE. doi:https://doi.org/10.1109/ICNGCIS.2017.30.
- AIG, Claims Intelligence Series 2016. “Behind the numbers: Key drivers of cyber insurance claims.” https://www.aig.co.uk/content/dam/aig/emea/united-kingdom/documents/Insights/aig-claims-intelligence-cyber.pdf. [Online; accessed 15-May-2020].
- Alberts, Christopher J., Sandra G., Behrens, Richard D. Pethi A, and William R. Wilson. 1999. Operationally critical threat, asset, and vulnerability evaluation (OCTAVE) framework, Version 1.0. Technical Report. CARNEGIE-MELLON UNIV PITTSBURGH PA SOFTWARE ENGINEERING INST.
- Almajali, Sufyan, I. Dhiah el Diehn, Haythem Bany Salameh, Moussa Ayyash, and Hany Elgala. 2019. “A Distributed Multi-Layer MEC-Cloud Architecture for Processing Large Scale IoT-Based Multimedia Applications.” Multimedia Tools and Applications 78 (17): 24617–24638. doi:https://doi.org/10.1007/s11042-018-7049-3.
- Augustinos, T. P., L. Bauer, A. Cappelletti, J. Chaudhery, I. Goddijn, L. Heslault, N. Kalfigkopoulos, et al. 2016. Cyber insurance: recent advances, good practices & challenges.
- Bahşi, Hayretdin, Ulrik Franke, and Even Langfeldt Friberg. 2019. “The Cyber-Insurance Market in Norway.” Information & Computer Security 28 (1): 54–67. doi:https://doi.org/10.1108/ICS-01-2019-0012.
- Bajcsy, Ruzena, Terry Benzel, Matt Bishop, B. Braden, C. Brodley, Sonia Fahmy, Sally Floyd, et al. 2004. “Cyber Defense Technology Networking and Evaluation.” Communications of the ACM 47 (3): 58–61. doi:https://doi.org/10.1145/971617.971646.
- Biener, Christian, Martin Eling, and Jan Hendrik Wirfs. 2015. “Insurability of Cyber Risk: An Empirical Analysis.” The Geneva Papers on Risk and Insurance - Issues and Practice 40 (1): 131–158. doi:https://doi.org/10.1057/gpp.2014.19.
- Bignozzi, Valeria, and Andreas Tsanakas. 2016. “Parameter Uncertainty and Residual Estimation Risk.” Journal of Risk and Insurance 83 (4): 949–978. doi:https://doi.org/10.1111/jori.12075.
- Böhme, Rainer, and Gaurav Kataria. 2006. “Models and Measures for Correlation in Cyber-Insurance.” In WEIS.
- Byres, Eric, and Justin Lowe. 2004. “The Myths and Facts behind Cyber Security Risks for Industrial Control Systems.” In Proceedings of the VDE Kongress, Vol. 116, 213–218.
- Chaudhary, Mukund, and Abhishek Chopra. 2017. CMMI for Development. New York, USA: Springer.
- Collier, Paul M. M., Paul M., Collier, Anthony J. Berry, Andrew Berry, and Gary T. T. Burke. 2006. Risk and Management Accounting: best Practice Guidelines for Enterprise-Wide Internal Control Procedures. Vol. 2. Linacre House, Oxford: Elsevier.
- Colvin, Nathan L., and Timothy C. Dougherty. 2017. “Trends for Potential Insurance Coverage for Losses Arising from a Data Breach.” N. Ky. L. Rev 44: 29–38.
- Dobie, Greg, and Stewart Collins. 2015. A Guide to Cyber Risk–Managing the Impact of Increasing Interconnectivity, 1–28. London: Allianz Global Corporate & Specialty.
- Elnagdy, Sam Adam, Meikang Qiu, and Keke Gai. 2016. “Cyber Incident Classifications Using Ontology-Based Knowledge Representation for Cybersecurity Insurance in Financial Industry.” In 2016 IEEE 3rd International Conference on Cyber Security and Cloud Computing (CSCloud), 301–306. IEEE. doi:https://doi.org/10.1109/CSCloud.2016.45.
- Cyber Essentials. 2015. “Cyber essentials scheme: Assurance framework.” UK Government.
- Gai, Keke, Meikang Qiu, and Sam Adam Elnagdy. 2016a. “A Novel Secure Big Data Cyber Incident Analytics Framework for Cloud-Based Cybersecurity Insurance.” In 2016 IEEE 2nd International Conference on Big Data Security on Cloud (BigDataSecurity), IEEE International Conference on High Performance and Smart Computing (HPSC), and IEEE International Conference on Intelligent Data and Security (IDS), 171–176. IEEE.
- Gai, Keke, Meikang Qiu, and Sam Adam Elnagdy. 2016b. “Security-Aware Information Classifications Using Supervised Learning for Cloud-Based Cyber Risk Management in Financial Big Data.” In 2016 IEEE 2nd International Conference on Big Data Security on Cloud (BigDataSecurity), IEEE International Conference on High Performance and Smart Computing (HPSC), and IEEE International Conference on Intelligent Data and Security (IDS), 197–202. IEEE.
- Gordon, Lawrence A., Martin P. Loeb, and Tashfeen Sohail. 2003. “A Framework for Using Insurance for Cyber-Risk Management.” Communications of the ACM 46 (3): 81–85. doi:https://doi.org/10.1145/636772.636774.
- Hand, David J. 1996. “Statistics and the Theory of Measurement.” Journal of the Royal Statistical Society: Series A (Statistics in Society) 159 (3): 445–473. doi:https://doi.org/10.2307/2983326.
- Hofmann, Annette, and Hidajet Ramaj. 2011. “Interdependent Risk Networks: The Threat of Cyber Attack.” International Journal of Management and Decision Making 11 (5/6): 312–323. doi:https://doi.org/10.1504/IJMDM.2011.043406.
- Hubmann, Christina, Heidi Polke-Markmann, Bettina Sattler, Patrik Vanheyde, Allianz Global Corporate. 2017. “Allianz Risk Barometer: Top Business Risks 2017.” https://www.agcs.allianz.com/content/dam/onemarketing/agcs/agcs/reports/Allianz-Risk-Barometer-2017.pdf. [Online: accessed 18-May-2020].
- Jenner, Bryan, Uwe Flick, Ernst von Kardoff, and Ines Steinke. 2004. A Companion to Qualitative Research. London: Sage.
- Kaur, Ratinder, and Maninder Singh. 2014. “A Survey on Zero-Day Polymorphic Worm Detection Techniques.” IEEE Communications Surveys & Tutorials 16 (3): 1520–1549. doi:https://doi.org/10.1109/SURV.2014.022714.00160.
- Kellezi, Deina, Christian Boegelund, and Weizhi Meng. 2019. “Towards Secure Open Banking Architecture: An Evaluation with OWASP.” In International Conference on Network and System Security, 185–198. Springer.
- Klahr, Rebecca. 2017. “Cyber Security Breaches Survey.” PhD diss., University of Portsmouth.
- Krosnick, Jon A., and Leandre R. Fabrigar. 1997. “Designing Rating Scales for Effective Measurement in Surveys.” Survey Measurement and Process Quality 141–164.
- Lu, Linlin, Wei Liang, Laibin Zhang, Hong Zhang, Zhong Lu, and Jinzhi Shan. 2015. “A Comprehensive Risk Evaluation Method for Natural Gas Pipelines by Combining a Risk Matrix with a Bow-Tie Model.” Journal of Natural Gas Science and Engineering 25: 124–133. doi:https://doi.org/10.1016/j.jngse.2015.04.029.
- Lund, Mass Soldal, Bjørnar Solhaug, and Ketil Stølen. 2010. Model-Driven Risk Analysis: The CORAS Approach. Heidelberg: Springer Science & Business Media.
- Ma, Li, Lixin Tao, Yong Zhong, and Keke Gai. 2016. “RuleSN: Research and Application of Social Network Access Control Model.” In 2016 IEEE 2nd International Conference on Big Data Security on Cloud (BigDataSecurity), IEEE International Conference on High Performance and Smart Computing (HPSC), and IEEE International Conference on Intelligent Data and Security (IDS), 418–423. IEEE.
- Maillart, Thomas, and Didier Sornette. 2010. “Heavy-Tailed Distribution of Cyber-Risks.” The European Physical Journal B 75 (3): 357–364. doi:https://doi.org/10.1140/epjb/e2010-00120-8.
- Marotta, Angelica, Fabio Martinelli, Stefano Nanni, Albina Orlando, and Artsiom Yautsiukhin. 2017. “Cyber-Insurance Survey.” Computer Science Review 24: 35–61. doi:https://doi.org/10.1016/j.cosrev.2017.01.001.
- McAfee 2018. “Economic Impact of Cybercrime, No Slowing Down.” https://www.mcafee.com/enterprise/enus/solutions/lp/economicscybercrime.html/. [Online; accessed 15-May-2020].
- McAfee, Net Losses. 2014. “Estimating the global cost of cybercrime, economic impact of cybercrime ii.” Center for Strategic and International Studies.
- McKelvie, Stuart J. 1978. “Graphic Rating Scales—How Many Categories?” British Journal of Psychology 69 (2): 185–202. doi:https://doi.org/10.1111/j.2044-8295.1978.tb01647.x.
- Mukhopadhyay, Arunabha, Samir Chatterjee, Debashis Saha, Ambuj Mahanti, and Samir K. Sadhukhan. 2013. “Cyber-Risk Decision Models: To Insure IT or Not?” Decision Support Systems 56: 11–26. doi:https://doi.org/10.1016/j.dss.2013.04.004.
- Mulcahy, Mary Beth, Chris Boylan, Samuella Sigmann, and Ralph Stuart. 2017. “Using Bowtie Methodology to Support Laboratory Hazard Identification, Risk Management, and Incident Analysis.” Journal of Chemical Health and Safety 24 (3): 14–20. doi:https://doi.org/10.1016/j.jchas.2016.10.003.
- Netdiligence 2019. “Cyber claims study report.” https://netdiligence.com/wp-content/uploads/2019/10/2019/_NetD/_Claims/_Study/_Report/_1.0.pdf. [Online; accessed 18-May-2020].
- Nurliyani, Arlin. 2019. “Assessment IT Risk Management at the Computer and Network Laboratory School.” Journal of Informatics and Telecommunication Engineering 3 (1): 115–124. doi:https://doi.org/10.31289/jite.v3i1.2622.
- Öğüt, Hulisi, Srinivasan Raghunathan, and Nirup Menon. 2011. “Cyber Security Risk Management: Public Policy Implications of Correlated Risk, Imperfect Ability to Prove Loss, and Observability of Self-Protection.” Risk Analysis: An Official Publication of the Society for Risk Analysis 31 (3): 497–512. doi:https://doi.org/10.1111/j.1539-6924.2010.01478.x.
- Oppenheimer, Priscilla. 2011. Top-Down Network Design. Indianapolis, USA: Cisco Press. ISBN 1: 57069–57870.
- Paulk, Mark. 2002. “Capability maturity model for software.” Encyclopedia of Software Engineering.
- Ponemon Institute 2020. “Cost of Data Breach Study: Global Overview.” https://www.ibm.com/security/data-breach. [Online; accessed 15-May-2020].
- Rabionet, Silvia E. 2011. “How I Learned to Design and Conduct Semi-Structured Interviews: An Ongoing and Continuous Journey.” Qualitative Report 16 (2): 563–566.
- Re, Swiss. 2017. “Cyber: Getting to grips with a complex risk.” Sigma Report.
- Reason, James. 2000. “Human Error: models and Management.” BMJ (Clinical Research ed.) 320 (7237): 768–770. doi:https://doi.org/10.1136/bmj.320.7237.768.
- Romanosky, Sasha, Ablon Lilian, Kuehn Andreas, and Jones Therese. 2017. “Content analysis of cyber insurance policies: How do carriers write policies and price cyber risk?” Available at SSRN 2929137.
- Rossebo, Judith E. Y., Fransen Frank, and Luiijf Eric. 2016. “Including Threat Actor Capability and Motivation in Risk Assessment for Smart GRIDs.” In 2016 Joint Workshop on Cyber-Physical Security and Resilience in Smart Grids (CPSR-SG), 1–7. IEEE.
- Ruan, Keyun. 2017. “Introducing Cybernomics: A Unifying Economic Framework for Measuring Cyber Risk.” Computers & Security 65: 77–89. doi:https://doi.org/10.1016/j.cose.2016.10.009.
- Rubinstein, Ira, and Bilyana Petkova. 2018. “The international impact of the General Data Protection Regulation.” Commentary on the General Data Protection Regulation, Marc Cole & Franziska Boehm, Edward Elgar.
- Schweizerische, S. N. V. 2013. “Information technology-Security techniques-Information security management systems-Requirements.” ISO/IEC International Standards Organization.
- Sharf, Elad. 2016. “Information Exchanges: regulatory Changes to the Cyber-Security Industry after Brexit: Making Security Awareness Training Work.” Computer Fraud & Security 2016 (7): 9–12. doi:https://doi.org/10.1016/S1361-3723(16)30052-5.
- Sheehan, Barry, Finbarr Murphy, Martin Mullins, and Cian Ryan. 2019. “Connected and Autonomous Vehicles: A Cyber-Risk Classification Framework.” Transportation Research Part A: policy and Practice 124: 523–536. doi:https://doi.org/10.1016/j.tra.2018.06.033.
- Svensson, Elisabeth. 2001. “Guidelines to Statistical Evaluation of Data from Rating Scales and Questionnaires.” Journal of Rehabilitation Medicine 33 (1): 47–48. doi:https://doi.org/10.1080/165019701300006542.
- The Institute of Cyber Risk Management 2014. “Cyber Risk - Resources for Practitioners.” https://www.iia.org.uk/media/560694/irm/_cyber/_risk/_for/_practioners.pdf. [Online; accessed 15-May-2020].
- Toregas, Costis, and Nicolas Zahn. 2014. “Insurance for Cyber Attacks: The Issue of Setting Premiums in Context.” George Washington University
- Tungatt, Gareth. 2017. “Cyber Insurance Comes of Age.” Cyber Security: A Peer-Reviewed Journal 1 (3): 251–258.
- Von Solms, Rossouw, and Johan Van Niekerk. 2013. “From Information Security to Cyber Security.” Computers & Security 38: 97–102. doi:https://doi.org/10.1016/j.cose.2013.04.004.
- Wangen, Gaute, Christoffer Hallstensen, and Einar Snekkenes. 2018. “A Framework for Estimating Information Security Risk Assessment Method Completeness.” International Journal of Information Security 17 (6): 681–699. doi:https://doi.org/10.1007/s10207-017-0382-0.
- Whiting, Lisa S. 2008. “Semi-Structured Interviews: guidance for Novice Researchers.” Nursing Standard (Royal College of Nursing (Great Britain): 1987) 22 (23): 35–41. doi:https://doi.org/10.7748/ns2008.02.22.23.35.c6420.
- Zuijderduijn, C. 2000. “Risk management by Shell refinery/chemicals at Pernis, the Netherlands.” In EU Joint Research Centre Conference on Seveso II Safety Cases, Athens.
