
Abstract
This paper provides an overview and mapping of needs and use of data related to formal risk analysis within the context of critical infrastructures, including activities of risk assessments and risk modelling as a part of preventive work against major accidents and crises. The aim is to contribute to a greater understanding of the type of data that is actually used in published sources where different risk assessment or risk analysis methods are applied for critical infrastructure protection. The study focuses specifically on the presentation of applications of quantitative or semi-quantitative risk analysis in the scientific literature within the domain of societally important services and critical infrastructures. The survey was delimited to peer reviewed research papers between the years 2010 and 2020 and resulted in a total number of 183 papers subject for evaluation. The results provide insights into the type of data that is used, missing or difficult to obtain for an application of the identified methods. To obtain a comprehensive critical infrastructure risk analysis data needs are related to three different data dimensions; geospatial topology data, socio-economic data, and infrastructure data. However, no databases are currently available with the explicit purpose to support critical infrastructure risk analysis. Even though this is not viewed as a problem in the examined papers, collecting that data is resource intensive which is a barrier for a more systematic use of formal risk analysis methods.
1. Introduction
A main part of the work with implementing the global Sendai framework for disaster risk reduction (UNISDR, Citation2015) involves collection and analysis of qualitative and quantitative risk data from heterogeneous sources. This is not straightforward and facilitating nations’ ability to perform data collection and data usage, as well as data reporting to inform global indicators are ongoing activities in international bodies such as the United Nations Office for Disaster Risk Reduction (UNDRR). The ambition is for countries to have a national database for disaster data that supports the nations’ improvements within disaster risk reduction and management, the increase in societal resilience and the maintenance of an effective emergency preparedness. In particular, emphasis is on both the importance of a shared responsibility among countries and agencies to deal with societal disruptions in contemporary societies and the need to develop a form of collective intelligence to seize the potentials of combining advanced data driven methods with human creativity and values (UNDRR, Citation2019). The concept of ‘collective intelligence’ further highlights the need for context and meaningfulness in societal risk analysis to gain a deeper understanding of the methods used for risk assessment including a discussion of ethical and societal aspects to increase confidence in data-based decision-making processes and computer-based risk assessment, cf., e.g. (Peeters et al., Citation2021).
Previous research has revealed five obstacles for both research and practice in the context of critical infrastructures: a) the access to high-quality data, b) the loss of knowledge over time, c) the interpretation and evaluation of processes and methods, d) the transferability and comparability of data, results and insights, culminating in 5) a lack of collective intelligence (Große et al., Citation2021b). In particular, issues include the availability of relevant data, gaps in knowledge due to deficient continuity and an absence of dedicated interest, time and resources, a shift in responsibility to regional and local actors but also a severe lack of systemic risk governance (Große et al., Citation2023, Citation2019). Since critical infrastructure risk governance involves sensitive information about systems and protection measures, it must further address the inherent conflict between information sharing and security (Große, Citation2021), which also affects formal risk assessments and risk modelling. Furthermore, the use of data for critical infrastructure risk analysis has not to our knowledge been discussed from the perspective of its users, but rather from the perspective of the data provider, cf. (Johansson, Citation2017).
This paper therefore provides an overview and mapping of needs and use of data related to formal risk analysis, including activities of risk assessments and risk modelling as a part of preventive work against major accidents and crises. The aim is to contribute to a greater understanding of the type of data that is actually used in published sources where different risk assessment or risk analysis methods are applied. The study focuses specifically on the presentation of applications of quantitative or semi-quantitative risk analysis in the scientific literature within the domain of societally important services and critical infrastructures. Typically, these applications are methods that relate to the allocation of funds for risk and crisis management in society or the choice of strategies for risk reduction, or methods that enable future planning in which risk and vulnerability are considered. The purpose of the study is to shed light on the data needs of these applications, and to what extent existing databases have been used to meet the needs when formal methods are applied.
As a basis for investigating data needs, this study maps the methods and the computer support that have been applied in the scientific literature over the timeframe 2010-2020, as well as the type of data these applications required. We delimit the study to systems analysis applications for quantitative or semi-quantitative risk analysis, meaning that the method applied must be formally defined and thus programmable, for example a calculation model, or process qualitative statements or data with a programmable algorithm in order to evaluate risk, vulnerability or risk-reducing measures and ultimately constitutes decision support.
The paper is structured as follows. This introduction section is followed by an extended background consisting of a description of the points of departure within societal risk analysis and critical infrastructures in particular, and an introduction to current ambitions within the area of disaster risk reduction. The method section describes the approach for collecting and analyse literature which is followed by a section that presents detailed results together with an analysis. The paper is finalised with a discussion section that highlights areas in need of further development and research, summarised in concluding remarks at the end.
2. Extended background
Applications of quantitative or semi-quantitative risk analysis in the area of societally important services and critical infrastructures are of particular interest in this paper. Typically, these applications demonstrate methods that are intended to support the choice of strategies for risk reduction or methods that enable assessments of vulnerability or allocation of funds for risk and crisis management in society. According to the Swedish Civil Contingencies Agency (MSB), vital societal functions can be defined as ‘a [societal] function of such importance that a loss of or a severe disturbance in the function would entail a great risk or danger to the life and health of the population, the functionality of the society or the fundamental values of the society’ (MSB, Citation2011). This definition would mean that activities that are needed to deal with an ongoing social disturbance would count as a vital societal function.
Further, critical infrastructure can be defined according to ‘a physical structure whose functionality contributes to ensuring the maintenance of important societal functions’ (MSB, Citation2011). Adopting a shift in perspective for vital societal functions from that of defining them from the perspective of the loss incurred from a disturbance, to the perspective of them ensuring societal functions then leads to another, recently developed, official definition which reads as ‘activities, services or infrastructure that maintain or ensure societal functions that are necessary for society’s basic needs, values or security’ (MSB, Citation2011). This view poses an additional challenge for public crisis managers and policy makers, who can no longer only focus on managing direct risks (e.g. a flood or forest fire), but must also prepare for and deal with situations that potentially escalate and lead to some form of verbal or physical violence (secondary risk), cf., e.g. (Cummings et al., Citation2021). The ability to handle singular or unique events is commonly associated with the concept of resilience (Kendra and Wachtendorf, Citation2003). Resilience also denotes the ability of a society or a system to maintain vital societal functions, i.e. critical infrastructure when it has been subjected to shock (Rose, Citation2007).
In addition, the UN Envoy for Disaster Risk Reduction emphasises the importance of a ‘shared responsibility’ and the principle of ‘universal involvement and partnership’ in dealing with future risks and crises, including global challenges such as climate change, disinformation campaigns and supply chain disruptions. In the Global Transmission Framework, the first of the four priorities aims to achieve a good understanding of disaster risks. Important activities are thus collecting data and enabling such understanding to be available in risk reduction work (UNISDR, Citation2015). However, the quality of such understanding is strongly dependent on the regularity of a corresponding phenomenon. In the case of high complexity and the associated uncertainty and dynamics, the human capacity for imagination and improvisation is therefore often superior to artificial intelligence, which fuels the desire for a fusion of humans and machines in the concept of collective intelligence, cf. (Peeters et al., Citation2021). At the same time, people often experience paralysis and inability to act in the context of complex and extensive tasks with uncertain outcomes, in which waiting for new information also represents a possible risk management strategy (Bernstein, Citation1998; Steel, Citation2007). Such a complexity paralysis must therefore be given appropriate consideration in the development of collective intelligence and shared decision-making processes.
The follow-up of the Sendai framework’s seven target areas states that all countries should collect data and report indicators of the consequences of events that have occurred and particular measures that have been taken (UNDRR, 2019). The idea is that the collected data can form the basis for assessing possible future consequences of accidents or other events and thereby improve risk management, society’s resilience and crisis preparedness. The UN Global Assessment Report specifies these indicators and data that are relevant for assessing the performance of seven target areas (UNDRR, 2019: 211- 212). However, the report admits that the implementation is at such an early stage that it is not possible to evaluate the value of the indicators for achieving a reduced global disaster risk level. The same report therefore emphasises the importance of open data to both enable the development of advanced methods, models and analyses and improve the quality and transparency of public decision-making processes. A number of properties associated with ‘FAIR’ open data are further described, such as that data can be found, accessible, interoperable, and reusable (Wilkinson et al., Citation2016). To report disaster loss data (target areas 1-4), the Sendai framework refers to the DesInventar Sendai database (see ). Target areas 5, 6, and 7 concern national and regional risk reduction strategies (to be implemented by 2020), international collaborations and access to early warning systems, and risk information and analysis for the general public (by 2030). These objectives involve qualitative assessments, annual statistical reports and a complex set of data on effective national systems (UNISDR, Citation2017).
2.1. Risk analysis
A common definition of the classic approach to quantitative risk analysis is that risk is a function of a several variables, which typically represent concepts such as frequencies of initiating events and conditional probabilities for different consequences given the event, together with quantitative assessments of the severity of these consequences. This view on quantitative risk is advocated by, e.g. the Society for Risk Analysis (SRA) and in established literature in the field (Aven, Citation2012; Kaplan and Garrick, Citation1981). A semi-quantitative model refers to models that that do not directly require or operate with strictly numerical input data but can, for example, be models that operate with ordinal data such as rank orderings of consequences or simply categorical input or output. Vulnerability is then commonly defined as the ‘risk given that the initial event occurs’. For example, a flood could be an initiating event leading to uncertain consequences with varying severity. If the frequency of this flood event increases, so does the risk, if the frequency decreases, the risk decreases, but the vulnerability would persist as long as the consequences of the flood have the same probabilities and severity. Resilience, defined as the ability of a society to absorb its vulnerability and return to the capacity or performance it had before the event and its consequences (Hosseini et al., Citation2016b) is thus tightly connected to vulnerability and we therefore include works that focus on one or more of these societal risk concepts of risk, vulnerability, and resilience.
3. Method and materials
The overall point of departure of this study concerns the data needs and the use of data in formal societal risk analysis. In particular, the study examines data needs and usage when applying computer-based methods to support assessments of risk, vulnerability or resilience and, thereby, providing a decision base for risk management activities in the context of critical infrastructure. The literature review therefore focuses on peer reviewed papers that explicitly deal with applications of method(s) within a context and each paper is examined from the following three category dimensions:
The application domain and the context in which quantitative or semi-quantitative risk analysis is applied.
The formal properties and logical foundation of the method applied.
The data and type of computer support used.
With application we mean a description of the context in which a specific model has been applied and a demonstration of how the model is applied in the said context. This means that papers that only deal with and account for a mathematical or computer science model and discuss its logical basis and properties but lack a foreseen problem domain with the context of risk analysis for critical infrastructure protection are not part of the study. The following sections concretise the study’s approach to the collection and analysis of the body of scientific literature.
3.1. Data collection and sample
The collection of papers was selected through a controlled filtering approach using the SCOPUS database and narrowing the search terms to reach a manageable but significant number of papers. outlines the collection process with search terms, hits and further delimitation in order to reach a final set of 183 papers to be included in the survey.
Table 1. Search terms and selection when searching for literature in SCOPUS.
The refinement was done in a four-step process; 1) Examination of title and keywords, 2) Summary review of abstract and content, 3) Identification of the paper’s focus and scope, and 4) Elaborated review of the content.
On closer inspection of the resulting body of literature, it appeared that it contained 14 unavailable papers, a smaller number of book chapters and a literature review. These publications were excluded. In addition, about 40 papers were judged not to have content that met the above stated inclusion requirements. These items were also removed from the selection. Instead, a similar number of papers were included, which met the inclusion requirements but missed some of the final keywords. The selection process finally resulted in a sample of 170 scientific papers that have been published by a total of about 600 authors in 83 different scientific journals ( shows the most frequently occurring journals).
Table 2. Most frequent sources represented in the sample.
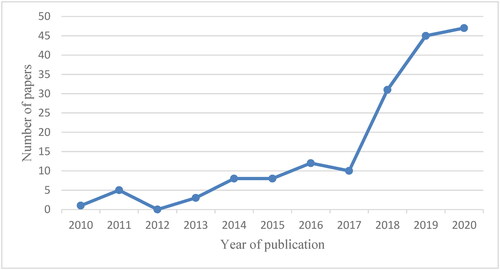
From , a trend of an increasing number of publications in the area during the investigated decade can be identified. The increased pace of publication in this research area indicates a growing interest in computer supported assessments of risk, vulnerability or resilience in connection with vital societal activities, critical infrastructure and strategic decision support.
Figure 1. Number of publications per year.
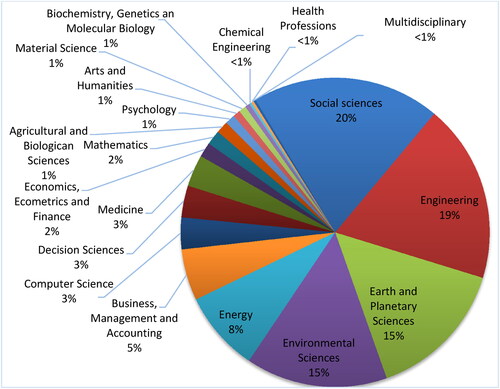
depicts the research areas in which the selected papers have been published. Social science and engineering research have the greatest number of papers, followed by research that focuses on environmental aspects, geographical and geological constellations and energy issues. It is noteworthy that only one of the papers is classified as multi- or interdisciplinary, which can be interpreted as that there are difficulties in establishing such research environments and projects, for example regarding the choice of approach, research design and publication channels.
Figure 2. Research areas represented in the sample.
3.2. Analysis of the sample
Research designs that use qualitative, semi-qualitative or mixed-method approaches are useful to expand understanding and to enrich insights (Johnson et al., Citation2007). The review of the selected literature therefore applied a qualitative content analysis that assists with analysing and interpreting texts to find patterns in their content. The analysis followed an iterative process. First, the key words from the literature search directed the initial reading of titles and abstracts. The second step was to analyse the collected material. As previously mentioned, three perspectives guided the analysis of the collected papers, these perspectives formed the analytical framework in .
Table 3. Analytical framework.
After gaining an initial understanding of the papers, categorising and coding was performed. In particular, the analysis concentrated on the questions of the framework in , which guided both the general review of summaries and content and also the more detailed analysis of the content of the papers, to extract the key points provided in the selected papers.
The following section’s structure is based on the described perspectives and issues to provide a comprehensive view of the application areas that are addressed in the literature, the data and computer support in use and the formal models applied. Using selected examples, the section concretises the three perspectives and identify issues in this field of knowledge.
4. Results and analysis
All papers in the sample aim to support risk analysis in the context of critical infrastructure. However, about 50 of the papers do not deal with a specific activity or type of infrastructure, but rather use a generic reference to ‘important societal functions’. Otherwise, when specified, areas of application that are more frequently found than others are transport, energy, water, different types of buildings, facilities and industry.
In the transport area, the road network and accessibility highly present application areas which is examined in about 20 papers. Regarding maritime transport, seven papers concentrate on the port functions and one on inland watercourses. Three papers in the sample have the air transport as application domain, and two papers treat railway communication. Another three papers study metro, bus and taxi transport systems and three studies examine risks in the transport area with a more generic approach.
Energy supply is another present area of application, and 13 papers examine different aspects of power supply, e.g. power outages. With respect to water, most papers study different risk aspects of drinking-water supply and wastewater. Two items examine risks associated with flood protection facilities and two others focus on dam safety, which can be related to both energy and water supply and to protecting the population from man-made disasters.
Some of the papers have their main focus on different types of buildings, such as residential buildings or other premises where vital societal activities are conducted. Noteworthy here are a few papers that consider unique kinds of facilities, such as temporary (sheltered) housing, the remains of historic buildings of great cultural value, an urban network of sensors to measure various changes in society to predict events and a system of sirens for crisis communication.
One concern is that only four papers further analyse risks associated with concrete information and communication infrastructure. Furthermore, there are few papers that analyse different types of emergency preparedness infrastructure and health care in connection with major accidents and crises, with a performance perspective such as maintaining a level of productive capacity.
The literature typically addresses natural disasters rather than man-made events, including the consequences of climate change. About 20 of the papers have a narrower focus with respect to the application domain; seven focus on errors in a particular technical system, six treat specific risks created by humans, three study risks in the CBRN (chemical, biological, and radiological and nuclear) context and one each addresses economic, terrorist, fire, and cyber threats.
Due to the search term, the vulnerability and resilience of infrastructure and society are at the heart of the examined literature. The risk and vulnerability analyses of various kinds aim to increase awareness and understanding of different contexts among different target groups, such as decision-makers, emergency preparedness coordinators, city planners and other researchers. For example, around 10% of the papers respectively focus on economic effects, disaster relief and dependencies among socially important activities. The other papers are interested in restoration, reliability and maintenance of infrastructures as well as sustainability aspects. Some pieces focus on instruments for improved preparedness, including technological solutions, policies, and behavioural change. 13 papers out of the sample were selected (see ) to further exemplify and concretise the insights of this study.
Table 4. Overview of the selection of papers for detailed analysis.
4.1 Examples of applications
Paper II examines how drinking water was deployed and distributed during crisis management in connection with a storm in a regional area in Virginia, USA. The purpose of the study was to demonstrate the importance of information and communication processes to evaluate regional risk and capability and to emphasise the need for a simultaneous evaluation of response and preparedness. The authors express that there is uncertainty regarding the specific building construction and the user’s areas of responsibility for each facility and that there is a lack of information about specific sections of the population, such as undocumented immigrants and stranded tourists. The study used a number of different data, for example, different data on water facilities from a database maintained by the FEMA (Federal Emergency Management wstorms, maps from the US Army Corps of Engineers, digital elevation maps, and population statistics. Further data sources that were mentioned are previous studies on modelling human behaviour during a storm as well as other public reports. The GIS-based modelling and simulation of regional losses in connection with natural disasters is aimed in particular at regional decision-makers, decision support developer and other researchers. (Crowther, Citation2010)
Paper IX concentrates on a road network of highways and other major roads in a coastal region of Florida, USA. The study aimed to explore an accessibility-based prioritisation method to identify and prioritise critical transport infrastructure. As many other studies, this one also ignores specifying the data need, focusing instead on how and what data was used throughout the study. The paper also highlighted many different data sources, such as road data and destination data from Florida DOT (Department of Transportation) models, which in turn are based on data from the Florida Transportation Survey and regional and local urban planning organisations. In addition, population statistics from the Florida Bureau of Economic and Business Research, light detection and altitude data from the National Oceanic and Atmospheric Administration (NOAA) and the Coastal Service Centre were used, as well as various estimates that other studies have produced. Through the creation of an accessibility index for critical road sections, the study is aimed at local decision-makers and other researchers. (Lu et al., Citation2015)
Paper X constructs a hypothetical area located in northern Finland, more specifically in the border town of Haparanda-Tornio and the surrounding area. In addition, a weather scenario was constructed around extreme winter conditions based on expert opinions. The study’s purpose was to investigate potential systemic consequences of a prolonged power outage during an ongoing winter storm. The study used national register data, the Finnish Population Information System that contains basic information about all buildings and inhabitants, and territorial maps and map information. In addition, a number of satellite-based weather monitoring systems were used, such as the Defense Meteorological Satellite Program (DMSP) Operational Linescan System and the Visible Infrared Imaging Radiometer Suite (VIIRS) on the National Polar-orbiting Operational Environmental Satellite System Preparatory Project (NPP). (Molarius et al., Citation2015)
4.2. Formal properties
The five most commonly applied methods for decision support are presented below. Noteworthy, these methods are not mutually exclusive, and combinations of methods are not uncommon, especially regarding the use of simulation in combination with another method.Footnote1 Further, the generic properties of the methods applied, including their assumptions and limitations, are not discussed significantly in the sample of papers. One explanation for this may be that these properties are discussed in other, more theoretical forums than in applied work.
4.2.1. Simulation (27 papers)
The use of simulation occurs in various forms but is in this context a common method for simulation of consequences of events, consequences that then can be subject to evaluation both in terms of likelihood and severity. The most common type of simulation is Monte-Carlo simulation, where events occur randomly, but also simulation of physical phenomena such as water flows (hydrological simulation) and social phenomena such as traffic flows and a population behaviour (agent-based modelling) occur. The data needs for simulation approaches is linked to parameter estimation in order to configure it to reflect a ‘real’ event, and/or to validate that the result is reasonable. See, e.g. Evans & Olson (Citation1998) for reference literature.
Examples from the sample include Paper XI where Monte-Carlo simulation is used model uncertainty in the consequences of power outages and thereby indirectly assess a region’s resilience regarding the loss of critical infrastructure in the event of a power outage. The data needs in this application are covered by regional register data concerning the location and size of critical infrastructures in combination with expert statements. Another example is Paper VII where system dynamics is used together with optimization to identify effective strategies for removing debris after a hurricane. The data needs are covered by information from Hazus-MH, where different types of hurricanes located in a given region estimate the amount of debris that must be taken care of.
4.2.2. Decision analysis and multi-criteria analysis (19 papers)
Based on a practical approach to so-called normative decision theory and models for rational choices. Requires preference statements from stakeholders or decision makers in combination with quantitative or semi-quantitative measures of the severity of consequences and their probabilities. Usually aims to rank order alternative solutions for risk reduction or reduced vulnerability and is often considered a necessity when there are conflicts of interest or conflicts of interest regarding which solution is preferred. In several cases, models from multi-criterion analysis are also applied to construct an index for resilience or vulnerability given a particular threat such as extreme precipitation, floods or explosions.
Data needs are connected assessing the severity of consequences, often via indicators, and probabilities of the consequences, as well as preference information in the form of criteria weights when goal conflicts exist, e.g. between cost and risk reduction. The explicit involvement of preferences or ideal states distinguishes this method family from the others, see, e.g. Eisenführ et al. (Citation2010) for reference literature.
An example of application in the material is found in Paper I where alternative evacuation strategies in the event of a discharge of hazardous waste with uncertain consequences are studied with the help of multi-criteria analysis. The data needs, in addition to preference statements from experts and decision-makers, are covered by register data in the form of population registers, company registers and registers of known critical infrastructure within the geographical area being studied. Another example is the construction of a resilience index using the decision analysis approach is reported in Paper XIII where multi-criteria decision analysis is used to evaluate resilience to extreme precipitation where a multicriteria method is used to aggregate nine different indicators which are partitioned into indicators for the transport system, indicators for water diversion capacity, and social indicators such as income distribution and demographics. The data needs in this work are covered via register data for the population.
4.2.3. Optimization (16 papers)
Optimization aims to find a configuration of ‘decision variables’ so that they create maximum benefit (such as resilience) or minimum loss (such as risk) according to a mathematically formulated objective function given constraints (cost budget and other conditions). The problem can also be formulated as creating maximum revenue or minimum cost given that levels of risk must not be exceeded. If different aspects require different objective functions, we have multi-objective optimization. Optimization requires a choice of indicators that define benefit and loss, as well as a generally well-defined mathematical model of the system to be optimized. The data need is connected to configuring a generic optimization model for a specific case, often a city or other physical location that the analysis considers so that the constraints are adequate. In cases where the relationship between the configuration of decision variables and the value of the objective function is not deterministic (certain), we have stochastic optimization where probabilities for scenarios that affect the relationship between decision variables and the objective function need to be estimated. See, e.g. Badiru and Thomas (Citation2009) for reference literature.
Examples from the sample include Paper V where resource allocation of security resources is optimized given vulnerability and budget constraints. The data needs are covered by event logs in combination with expert statements for these events.
4.2.4. Input-output models (6 papers)
An input-output model is an economic system model that formally describes dependencies between entities such as households, industries, and infrastructure in a defined area (such as a local region or a nation) where resource flows between these entities are modelled in order to maintain a production that corresponds to demand. The method can be used to study quantitative effects in an area caused by the sudden inability of one or more entities to produce as a result of a natural disaster and the system’s ability to recover. Data needs are connected to identify entities or infrastructures as well as to assess the event’s impact on the infrastructure. See, e.g. Lopez et al. (Citation2012) for reference literature. An example from the sample is Paper IV where the recovery in a region given a natural disaster is studied. The region is modelled as a system of critical infrastructure, with dependencies between critical infrastructures. Data needs are covered by historical hurricane data from US NOAA.
4.3. Computer support
From the sample, the following four categories of computer support/software was identified:
Generic modelling environment (GE), 119 papers. This is software that is not directly targeted for a particular domain or use case but rather provides the user with the opportunity to freely create models that are suitable for the user’s purposes. This is the most common category in the sample, which is not that surprising as scholars often have training in these environments and can thus create a model adapted to their purposes. The most common software of this kind is ArcGIS (17 papers). Other typical computer aids that fall into this category are statistics programs such as R and SPSS, modelling environments such as Matlab (11) and simulation environments such as Netlogo.
Targeted off the shelf product (SP), 19 papers. This is self-executable software that is beyond the prototype stage and developed for a specific purpose and can be acquired off the shelf. The software can be a commercial product but can also be maintained by a major authority to regions or states. Examples are primarily American FEMA’s tool family Hazus-MH which is the most advanced targeted software support for risk and vulnerability analysis having special modules for earthquakes, hurricanes, floods and tsunamis. Hazus-MH, however, requires ArcGIS, but with that comes GIS information for all US states. Another example is CRISECON, which is a web-based computer support for estimating costs for damages as a result of major accidents and evaluating the effectiveness of preventive measures.
Computational library (CL), 8 papers. This is software that is not executable on its own but requires another software that in turn utilizes the functions and calculation methods that the library provides. The library is typically intended to perform a certain type of calculation, such as optimization or simulation. An example is a library for being able to perform calculations in the statistical environment R using the AI model Bayesian network and the optimization solver CPLEX which is used together with the modelling environment GAMS.
Targeted finished prototype (P), 6 papers. This is independently executable software that is developed for a specific purpose, such as a specific domain or user group, but the software is in the prototype stage and is not available as a commercial product. This category is the least common in the sample, and an example is REDIViz, which values resilience to disasters and major accidents in a city broken down at the neighbourhood level.
In general, the most common type of computer support is some form of geographic information system (24 papers). This can be attributed to that an application involves a delimitation to a defined geographical area such as a city or region (135 papers had a local or regional focus). Further, it is worth mentioning that the computer support itself is not in focus in the sample of papers but is rather presented very briefly, which means that the relationship between specific computer support and data needs cannot be analysed.
4.3.1. Data needs and data in use
About half of the papers use various types of public data and open statistics, for example from municipal, regional or national databases or openly accessible websites. Typical examples are census data, historical and forecast weather data, seismic data, emission data, transport statistics, OpenStreetMap and GIS data.
About 20 papers use a variety of data sources to supplement data needs that cannot be met from public data sources. Examples of such supplementary data sources are specific and national risk maps, non-public register data, crime statistics, global index models, network models, statistics from operators of socially important activities, GPS data and surveys, terrain models, satellite images and documentation of previous societal disturbances.
About one-fifth of the papers in the sample concentrate on case studies that either collect their own data in a specific research context, often at the local level, or use data from previous studies, partly archived in databases provided and developed by research institutes. Some of these data sources are more explicitly mentioned:
The location of warning sirens in Dublin, Ohio (Lei et al., Citation2014)
Very serious/major accidents in the energy sector since the 1970s around the world (Spada and Burgherr, Citation2020)
95 seismic events and ‘shakemaps’ from Palermo, Italy (D’Alessandro et al., Citation2019)
30-bus and 118-bus test cases of an electricity distribution network (Choi and Song, Citation2020)
Supply-use (Input/output) tables (Galbusera and Giannopoulos, Citation2018)
Information about specific areas in which several studies have been carried out, e.g. ‘Eco-Industrial Park Kalundborg’ (Kuznetsova et al., Citation2017)
Popular case studies, e.g. Sioux Fall and Berlin Friedrichshain (Starita & Scaparra Citation2021)
Results from a previous development program in Bangladesh that contains data on the population, the footprints of buildings, the road network and areas with limited access as well as water bodies (Uddin and Warnitchai, Citation2020).
Noteworthy is that a quarter of the papers use expert statements as data for the purpose of making risk analysis. For example, these papers use workshops, surveys and interviews to assess experiences from past societal disruptions, develop weather scenarios or analyse conditions in critical production environments such as concentrated sulfuric acid production facilities (Hosseini et al., Citation2016a).
One tenth of the papers do not use data in the sense of quantitative or semi-quantitative data for risk modelling and analysis at all, but base the analyses on expert perceptions, descriptions of previous societal disturbances or more theoretical expositions. A few papers use fictional scenarios for modelling and simulation of disturbances and disasters (e.g. Jefferson and Johannes, Citation2016). Others perform role-playing games to investigate human behaviour under extreme weather conditions (Mahdavian et al., Citation2020) or develop computational models (Chou and Ongkowijoyo, Citation2019; Scheele et al., Citation2020).
Data from satellite monitoring is also present in research on social disturbances and natural disasters, and six papers from the sample discuss the use of this type of data. In addition to data from other sources. Hizbaron et al. (Citation2018) use satellite images to explore the terrain around the Kelud volcano. Satellite terrain images and GPS tracking were also used in the field study by Mossoux et al. (Citation2019) to simulate lava flows. To detect power outages in more remote areas, Molarius et al. (Citation2015) use night images but calls for better resolution of the images to enable analysis at the local level. The study by Papathoma-Koehle et al. (Citation2016) use satellite image-based surface temperature measurements to investigate the risk of heat waves in Romania. A few studies use satellite data mainly as a complement to GlS data, socio-economic statistics and topographic databases (Alizadeh et al., Citation2018; Kong et al., Citation2019). In addition, air surveillance images are used to triangulate cartographic data (Kameshwar et al., Citation2019; Ogie et al., Citation2017) and laser scanning from the air to assess terrain conditions and landslides (Schlögl et al., Citation2019).
Noteworthy are also studies with less conventional data sources. An example is Roy et al. (Citation2019) which uses Twitter data in connection with the storm Sandy, and the earthquake on Bohol (Philippines) to investigate mobility during extreme weather events. Another example is the study by Mendona et al. (Citation2019), which applies a historical perspective on societal resilience by using data from a survey on community impacts following the 1755 earthquake in in Lisbon just after the event itself. A third example is a physical experiment by Williams et al. (Citation2019) in which, based on experience from previous volcanic eruptions in New Zealand, basalt rocks from a specific area were shot using a wind cannon onto roof tiles to investigate the effect of volcanic ash and other eruptive material on buildings. A fourth example considers critical infrastructure that constitutes a unique cultural value and is thus relevant - not only to the surrounding community - to both contribute to a cultural identity and also as a prerequisite for the development of the tourism industry in the area. More specifically, Revez et al. (Citation2021) examine how weather events affect the ruins of Troy and how a cost-effective protection of such cultural-historical value can be achieved. However, certain types of data may be problematic to collect when considering data protection regulations in force. For example, the study by Zhu et al. (Citation2020) used RFID (Radio Frequency Identification) traffic data from vehicles moving in traffic in China. The problem lies in the fact that all vehicles are required to use RFID technology to enable central traffic monitoring.
The Sendai framework for disaster risk reduction has been mentioned in only three of the papers in the sample (Revez et al. Citation2021; Tomaszewski et al., Citation2020; Zorn et al. Citation2020). The surveys use open public data and other data sets from Germany, Nicaragua, New Zealand, as well as a case study of the cultural heritage of Roman ruins in Troia (Portugal). It is pointed out that access to data and information is a common problem. The reason for this lack is that data can be found at a variety of actors, such as local authorities, infrastructure owners, operators and service providers. This indicates that a great need lies in establishing an overview of where and how data is available, and that data is provided in form and quality that enables further use in future studies as well.
4.3.2. Data Sources
Most of the examined data sources offer some form of open access to data, although access to details may be regulated or associated with a login or cost. However, analysing each database in with a more extensive wealth of detail is not in the forefront of this study. Such an analysis could however also evaluate whether and to what extent data and databases meet the specifications set out in UNISDR (Citation2017).
Most of the reviewed papers describe the collection and analysis of data. However, the focus is more on the actual use and development of the methodological approach, so the data and data sources that were used are not always specified in detail. Data collections can vary from an extensive data collection from a range of different sources including databases to smaller datasets, or local data collection and classified material.
We delimit the reporting on the most frequently occurring databases and data sources that may be relevant for quantitative or semi-quantitative risk analysis in the area of critical infrastructure. in the appendix section shows the data sources used in the sample. In addition to data sources, various attributes are also indicated; for example, whether it is a global, national, regional or local data source, open data, aerial and satellite data, register data, GIS and spatial data, historical events, climate and weather data or other specific content.
5. Discussion and implications
It can be said that all studies need to relate to data in some way, either by choosing or adapting a suitable method to the type of data that a researcher can access or collect from different sources. The data collection then includes both raw data from databases, registry data, documents, previous studies and self-conducted measurements and surveys. In addition, already processed data, so-called secondary data, and estimates or estimated data are also used to fill gaps in access to or quality of data. Many authors expressed that there is a lack of data for specific analyses, that the level of detail is inappropriate, that data is incomplete and difficult to find and that they are not available or even collected due to confidentiality issues regarding vulnerabilities in society and critical infrastructure protection.
In the case of data related to major accidents and disasters, it seems that data describing the events and consequences of historical events have a great value in applications of formal systems analysis methods. However, databases such as the UN DesInventar that log ‘events’ in terms of start date, end date, type of event, which region or city was affected, and the actions performed by authorities are, in themselves, not particularly valuable for the papers included in this study.
If a database is to be a valuable source for applications of formal risk analysis or systems analysis to investigate societal risk, vulnerability and resilience with regard to critical infrastructure in the event of major accidents and natural disasters, we can see that the applications typically search for data as a basis for constructing possible scenarios or consequences. These scenarios are typically defined from three main dimensions: the geographical area its geospatial topology, the socio-economy of this area and the infrastructure in this area. Data then includes GIS data that can describe the geographical area that is affected by an event including information on geospatial topology (such as slope, water collection potential), properties and infrastructure in this area (such as houses, roads and business activities and their functions) and socio-economic data for this area (such as demographics, income and the capabilities of the population). The general premise of a typical sample is that these three dimensions provide three ‘groups’ of data that represent the state of a region. A systems analysis method should then provide insight into how that condition is affected by an external event, and in some cases also evaluate how much that condition is negatively affected to enable decision-makers to prioritise between measures that reduce risk and vulnerability. illustrates the relationship between the three main dimensions for the development of risk analysis scenarios and data sources. The three dimensions lead to corresponding groups of data sources that are necessary for scenario modelling in a typical paper from the sample, where a scenario involves how an accident affects these three dimensions.
Figure 3. Three main dimensions of data sources for scenario modelling.
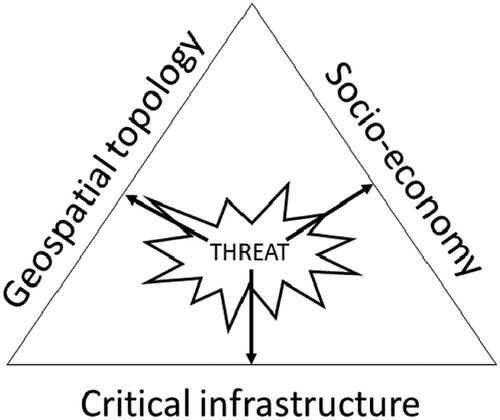
A data set satisfying the framework in is not completely gathered from one and the same database in any of the papers of the sample. Hence, it seems that no databases are available to researchers with an explicit purpose to support the type of analysis carried out in societal risk analysis applications. This lack is not highlighted as a particular problem by the authors in the sample. However, they do not systematically carry out their analyses as an ongoing business activity, but rather demonstrate an application on one occasion. Nevertheless, for a more systematic use of the methods applied in the sample, data collection will be very resource intensive if there is little knowledge of how the three data dimensions are represented as data and where it may be available. What matters though is not that the data is collected in one single database, but that it is maintained, and that researchers and public analysts are aware of its existence and able to use it in a controlled manner. In the investigated context, basically the same data quality properties apply as in other contexts where data forms the basis for decision-making, whether or not analyses are run on it; that the data is available, sufficient (for a purpose that should be clarified), accurate and available over time (Große, Citation2021).
Concerning the target group and recipients of the applications studied in the sample, we find that a large majority have a local or regional focus, and in cases where recipients are mentioned in practice, risk and vulnerability analysts in local or regional planning are singled out as the typical beneficiaries. This implies that risk and vulnerability analysts at municipal and regional levels should have access to data. An interesting follow-up question for further research is then with what means and tools these beneficiaries should do their work. In addition to the fact that the data itself is now spread across several databases, the computer support for analysis is in most cases models created in a general modelling or programming environment. This requires that users have the skills or access to competence that can handle such environments, that they possess relatively advanced knowledge in modelling for quantitative risk analysis combined with knowledge of the operation of geographical information systems. An alternative is to promote a standard set of ready-made tools of the SP type as defined in this report, which seems to be a path that FEMA has taken. To increase the competence in general modelling, one way forward is a more developed cooperation with universities that have teaching teams that possess this type of knowledge, in combination with being inspired by FEMA’s online courses in Hazus-MH.
6. Concluding remarks
We have by means of a literature survey investigated the data needs and data sources used for applying systems analysis methods for critical infrastructure risk analysis. The survey was delimited to peer reviewed research papers between the years 2010 and 2020 and resulted in a total number of 183 papers subject for evaluation. The results provide insight into the type of data that is used, missing or difficult to obtain for an application of the identified methods. The data needs that may arise from developments of advanced methods and models, and the direction in which research in method development is translated into concrete applications. In general, in order to obtain a comprehensive critical infrastructure risk analysis data needs are related to three different data dimensions; geospatial topology data, socio-economic data, and infrastructure data and collecting the data for the purpose of utilising systems analysis is resource intensive which is a barrier for a more systematic use of the methods and support tools in focus in this paper.
This study reveals that collected data on risk events and consequences are often case-specific, fragmented and widely distributed, if available at all. This lack of accessible, useful data challenges risk analysts in providing valuable decision support for the strategic and operative management. Further research could depart from the specifications in UNISDR (Citation2017) and set out to specify the objectives in decision-making on critical infrastructures. This could in turn help with clarifying the type and quality of data that needs to be collected at local, regional, national and international levels.
The ownership and responsibilities for development, operation and maintenance of data sources is widely distributed among state-controlled companies, public authorities, private businesses and individuals, which necessitate co-ordination, interorganisational collaboration and dedicated information sharing to improve critical infrastructure risk assessments. Thus, further research could address the lack of a deeper understanding of the policy-making processes and the conditions that enable successful and inclusive data management for enabling collective intelligence initiatives.
Another branch of research could address the competency issue with regard to advanced computer-based risk analysis in underpinning public risk governance and crisis management. For example, research could pursue the question how advanced risk analysis could be applicable in municipalities and public agencies to assist decision-makers in governance networks with visualising and recognising the systemic effects of risk mitigation strategies.
Disclosure statement
No potential conflict of interest was reported by the author(s).
Additional information
Funding
Notes
1 Applying more than one systems analytics model to study a domain is commonly referred to as integrated modeling.
26 http://datadryad.org/resource/doi:10.5061/dryad.8835 and https://datadryad.org//resource/doi:10.5061/dryad.15fv2
30 http://www.qolpro.org/qolother1.html and https://getinthepicture.org/resource/report-national-targets-and-baseline-data-new-zealand
References
- Alizadeh, M., I. Ngah, M. Hashim, B. Pradhan, and A. B. Pour. 2018. “A Hybrid Analytic Network Process and Artificial Neural Network (ANP-ANN) Model for Urban Earthquake Vulnerability Assessment.” Remote Sensing 10 (6): 975. doi:10.3390/rs10060975.
- Aven, T. 2012. Foundations of Risk Analysis. Chichester: Wiley.
- Badiru, A. B., and M. U. Thomas. 2009. Handbook of Military Industrial Engineering. Boca Raton: Taylor & Francis.
- Bernstein, P. 1998. Against the Gods: The Remarkable Story of Risk. New York: Wiley.
- Choi, E., and J. Song. 2020. “Cost-Effective Retrofits of Power Grids Based on Critical Cascading Failure Scenarios Identified by Multi-Group Non-Dominated Sorting Genetic Algorithm.” International Journal of Disaster Risk Reduction 49: 101640. doi:10.1016/j.ijdrr.2020.101640.
- Chou, J.-S, and C. S. Ongkowijoyo. 2019. “Hybrid Decision-Making Method for Assessing Interdependence and Priority of Critical Infrastructure.” International Journal of Disaster Risk Reduction 39: 101134. doi:10.1016/j.ijdrr.2019.101134.
- Comes, T., N. Wijngaards, and B. Van de Walle. 2015. “Exploring the Future: Runtime Scenario Selection for Complex and Time-Bound Decisions.” Technological Forecasting and Social Change 97: 29–46. doi:10.1016/j.techfore.2014.03.009.
- Crowther, K. G. 2010. “Risk-Informed Assessment of Regional Preparedness: A Case Study of Emergency Potable Water for Hurricane Response in Southeast Virginia.” International Journal of Critical Infrastructure Protection 3 (2): 83–98. doi:10.1016/j.ijcip.2010.03.001.
- Cummings, C. L., S. Rosenthal, and W. Y. Kong. 2021. “Secondary Risk Theory: Validation of a Novel Model of Protection Motivation.” Risk Analysis 41 (1): 204–220. doi:10.1111/risa.13573.
- D’Alessandro, A., A. Costanzo, C. Ladina, F. Buongiorno, M. Cattaneo, S. Falcone, C. La Piana, et al. 2019. “Urban Seismic Networks, Structural Health and Cultural Heritage Monitoring. The National Earthquakes Observatory (INGV, Italy) Experience.” Frontiers in Built Environment 5. doi:10.3389/tbuil.2019.00127.
- Eisenführ, F., M. Weber, and T. Langer. 2010. Rational Decision Making. Heidelberg: Springer.
- Evans, J. R., and D. L. Olson. 1998. Introduction to Simulation and Risk Analysis. Upper Saddle River, NJ: Prentice Hall.
- Fluixá-Sanmartín, J., A. Morales-Torres, I. Escuder-Bueno, and J. Paredes-Arquiola. 2019. “Quantification of Climate Change Impact on Dam Failure Risk under Hydrological Scenarios: A Case Study from a Spanish Dam.” Natural Hazards and Earth System Sciences 19 (10): 2117–2139. doi:10.5194/nhess-19-2117-2019.
- Jefferson, T. L., and T. W. Johannes. 2016. “Using Geographic Information Systems to Support Decision Making in Disaster Response.” Intelligent Decision Technologies 10 (2): 193–207. doi:10.3233/IDT-160255.
- Galbusera, L., and G. Giannopoulos. 2018. “On Input-Output Economic Models in Disaster Impact Assessment.” International Journal of Disaster Risk Reduction 30: 186–198. doi:10.1016/j.ijdrr.2018.04.030.
- Große, C. 2021. “Enhanced Information Management in Inter-Organisational Planning for Critical Infrastructure Protection: Case and Framework.” In Proceedings of the 7th International Conference on Information Systems Security and Privacy (ICISSP). SCITEPRESS, 319–330.
- Große, C., A. Larsson, and O. Björkqvist. 2023. “Information-Flawing Filters in Critical Infrastructure Protection: The Deficient Information Basis in a Swedish Approach.” International Journal of Critical Infrastructures 19 (1): 40–57. doi:10.1504/IJCIS.2023.10038635.
- Große, C., P. M. Olausson, and S. Wallman-Lundåsen. 2021b. “Left in the Dark: Obstacles to Studying and Performing Critical Infrastructure Protection.” Electronic Journal of Business Research Methods 19 (2): 58–70. doi:10.34190/ejbrm.19.2.2509.
- Große, C., P. M. Olausson, and S. Wallmann-Lundåsen. 2019. “Blackout Ahead: Methodological Concerns in Studies of Critical Infrastructure Protection.” In Proceedings of the 29th European Safety and Reliability Conference (ESREL), edited by M. Beer & E. Zio, 1715–1723. Singapore: European Safety and Reliability Association.
- He, X., and E. J. Cha. 2020. “Modeling the Damage and Recovery of Interdependent Civil Infrastructure Network Using Dynamic Integrated Network Model.” Sustainable and Resilient Infrastructure 5 (3): 152–167. doi:10.1080/23789689.2018.1448662.
- Hizbaron, D. R., D. S. Hadmoko, E. T. W. May, S. H. Murti, M. R. T. Laksani, A. F. Tiyansyah, E. Siswanti, and I. E. Tampubolon. 2018. “Towards Measurable Resilience.” Mapping the Vulnerability of at-Risk Community at Kelud Volcano, Indonesia. Applied Geography 97: 212– 227.
- Hosseini, S., A. Al Khaled, and Md Sarder. 2016a. “A General Framework for Assessing System Resilience Using Bayesian Networks. A Case Study of Sulfuric Acid Manufacturer.” Journal of Manufacturing Systems 41: 211–227. doi:10.1016/j.jmsy.2016.09.006.
- Hosseini, S., K. Barker, and J. E. Ramirez-Marquez. 2016b. “A Review of Definitions and Measures of System Resilience.” Reliability Engineering & System Safety 145 (12): 47–61. doi:10.1016/j.ress.2015.08.006.
- Huff, J., H. Medal, and K. Griendling. 2019. “A Model-Based Systems Engineering Approach to Critical Infrastructure Vulnerability Assessment and Decision Analysis.” Systems Engineering 22 (2): 114–133. doi:10.1002/sys.21460.
- Johansson, M. 2017. “Experience of Data Collection in Support of the Assessment of Global Progress in the Sendai Framework for Disaster Risk Reduction 2015–2030 – a Swedish Pilot Study.” International Journal of Disaster Risk Reduction 24: 144–150. doi:10.1016/j.ijdrr.2017.06.008.
- Johnson, R. B., A. J. Onwuegbuzie, and L. A. Turner. 2007. “Toward a Definition of Mixed Methods Research.” Journal of Mixed Methods Research 2: 112–133.
- Kameshwar, S., D. T. Cox, A. R. Barbosa, K. Farokhnia, H. Park, M. S. Alam, and J. W. van de Lindt. 2019. “Probabilistic Decision-Support Framework for Community Resilience. Incorporating Multi-Hazards, Infrastructure Interdependencies, and Resilience Goals in a Bayesian Network.” Reliability Engineering & System Safety 191: 106568. doi:10.1016/j.ress.2019.106568.
- Kaplan, S., and B. J. Garrick. 1981. “On the Quantitative Definition of Risk.” Risk Analysis 1 (1): 11–27. doi:10.1111/j.1539-6924.1981.tb01350.x.
- Kendra, J. M., and T. Wachtendorf. 2003. “Elements of Resilience after the World Trade Center Disaster: Reconstituting New York City’s Emergency Operations Centre.” Disasters 27 (1): 37–53. doi:10.1111/1467-7717.00218.
- Kim, J., A. Deshmukh, and M. Hastak. 2018. “A Framework for Assessing the Resilience of a Disaster Debris Management System.” International Journal of Disaster Risk Reduction 28: 674–687. doi:10.1016/j.ijdrr.2018.01.028.
- Kong, J., S. P. Simonovic, and C. Zhang. 2019. “Sequential Hazards Resilience of Interdependent Infrastructure System: A Case Study of Greater Toronto Area Energy Infrastructure System.” Risk Analysis 39 (5): 1141–1168. doi:10.1111/risa.13222.
- Kuznetsova, E., R. Louhichi, E. Zio, and R. Farel. 2017. “Input-Output Inoperability Model for the Risk Analysis of Eco-Industrial Parks.” Journal of Cleaner Production 164: 779–792. doi:10.1016/j.jclepro.2017.06.250.
- Lei, T. L., D. Tong, and R. L. Church. 2014. “Designing Robust Coverage Systems. A Maximum Covering Model with Geographically Varying Failure Probabilities.” Annals of the Association of American Geographers 104 (5): 922–938. doi:10.1080/00045608.2014.923722.
- Lopez, J., Setola, R., Wolthusen, S. (Eds.) 2012. Critical Infrastructure Protection. Information Infrastructure Models, Analysis, and Defense (Lecture Notes in Computer Science). Berlin Heidelberg: Springer.
- Lu, Q.-C., Z.-R. Peng, and J. Zhang. 2015. “Identification and Prioritization of Critical Transportation Infrastructure: Case Study of Coastal Flooding.” Journal of Transportation Engineering 141 (3). doi:10.1061/(ASCE)TE.1943-5436.0000743.
- Mahdavian, F., S. Platt, M. Wiens, M. Klein, and F. Schultmann. 2020. “Communication Blackouts in Power Outages.” Findings from Scenario Exercises in Germany and France. International Journal of Disaster Risk Reduction 46
- Mendona, D., I. Amorim, and M. Kagohara. 2019. “An Historical Perspective on Community Resilience. The Case of the 1755 Lisbon Earthquake.” International Journal of Disaster Risk Reduction 34: 363–374.
- Molarius, R., P. Tuomaala, K. Piira, M. Räikkönen, C. Aubrecht, M. Polese, G. Zuccaro, K. Pilli-Sihvola, and K. Rannat. 2015. “A Framework for Comprehensive Impact Assessment in the Case of an Extreme Winter Scenario, considering Integrative Aspects of Systemic Vulnerability and Resilience.” Computer Modeling in Engineering and Sciences 109 (2): 131–158.
- Mossoux, S., M. Kervyn, and F. Canters. 2019. “Assessing the Impact of Road Segment Obstruction on Accessibility of Critical Services in Case of a Hazard.” Natural Hazards and Earth System Sciences 19 (6): 1251–1263. doi:10.5194/nhess-19-1251-2019.
- Münzberg, T., M. Wiens, and F. Schultmann. 2017. “A Spatial-Temporal Vulnerability Assessment to Support the Building of Community Resilience against Power Outage Impacts.” Technological Forecasting and Social Change 121: 99–118. doi:10.1016/j.techfore.2016.11.027.
- MSB (Swedish Civil Contingencies Agency). 2011. Skydd av samhällsviktig verksamhet. DNr 2010-4547. Swedish Emergency Management Agency. https://www.msb.se/Upload/Om%20MSB/Organisation_uppdrag/Nationell%20strategi%20f%C3%B6r%20skydd%20av%20samh%C3%A4llsviktig%20verksamhet.pdf.
- Ogie, R. I., S. Dunn, T. Holderness, and E. Turpin. 2017. “Assessing the Vulnerability of Pumping Stations to Trash Blockage in Coastal Mega-Cities of Developing Nations.” Sustainable Cities and Society 28: 53–66. doi:10.1016/j.scs.2016.08.022.
- Papathoma-Koehle, M., C. Promper, R. Bojariu, R. Cica, A. Sik, K. Perge, P. László, et al. 2016. “A Common Methodology for Risk Assessment and Mapping for South-East Europe. An Application for Heat Wave Risk in Romania.” Natural Hazards 82 (S1): 89–109. doi:10.1007/s11069-016-2291-3.
- Peeters, M. M. M., van Diggelen, J. van den Bosch, K. Bronkhorst, A. Neerincx, M. A. Schraagen, J. M, and Raaijmakers, S. 2021. “Hybrid Collective Intelligence in a Human–AI Society.” AI & SOCIETY 36 (1): 217–238. doi:10.1007/s00146-020-01005-y.
- Revez, M. J., P. Coghi, J. D. Rodrigues, and I. Vaz Pinto. 2021. “Analyzing the Cost-Effectiveness of Heritage Conservation Interventions. A Methodological Proposal within Project STORM.” International Journal of Architectural Heritage 15 (7): 985–999. doi:10.1080/15583058.2019.1665141.
- Rose, A. 2007. “Economic Resilience to Natural and Man-Made Disasters: Multidisciplinary Origins and Contextual Dimensions.” Environmental Hazards 7 (4): 383–398. doi:10.1016/j.envhaz.2007.10.001.
- Roy, K. C., M. Cebrian, and S. Hasan. 2019. “Quantifying Human Mobility Resilience to Extreme Events Using Geo-Located Social Media Data.” EPJ Data Science 8 (1) doi:10.1140/epjds/s13688-019-0196-6.
- Scheele, F., T. Wilson, E. M. Lane, K. Crowley, M. W. Hughes, T. Davies, N. Horspool, et al. 2020. “Modeling Residential Habitability and Human Displacement for Tsunami Scenarios in Christchurch, New Zealand.” International Journal of Disaster Risk Reduction 43: 101403. doi:10.1016/j.ijdrr.2019.101403.
- Schlögl, M., G. Richter, M. Avian, T. Thaler, G. Heiss, G. Lenz, and S. Fuchs. 2019. “On the Nexus between Landslide Susceptibility and Transport Infrastructure – An Agent-Based Approach.” Natural Hazards and Earth System Sciences 19 (1): 201–219. doi:10.5194/nhess-19-201-2019.
- Spada, M., and P. Burgherr. 2020. “Comparative Risk Assessment for Fossil Energy Chains Using Bayesian Model Averaging.” Energies 13 (2): 295. doi:10.3390/en13020295.
- Starita, S., and M. P. Scaparra. 2021. “Assessing Road Network Vulnerability. A User Equilibrium Interdiction Model.” Journal of the Operational Research Society 72 (7): 1648–1663. doi:10.1080/01605682.2020.1740621.
- Steel, P. 2007. “The Nature of Procrastination: A Meta-Analytic and Theoretical Review of Quintessential Self-Regulatory Failure.” Psychological Bulletin 133 (1): 65–94. doi:10.1037/0033-2909.133.1.65.
- Tomaszewski, B. M., E. A. Moore, K. Parnell, A. M. Leader, W. R. Armington, O. Aponte, L. Brooks, et al. 2020. “Developing a Geographic Information Capacity (GIC) Profile for Disaster Risk Management under United Nations Framework Commitments.” International Journal of Disaster Risk Reduction 47: 101638. doi:10.1016/j.ijdrr.2020.101638.
- Uddin, M. S., and P. Warnitchai. 2020. “Decision Support for Infrastructure Planning. A Comprehensive Location-Allocation Model for Fire Station in Complex Urban System.” Natural Hazards 102 (3): 1475–1496. doi:10.1007/s11069-020-03981-2.
- United Nations Office for Disaster Risk Reduction (UNISDR). 2015. Sendai Framework for Disaster Risk Reduction 2015–2030. Geneva, Switzerland.
- United Nations Office for Disaster Risk Reduction (UNISDR). 2017. Technical Guidance for Monitoring and Reporting on Progress in Achieving the Global Targets of the Sendai Framework for Disaster Risk Reduction. Collection of Technical Notes on Data and Methodology.
- United Nations Office for Disaster Risk Reduction (UNDDR). 2019. Global Assessment Report on Disaster Risk Reduction. Geneva, Switzerland.
- Williams, G. T., B. M. Kennedy, D. Lallemant, T. M. Wilson, N. Allen, A. Scott, and S. F. Jenkins. 2019. “Tephra Cushioning of Ballistic Impacts. Quantifying Building Vulnerability through Pneumatic Cannon Experiments and Multiple Fragility Curve Fitting Approaches.” Journal of Volcanology and Geothermal Research 388: 106711. doi:10.1016/j.jvolgeores.2019.106711.
- Wilkinson, M., M. Dumontier, I. Aalbersberg, et al. 2016. “The FAIR Guiding Principles for Scientific Data Management and Stewardship.” Scientific Data 3: 160018. doi:10.1038/sdata.2016.18.
- Yang, Y., S. T. Ng, S. Zhou, F. J. Xu, D. Li, and H. Li. 2020. “A Federated Pre-Event Community Resilience Approach for Assessing Physical and Social Sub-Systems: An Extreme Rainfall Case in Hong Kong.” Sustainable Cities and Society 52: 101859. doi:10.1016/j.scs.2019.101859.
- Zhu, C., J. Wu, M. Liu, J. Luan, T. Li, and K. Hu. 2020. “Cyber-Physical Resilience Modeling and Assessment of Urban Roadway System Interrupted by Rainfall.” Reliability Engineering & System Safety 204: 107095. doi:10.1016/j.ress.2020.107095.
- Zorn, C., R. Pant, S. Thacker, and A. Y. Shamseldin. 2020. “Evaluating the Magnitude and Spatial Extent of Disruptions across Interdependent National Infrastructure Networks.” ASCE-ASME Journal of Risk and Uncertainty in Engineering Systems, Part B: Mechanical Engineering 6 (2)
Appendix
Table A1. Data sources used in sample.