
ABSTRACT
This paper studies the factors that drive distribution structure design (DSD), which includes the spatial layout of distribution channels and location choice of logistics facilities. We build on a generic framework from existing literature, which we validate and elaborate using interviews among industry practitioners. Empirical evidence was collected from 18 logistics experts and 33 decision-makers affiliated to shippers and logistics service providers from the fashion, consumer electronics and online retail sectors. It turns out that interviewees share similar rankings of main factors across industries, and even confirm factor weights from earlier research established using multi-criteria decision analysis, which would indicate that the framework is sector-neutral at the highest level. The importance attached to subfactors varies between sectors according to our expectations. We were able to identify 20 possible new influencing subfactors. The results may support managers in their decision-making process, and regional policy-makers with regard to spatial planning and regional marketing. The framework is a basis for researchers to help improve further quantitative DSD support models.
1. Introduction
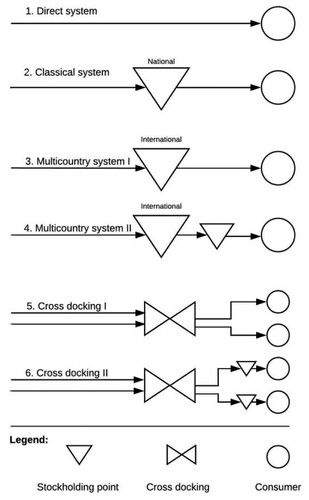
Physical distribution involves the movement and storage of goods in a supply chain and is a major determinant of customer service levels and supply chain costs (Chopra Citation2003). Organising physical distribution is challenging, however, as customers expect high service levels at low costs. Globalisation and supply chain fragmentation make the distribution of goods more complex, as it takes place over ever longer distances, while passing through more and more stages in the supply chain (Rodrigue Citation2008). One of the strategic decisions companies have to make to satisfy these demands involves distribution structure design (DSD), which concerns the spatial layout of the distribution channel – i.e. the freight transport and storage system between production and consumption – as well as the location(s) of logistics facilities, i.e. warehouses and distribution centres (DCs). presents several possible distribution channel layouts. The answer to the question as to which distribution channel layout is best depends on different factors. Centralised layouts (Layouts 1, 2 and 3) will allow savings in inventory costs, which is important to high value products like consumer electronics. The drawback of a central layout is that outbound transport costs are relatively high. A decentralised layout (Layouts 4 and 6) will favour high demand products for which outbound transport costs reduction is critical, e.g. groceries and office supplies. Advantages of a decentralised layout are low outbound transport costs and short delivery times, at the cost of additional inventory, warehousing and inbound transport costs. Companies may also implement hybrid distribution structures – combining centralised and decentralised layouts for several streams of products – in an attempt to achieve gains in several areas simultaneously (van Hoek, Commandeur, and Vos Citation1998).
Figure 1. Distribution channel layouts (based on Kuipers and Eenhuizen Citation2004, adapted).
There are many factors that influence decision-making on DSD. However, despite the frequent treatment of DSD in supply chain handbooks, an empirically validated conceptual framework of factors is still lacking in the scientific literature. Most traditional distribution structure design models are prescriptive and few studies include empirical data (Mangiaracina, Song, and Perego Citation2015; Olhager, Pashaei, and Sternberg Citation2015). A few works that propose conceptual frameworks are Lovell, Saw, and Stimson (Citation2005), Song and Sun (Citation2017) and Onstein, Tavasszy, and van Damme (Citation2019a, Citation2019b). However, these studies either examine a broader set of different decisions at a higher level or do not offer any empirical validation. Lovell, Saw, and Stimson (Citation2005) investigate the broader topic of supply chain fragmentation, while Song and Sun (Citation2017) focus on broader supply chain decision-making, i.e. a range of decisions including sourcing, production and distribution locations, without looking at either of them specifically. Onstein, Tavasszy, and van Damme (Citation2019a, Citation2019b) propose a generic DSD framework based on literature and measure the importance of factors, respectively, without differentiating between industry sectors, nor was the framework they proposed validated with practitioners or practical industry cases. Other studies on distribution centre location selection include Warffemius (Citation2007), McKinnon (Citation2009), Dablanc and Ross (Citation2012), Verhetsel et al. (Citation2015) and Heitz et al. (Citation2018). These studies do not aim to consider the full scope of DSD factors, and/or include only a partial empirical analysis. In short, DSD-related factors have so far received insufficient attention in scientific literature, in particular due to a lack of systematic, empirical validation.
In order to contribute to filling this gap, we set out to validate the framework proposed by Onstein, Tavasszy, and van Damme (Citation2019a) by conducting industry interviews and a subsequent analysis. We interviewed 51 respondents: 18 logistics experts, and 33 DSD decision-makers affiliated to shippers and LSPs in three sectors, i.e. fashion, consumer electronics and online retail. We focused on companies with DCs located in the Netherlands, which is a major node and a continental gateway for around 30% of goods imported into the EU (Holland International Distribution Council Citation2018). The analysis provides new insights into the empirical validity of existing frameworks and supports their quantitative analysis as well as adding new factors. Researchers can use the framework to improve quantitative DSD models, which are often still based on incorrect or incomplete sets of factors (Mangiaracina, Song, and Perego Citation2015). The framework can also be of use for practitioners in government and industry. It may support companies – especially from the three selected industry sectors – to include the relevant factors when creating their DSD. As far as policy-makers and spatial planners are concerned, the framework is relevant to understanding how regional plans could attract logistics activities from industry.
The remainder of the paper is organised as follows. Section 2 reviews the relevant literature and explains the generic, literature-based conceptual framework. Section 3 describes the research methods and data collection, while Section 4 discusses the case results, which have been used to develop the validated conceptual framework. The conclusions, limitations and implications of the research and suggestions for future work are presented in Section 5.
2. Literature review
In this section, we briefly discuss the literature based framework for DSD as developed in Onstein, Tavasszy, and van Damme (Citation2019a), which is the starting point for our research. Distribution structure design (DSD) includes DC location selection as well as distribution channel layout – i.e. the freight transport and storage system between production and consumption. Factors that explain DSD can be found in studies related to those two decisions, but also to broader supply chain design problems, like supply chain strategy, production location selection, capacity allocation, performance measurement and outsourcing (Song and Sun Citation2017). Studies related to DSD can relate to quantitative as well as qualitative research. Quantitative research can be found using multicriteria analysis (Ashayeri and Rongen Citation1997; Önden, Acar, and Eldemir Citation2016), multicriteria decision-making (Agrebi, Abed, and Omri Citation2017; Onstein et al. Citation2019b), statistical analysis (McKinnon Citation1984; Hilmola and Lorentz Citation2011), factor analysis (Song and Sun Citation2017), discrete choice analysis (Nozick and Turnquist Citation2001; Verhetsel et al. Citation2015), spatial modelling (Heitz and Beziat Citation2016; Klauenberg, Elsner, and Knischewski Citation2016) and other quantitative models (e.g. Cooper Citation1984; Ashayeri and Rongen Citation1997; Olhager, Pashaei, and Sternberg Citation2015). Qualitative research includes literature reviews (Meixell and Gargeya Citation2005; Chopra and Meindl Citation2013; Mangiaracina, Song, and Perego Citation2015; Olhager, Pashaei, and Sternberg Citation2015; Onstein, Tavasszy, and van Damme Citation2019a), interviews (Picard Citation1982; Klauenberg, Elsner, and Knischewski Citation2016) and case studies (Nozick and Turnquist Citation2001; Lovell, Saw, and Stimson Citation2005; Pedersen, Zachariassen, and Arlbjørn Citation2012). The list presented above is limited to those studies that aim to identify and explain factors in relation to DSD; the many studies that only use factors from other sources are not included. Reviewing existing literature shows there is no study that proposes a framework of factors influencing DSD at the industry level. Lovell, Saw, and Stimson (Citation2005), Song and Sun (Citation2017) and Onstein et al. (Citation2019a, Citation2019b) are the only authors that propose relevant frameworks, but they have a much wider scope. Lovell, Saw, and Stimson (Citation2005) focus on the broader concept of supply chain fragmentation and Song and Sun (Citation2017) focus on a broad range of supply chain decisions including sourcing, production and DC locations, while Onstein, Tavasszy, and van Damme (Citation2019a) do not differentiate between industry sectors, but propose a generic literature-based DSD framework. We used their framework to continue the empirical exploration of the factors discussed in this paper.
The framework includes 47 factors, classified into seven main groups: service level, logistics costs, business strategy, demand pattern, product characteristics, location factors and institutional factors. The factors are based on two main research disciplines, i.e. Supply Chain Management and (Economic) Geography. As known from the literature, the main trade-off influencing DSD is the one between service level factors and logistics costs (Chopra Citation2003; Christopher Citation2011). The others are the contextual factors that influence this trade-off:
Business strategy and company characteristics, including size and management capacity;
Demand factors, related to volume, frequency and regularity of products sold;
Product characteristics that are cost or service drivers, e.g. value density and package density;
Location factors related to local facilities, accessibility and labour market;
Institutional factors related to legal and fiscal regulations.
The main factors and subfactors are explained in more detail below.
2.1. Service level factors
Service level factors are among the most important factors influencing DSD (Onstein et al. Citation2019b). They include supplier lead-time, delivery time, delivery reliability, responsiveness, returnability, and order visibility. Service level requirements vary per industry sector. High value pharmaceutical industries require higher distribution service levels compared to low value fashion industries. The delivery time (from DC to the customer) is influenced by the product type, i.e. customers do not accept long delivery times for substitutable products. In general, all companies aim for short delivery times, which is possible by storing sufficient inventories close to consumer markets or by using a centralised distribution layout combined with high-speed transport modes. High delivery reliability is important to companies that ship high-value goods (Christopher Citation2011). Responsiveness (i.e. reaction speed and flexibility to fulfil customer demand) can be increased by using a decentralised distribution layout, i.e. making sure products are available at all logistics facilities. Returnability (i.e. the ease of returning products) increases when there are more logistics facilities available to return products (Chopra Citation2003). Online retail customers expect they can easily return their goods (Xing et al. Citation2011).
2.2. Logistics costs factors
Logistics costs are – together with service level factors – the most important factors in DSD selection (Nozick and Turnquist Citation2001; Chopra Citation2003). Existing literature stresses three important logistics cost-related factors: transport costs, warehousing costs and inventory costs. Transport costs consist of the transport mode, labour costs and capital costs. Inventory costs include capital costs, insurances and management costs, and risk costs (damage, deterioration, obsolescence). Transport costs are divided into inbound transport (from production to DC) and outbound transport (from DC to the customer). Warehousing costs consist of labour costs, storage costs and handling materials (Christopher Citation2011). High outbound transport costs drive companies towards decentralised distribution, because outbound transport costs are reduced if the number of DCs increases. High inventory and warehousing costs, on the other hand, drive companies towards centralised distribution, since inventories and warehousing activities increase with the number of distribution centres (McKinnon Citation2009).
2.3. Business strategy and company characteristics
Business strategy is a company characteristic that affects DSD (Treacy and Wiersema Citation1993). Three renowned business strategies are customer intimacy, operational excellence and product leadership. Customer intimacy focuses on delivering high distribution service levels, which can be offered by applying a broad network of DCs near customer markets. Operational excellence focuses on competitive prices and low-cost distribution, for example by minimising the number of warehouses, while product leadership focuses on flexible operations that enable new product introductions (Treacy and Wiersema Citation1993).
The position of the DC within the supply chain (before or after production) is another influencing factor. In case of weight loss during production, a supplier DC is preferably located near the production location, to reduce inbound transport costs (McCann Citation2015). The factor ‘retail store ownership’ may persuade a company to locate logistics facilities within the centre of gravity of the retail stores, to reduce outbound transport costs. The size of the company also influences DSD. Small and medium-sized enterprises (SMEs) have less management or financial capacity and can therefore adjust their DSD less often (Pedersen, Zachariassen, and Arlbjørn Citation2012).
2.4. Demand factors
Demand factors influencing DSD are demand level, demand dispersion and demand volatility. Demand level affects the number of DCs needed to distribute products. In case of high demand, more facilities are needed to distribute products on time (Chopra Citation2003; Mangiaracina, Song, and Perego Citation2015). In case of geographically dispersed demand, it is advantageous to centralise distribution, because demand may fluctuate across regions. Demand volatility can influence a company to select a centralised distribution layout to prevent oversupplies (Friedrich, Tavasszy, and Davydenko Citation2014).
2.5. Product characteristics
Product characteristics influencing DSD are product value density, package density and perishability (Onstein et al. Citation2019b). High value density products involve high inventory costs, influencing companies to select a centralised distribution layout (Ashayeri and Rongen Citation1997; Lovell, Saw, and Stimson Citation2005). Companies that ship high-value products are more sensitive to location decisions than companies shipping low-value products (McCann and Sheppard Citation2003). Package density influences warehousing costs. High package density products that require rigorous product handling influence companies to centralise warehouse operations, because that reduces warehousing complexity and warehousing costs. Perishable products require short delivery times, causing companies to select a decentralised distribution layout (McKinnon Citation1984; Lovell, Saw, and Stimson Citation2005; Christopher Citation2011).
2.6. Location factors
There are many location-related factors that influence DSD. Accessibility by road and possibly other modes of transport is essential. As the size of warehouses increases, land availability becomes a more important factor in selecting the location of DCs (Heitz and Beziat Citation2016). Proximity to airports and seaports can be important as well – air transport, for example, is often used for high value goods and spare parts (Warffemius Citation2007; Hall and Jacobs Citation2012; Verhetsel et al. Citation2015). Proximity of the DC location to a rail freight terminal is relatively unimportant, as goods are less often transported to and from DCs by rail (Bowen Citation2008). The factor ‘proximity to consumer markets’ is very important, because this enables fast customer deliveries (Heitz, Launay, and Beziat Citation2019). According to previous research by Onstein et al. (Citation2019b), proximity to suppliers or production locations is less important. The growth in average warehouse floor space motivates companies to locate logistics facilities in peripheral areas where land prices are lower (Dablanc and Ross Citation2012). Other advantages of peripheral locations include the lower costs of living and less congestion. The availability of warehouse employees is a key factor. Warehouse employees are easier to find in urban agglomerations than they are in peripheral areas, although labour scarcity in urban agglomerations can also be a push factor (agglomeration diseconomy) in locating logistics facilities outside those areas (Verhetsel et al. Citation2015; Heitz and Beziat Citation2016).
2.7. Institutional factors
Institutions like rules, laws, values and norms (North Citation1990) also influence DSD. Beneficial tax rules reduce inventory costs, which encourage companies to locate DCs in Free Trade Zones. Fast customs procedures also attract companies, because they enable them to reduce delivery times. Zoning rules can restrict the localisation of logistics activities (Sheffi Citation2012). Investment incentives and the presence of a development company are found to have a moderate effect on DSD (Davydenko Citation2015; Onstein et al. Citation2019b). In their distribution structure design, companies do value countries with high political stability (Onstein, Tavasszy, and van Damme Citation2019a).
Two limitations of the framework outlined above are the following: (1) because the framework does not distinguish between sectors of industry, it may not contain sufficient detail to indicate differences in preferences between sectors; (2) the framework itself still has little grounding in empirical research – despite the mention of factors in the literature, it has not yet been confronted with practitioners’ experience as a framework purpose-built for DSD. The aim of our empirical research is to help remedy that state of affairs; the next section describes the approach we adopted, including the cases we studied.
3. Research approach
3.1. Research method
An interview-based, qualitative, multiple case research design is applied to validate the important factors at a sectoral level and, in doing so, validate the general conceptual framework. The advantage of case research including interviews lies in the possibility to study factors at the level of individual companies or sectors, with an understanding of the case-specific context (Voss, Tsikriktsis, and Frohlich Citation2002; Frankel, Naslund, and Bolumole Citation2005; Bryman Citation2008; Yin Citation2014). Case research can be divided into three modes: theory generation, theory elaboration, and theory testing (Ketokivi and Choi Citation2014). Our goal is to validate the existing general conceptual framework i.e. examine its applicability to specific sectors, and identify opportunities to elaborate the framework.
3.1.1. Case selection
We selected three sectors (fashion, consumer electronics, and online retail) to test the framework in different industry contexts (Eisenhardt and Graebner Citation2007). The sectors were selected based on their contrasting product characteristics and distribution channel layout (see ). We contacted shippers or Logistics Service Providers (LSPs) with DCs located in different regions of the Netherlands. To increase cross-case comparability, the selected shippers and LSPs are all large companies that mainly focus on international customer markets for well-known brands. Companies were assigned to a sector based on their most important product in terms of annual turnover – most of the companies we interviewed only sell products from one industry sector. Online retail companies included those that only sell products online (‘pure players’). LSPs were interviewed taking in mind one specific sector and a customer (shipper) from this sector. The interviewees were individual decision-makers on DSD, working at shippers or LSPs. The basis for selecting these decision-makers was their active involvement in the decision-making involving DSD, as was also verified during the interviews. Ultimately, 33 decision-makers were selected. As a basis of comparison for these sector-specific interviews and a source for general validation of the framework, we also interviewed 18 general experts in the area of logistics.
Table 1. Characteristics of fashion case interviews.
Table 2. Characteristics of consumer electronics (CE) case interviews.
Table 3. Characteristics of online retail (OR) case interviews.
3.1.2. Data collection, data analysis and framework validation
We conducted semi-structured interviews, as is common in case research (Yin Citation2014), where semi-structured interviews are used to identify the important factors and to collect information on the companies’ DSD. Three test interviews with potential respondents were used to improve and complete the questionnaire. The 33 sectoral respondents included 12, 12 and 9 interviewees from fashion, consumer electronics and online retail, respectively. All 33 were logistics managers or directors of logistics. The 18 logistics experts included 5 academic experts and 13 industry experts.
The interview protocol was designed as follows. The first part focused on the general characteristics of the company, and mainly included fixed response questions designed to simplify the analysis of the cases. The second part aimed at describing the current distribution structure. We asked the respondents to draw a schematic overview of their current structure, including sourcing, production locations, DCs, customer locations and transport between them. The third part, which focused on the influencing factors, included in-depth discussions in which the respondents were asked to explain why factors are important. Factor definitions were included in the questionnaire to obtain comparable interview data. To prevent anchoring bias of the respondents to our framework, we first asked each respondent to list the five most important factors by heart. Next, we presented a list of factors and asked the respondents to reflect on their importance. No interviews were conducted after saturation of the decision-making factors. The interviews were transcribed and filed to create a trail of case evidence. The transcripts were sent to the respondents for corrections and approval and then coded using NVivo software. We grouped answers based on code and case to identify differences and similarities across industry sectors (Voss, Tsikriktsis, and Frohlich Citation2002). The coding protocol was based on the factors included in the generic conceptual framework. Additionally, open coding was applied, to allow us to extract new factors from the interviews. To check the intercoder reliability, 6 of the 51 interviews were double coded by a second independent researcher familiar with the research topic. Diverging codes and case results were discussed within the research team to reach a consensus.
We synthesised the results of the three cases on a within-case and across-case basis. We constructed a chart showing the number of respondents indicting a given factor as being important in DSD (). This also allowed us to conduct the cross-case analysis, including a match with the expert interviews and a statistical analysis of the results. Eventually, based on the comparison between interview results and the generic framework, we adapted the framework, which constitutes one of the main results of the research. We discuss the outcomes in greater detail in Section 4, after describing the industry cases in the next subsection.
3.2. Industry cases
In this subsection, we provide a more detailed description of the three industry cases.
3.2.1. Fashion
Today’s fashion supply chains face multiple logistics challenges according to the interview respondents. Supplier lead times are long (i.e. up to 3 months), which means companies need responsive logistics operations to meet customer demand in time. The large number of fashion seasons also creates logistics challenges, i.e. accurate demand forecasts and responsive distribution are needed to prevent over/undersupplies.
The case interviews included nine well-known fashion shippers and three LSPs. The fashion shippers focus on international customer target markets (). Five of the nine shippers have their own retail stores in European shopping streets. At a European scale, all shippers apply centralised distribution channel layout (i.e. a single DC). In case of intercontinental sales, the companies use overseas regional DCs – often owned by local LSPs – to serve local customer target markets. Marketing channels vary from company to company – i.e. up to 40% online business to consumer (B2C) orders ().
3.2.2. Consumer electronics
Companies that sell consumer electronics products are faced with high inventory costs, because they sell high value density products. Fast air distribution networks are used by the interviewed companies to reduce the number of inventory days, thereby reducing inventory costs. Companies also use fast distribution networks because consumer electronics products have short product life cycles.
The interviews included eight shippers that focus on international consumer markets and four LSPs (). The shippers we interviewed sell their goods via consumer electronics stores (like MediaMarkt), store-in-store or online, but do not have own retail stores, unlike the fashion case. The main inbound transport modes being used are air and sea, while the main outbound transport mode is by road. Due to the high value density of consumer electronics products, inventory cost reduction was found to be the main logistics challenge according to consumer electronics (CE) companies. Four of the eight consumer electronics companies apply a centralised distribution channel layout, while the other four shippers apply a decentralised distribution channel layout (); however, two of the latter apply direct-ship-to-air hub distribution – bypassing a central DC – to reduce inventory costs and improve delivery times (Anonymous). Outsourcing warehousing and distribution (7 of 8 shippers) to LSPs is standard in this sector, as shippers are unable to organise (low volume) high speed distribution for competitive prices in-house.
3.2.3. Online retail
Online retail (OR) companies are retail companies that only sell their products online (‘pure players’). They face high warehousing costs caused by complex warehousing processes. Online retail companies use highly responsive distribution networks, because their customers expect fast deliveries. According to the respondents, major logistics challenges include delivery time reduction, demand peaks and volatile customer demand.
We interviewed eight shippers (retailers) and one LSP, while other OR companies refused to cooperate. The companies we did manage to interview ship a diverse range of products, e.g. furniture, food and flowers (). The main inbound transport modes they use are by sea and air, while the main outbound transport mode is by road. Three OR shippers apply a centralised distribution channel layout, while two other shippers apply a decentralised layout, i.e. they use a central DC to ship parcels and another (often smaller) DC to ship large goods. The remaining three shippers use a decentralised layout to ship perishable products, i.e. food and flowers. Five of the eight shippers outsource outbound transport (from DC to customer) to LSPs who are able to offer extensive distribution networks for competitive prices. Warehousing operations are mostly insourced (i.e. by 7 of the 8 shippers) due to the complexity of warehousing processes – i.e. different from the CE case in which all shippers outsource warehousing operations.
4. Results
The analysis of the interviews is presented below. The first subsection compares the main factors that influence DSD for three sectors. This is followed by the cross-case comparison of the subfactors and the validated conceptual framework.
Based on the case results, we identified several new factors, i.e. keep factors, personal location preferences and LSP influence (, Appendix 1 for the links to the individual interviews). We explain these factors below:
The case results show five ‘keep’ factors that may contribute to the decision whether or not to relocate within the current region. Cost of severance – i.e. costs of firing employees – influenced four fashion companies and five CE companies. Knowledge retention of warehousing employees (see also Christensen and Drejer Citation2005), penalties of ending current lease contracts and links with the historical location are other possible keep factors. Historical links are moderately important to fashion companies; five fashion companies value historical links with the Amsterdam fashion cluster.
Personal location preferences can be a decisive factor for individual companies. The role of personal location preferences has been studied for headquarter locations (Blair and Premus Citation1987); our research confirms that they can also play a role in DC location selection. Three fashion shippers located the DC near the home address of the CEO to reduce commuting times.
When distribution is outsourced, the logistics service provider (LSP) will influence DSD. Shippers may accept a DC location nearer to its transport centre of gravity compared to if the shipper were to make distribution arrangements itself, or accept a larger DC than chosen otherwise, to allow for sales volume fluctuations.
We classified these new factors in our framework as follows. Because keep factors involve the dynamics of change itself, they are of a different nature than the current main factors, which is why we added them as a new main factor. Personal location preferences are classified as subfactors under location factors. LSP influence relates to the organisation of logistics within a company and is therefore included under the main factor ‘Business strategy and company characteristics’. We continued our analysis with this new set of factors.
4.1. Main factors: cross-case comparison
shows the number of respondents that have confirmed a factor as being important for DSD. The table presents the main factors (detailed factor scores can be found in Appendix 1). To arrive at these scores, the number of subfactor mentions for each main factor was added, e.g. logistics costs subfactors together were mentioned 35 times by the fashion sector respondents (A). To correct for splitting bias (Jacobi and Hobbs Citation2007), we corrected for the number of subfactors in each main factor; e.g. logistics costs consists of 4 subfactors, while location consists of 24 subfactors – the scores are therefore divided by 4 and 24, respectively (B). This provides us with comparable information on the ordering of the main factors. C shows a correlations matrix of the scores. The sectoral scores correlate very well, in particular for the respondents from the three industry sectors, which suggests that the framework at the level of main factors is robust for use across sectors. In other words, the factors do not appear to discriminate between these three sectors.
Table 4. Sum of mentions of subfactors per main factor and sector.
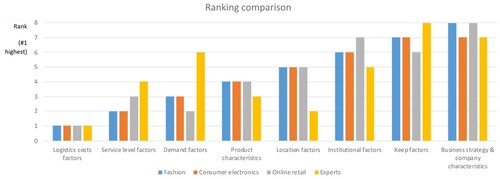
shows a ranking of the main factor scores (#1 highest rank). The decision-makers from each of the industry sectors give almost the same ranking to each of the main factors, i.e. the most important main factors (with highest rank) are logistics costs, service level, demand and product characteristics. It is well-known from literature that logistics costs and service level are the important main factors influencing DSD (Chopra Citation2003; Christopher Citation2011). Our results indicate a broad agreement on the importance of all the main factors across these sectors – although there are important differences between sectors on the importance of the various subfactors, as we will show later. The scores of the expert respondents correlate less well with the sectoral decision-makers than the mutual decision-makers, although correlations are still strong (C). In particular, experts rank location factors and product characteristics higher, and demand and service level lower than any sectoral decision-maker.
Figure 2. Ranking of main factors based on scores corrected for splitting bias.
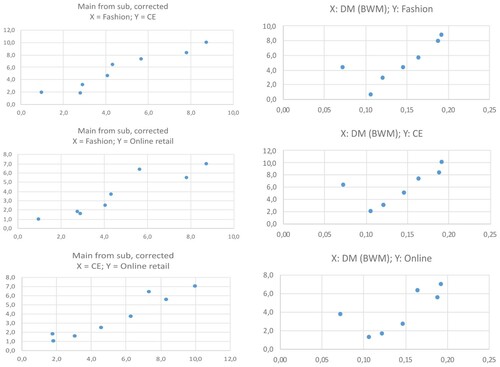
shows scatter plots of the corrected main factor scores. Figure series 3 (left) confirms the correlation between sectors showing the individual factors, including their relative position. We also used this visualisation to examine how our results relate to findings in earlier studies concerning the importance of the main factors. Onstein et al. (Citation2019b) measured the weights of the main factors (i.e. excluding the new factors found in our interviews) using the Best-Worst Method (BWM) from Multi-Criteria Decision Analysis (MCDA). Interestingly, if we compare the scores of the same factors, they correlate very well. The fact that two such different research methods (i.e. interviews versus MCDA for the same primary framework) lead to highly comparable scores is surprising and encouraging, as it confirms the results through triangulation of literature, surveys and interviews. Moreover, it leads to the important conjecture that a low-cost and fast MCDA survey can provide similar results as a time-intensive series of detailed interviews with industry decision-makers. The one main factor that fits relatively less well into the pattern is ‘product characteristics’ (see outliers in Figure series 3 (right)). We can only explain this by pointing to the fact that the interviewees were conscious of a specific product during the interview, while the BWM survey was generic in nature.
Figure 3. Correlations of main factor scores between sectoral decision-makers (left) and between sectoral decision-makers and previous BWM research by Onstein et al. (Citation2019b) (right).
4.2. Subfactors: cross-case comparison
Although decision-makers gave similar rankings to the main factors across industries, there are important differences between industry sectors with regard to the importance of the various subfactors, which we describe below. To arrive at comparable subfactor scores, we corrected for the number of respondents per sector (i.e. 12, 12 and 9 respondents; see Appendix 1). The normalised scores are compared using radar charts for each main factor, with the importance of subfactors indicated between 0 (mentioned by no respondent) and 1 (mentioned by all).
4.2.1. Service level factors
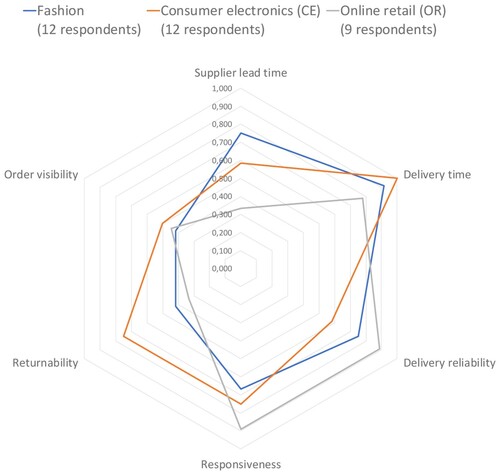
Subfactor ‘supplier lead time’ is most important in the fashion sector (). Supplier lead times are long, i.e. often 3–5 months, according to fashion respondents which is why many fashion shippers use Quick Response production systems to reduce supplier lead times (Şen Citation2008). Supplier lead times are unimportant to the OR respondents, possibly because some of them source nearby (e.g. food, flowers, furniture, see ) and thus already have short supplier lead times. Responsiveness (reaction speed to fulfil demand) is most important to online retail companies (). Online customers show volatile demand patterns, while at the same time expecting short delivery times (Xing et al. Citation2011) – i.e. within one or few days (Interview OR3) – forcing OR companies to maintain highly responsive distribution operations (Interview OR1). The relatively high importance of the subfactor returnability may be explained by the differences between products. A CE product return will have a higher value density compared to a fashion product return, making it important to CE companies to receive their product returns. In the OR case, only OR companies with high return rates confirm the importance of this factor (i.e. OR5, OR8, OR9); those that do not mention this factor, i.e. home furnishing, food and flowers, are also the ones with few returns (OR2, OR6, OR7).
Figure 4. Service level subfactor importance (0 = low, 1 = high).
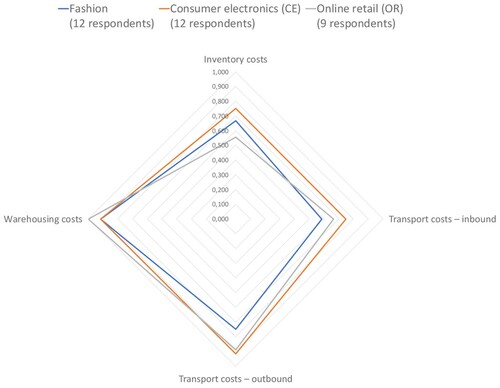
4.2.2. Logistics costs factors
Warehousing costs and outbound transport costs are the most important subfactors in this category (). Outbound transport costs may be considered more important than inbound transport costs, because they often allow fewer advantages of scale (Christopher Citation2011). Products with a lower package density typically show this pattern to a lesser extent, as is shown in the case of the fashion industry. Inventory costs are most important to CE companies, probably because their products have a high value density.
Figure 5. Logistics costs subfactor importance (0 = low, 1 = high).
4.2.3. Business strategy and company characteristics
Overall, business strategy and company characteristics are a relatively unimportant main factor (). The subfactors in this category, however, do vary in terms of their influence. Managerial and financial capacity were the most dominant of all the subfactors, especially within the CE and OR sectors (). As also argued by Pedersen, Zachariassen, and Arlbjørn (Citation2012), sufficient management and financial capacity stimulates DSD implementation.
Table 5. Factors influencing distribution structure design (DSD) according to case interviews.
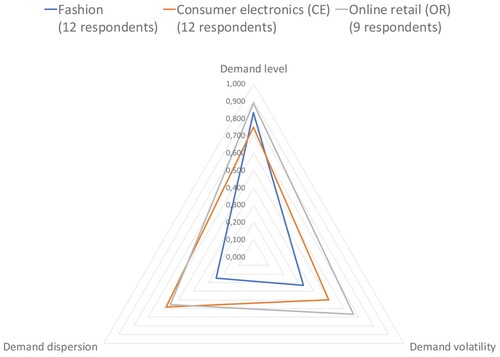
4.2.4. Demand factors
Demand levels are considered to be an important subfactor in this category (). Varying demand volumes and geographies pose a major logistics challenge to companies. Demand volatility is especially important in the OR case. OR companies face volatile demand, because their customers can easily switch between suppliers (Boyer and Hult Citation2005). Six out of nine of the OR companies we interviewed have outsourced outbound distribution to parcel carriers, because they are able to handle volatile goods volumes well (). Demand volatility is relatively unimportant to fashion companies – presumably because their demand levels are relatively stable.
Figure 6. Demand subfactor importance (0 = low, 1 = high).
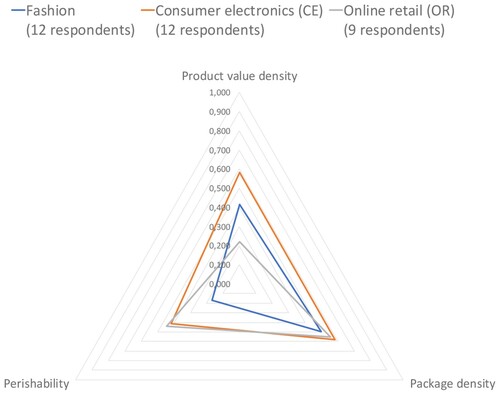
4.2.5. Product characteristics
Within the main factor ‘product characteristics’ (), the scores of the subfactor ‘product value density’ follow the order of the value density of products quite well, with CE products showing the highest scores (Li, Ganesan, and Sivakumar Citation2005). The fact that most CE companies (8 out of 12) use a centralised distribution channel layout may be related to this aspect. The subfactor ‘package density’ is moderately important in all sectors, without much difference between the sectors. Products from all three sectors need to be repackaged from wholesale to retail units. Perishability (i.e. shelf life length) is moderately important in the CE and OR cases, but relatively unimportant in the fashion case – note that perishability here does not refer to products being out of fashion, but relates to shorter term value loss, during distribution. At the individual company level, we found that perishability depended strongly on the product being sold, with OR companies that sell food and flowers reporting high scores (interviews OR4, OR6, OR7). The shippers involved distribute products via local hubs to allow for fast deliveries.
Figure 7. Product characteristics subfactor importance (0 = low, 1 = high).
4.2.6. Location factors
Proximity of the DC to the motorway is relatively important compared to other subfactors in this category (), which is in line with existing literature (e.g. Bowen Citation2008; Dablanc and Ross Citation2012). Proximity of the DC to airports largely follows the value density of products, where pipeline capital costs will be balanced against shipping rates. Especially CE and fashion will be moved across larger distances. CE companies use air as their main inbound transport mode, while fashion companies use air transport for important collection reorders during a fashion season. Proximity to seaports largely follows the same pattern, with CE and fashion product DCs likely to locate relatively nearby. Proximity of the DC to consumer markets is generally known to be an important factor, which is here confirmed for the OR and CE case, although less so for the fashion case. Customer lead times are shorter in the OR and CE sectors (Nguyen, De Leeuw, and Dullaert Citation2018; Li, Ganesan, and Sivakumar Citation2005) compared to the fashion sector, because expected service levels are higher and products tend to be more perishable.
Figure 8. Location subfactor importance (0 = low, 1 = high).
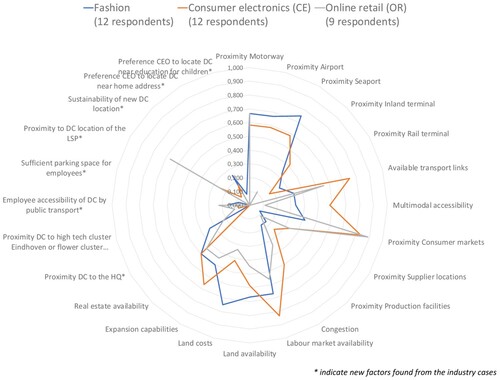
Labour market availability is an important location factor to CE and Fashion companies and moderately important to OR companies. In all three industry sectors, there are respondents who confirm there was labour scarcity in the Netherlands at the time the interviews were conducted. The relatively low importance of labour market availability to OR may be explained by the lower (non-specialized) job skills requirements, or the fact that, in the Netherlands OR, different labour conditions apply compared to conventional retail supply chains.
There are no marked differences between sectors with regard to land availability, except for the fact that OR scores relatively low. Land costs are important to fashion companies, but relatively unimportant to CE and OR companies. Fashion DCs typically serve a larger geographic area, which implies that they have more search opportunities when it comes to securing lower land rents.
Eight possible new location factors were identified based on the case interviews. Accessibility of the DC for employees by public transport could be a new influencing factor according to five respondents (all cases), because companies start to locate DCs further away from urban areas (explained in interview CE1, E12). In the OR case, a new location factor could be proximity of the DC to an LSP hub. Six out of nine OR shippers prefer to locate the DC near their parcel carrier, to reduce delivery times.
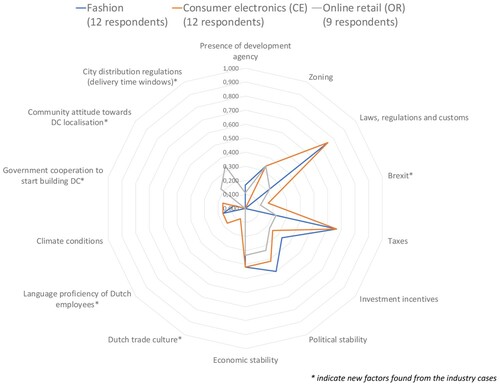
4.2.7. Institutional factors
Overall, the institutional subfactors that have a direct economic impact on investment and operations were the ones mentioned during the interviews (). The patterns of the sectors are quite comparable, although to a lesser extent for OR. Efficient customs procedures are considered important, because they reduce customer delivery times and increase product availability. High taxes are a push factor, while tax advantages (such as VAT deferment) may help persuade companies to locate their DCs in Free Trade Zones (Sheffi Citation2012). The relatively low importance of some institutional factors to OR companies could be caused by their focus on smaller regions for distribution (domestic or sub-continental), where differences between location options are relatively minor.
Figure 9. Institutional subfactor importance (0 = low, 1 = high).
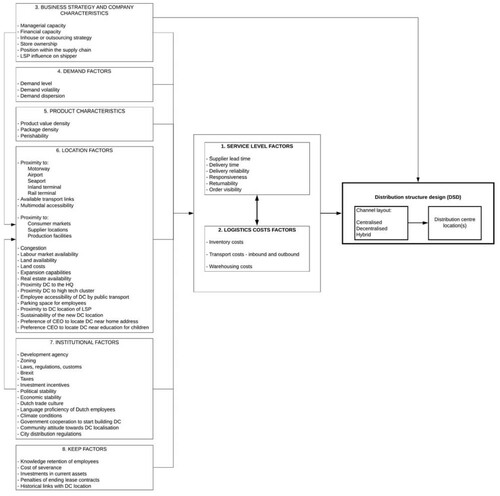
4.3. Conceptual framework
Based on (the relationships between) the factors extracted from the case results, we propose the following validated conceptual framework (). Compared to the initial literature-based framework, the framework includes 20 new subfactors and one new main factor, i.e. the keep factors. The hierarchy of factors presented here can be used by private companies as a starting point for analysis and decision-making. In addition, we expect this to be a useful tool for discussion and analysis in a public policy environment, supporting spatial planning and regional marketing.
Figure 10. Validated conceptual framework.
5. Conclusions and future research
In this study, we analysed the factors that influence distribution structure design (DSD) in three industry sectors, i.e. fashion, consumer electronics (CE) and online retail (OR). Despite the frequent treatment of DSD in supply chain handbooks, the importance of factors influencing DSD in different industry sectors has thus far received little attention and an empirically validated conceptual framework is lacking. To fill these gaps, this research used a multiple case research design to examine DSD in different industry sectors and develop an empirically validated framework. The empirical evidence for the cases was collected during 18 interviews with logistics experts and 33 interviews with decision-makers on DSD, affiliated to shippers and logistics service providers. The result, and a first contribution of this paper, is an empirically validated conceptual framework for DSD.
Statistical analysis of the case interview results shows that decision-makers of the three industry sectors place very similar importance on the main factors. In all three cases, the most important main factors are logistics costs, service level, demand factors and product characteristics – which is in line with SCM literature. These results imply that the validated conceptual framework at the level of main factors is robust for cross-sectoral comparison. However, although decision-makers agree on the importance of the main factors, there are differences when it comes to the importance of the various subfactors at a sectoral level, which can be explained to a large extent from the typical product and organisational attributes of the sectors under examination. Moreover, the interviews lead us to identify new factors, that were previously not included in the literature-based framework. We found 20 new subfactors and one new main factor, i.e. keep factors.
In our analysis we find that the main factor scores of the sectoral decision-makers correlate well with previous survey-based research in which the main factor weights were quantified using the Best-Worst Method (BWM) from Multi-Criteria Decision Analysis (Onstein et al. Citation2019b). This cross-validation of findings is a second main contribution of the paper.
This study contributes to the existing literature by conducting empirical research into DSD at a sectoral level. We analysed the factors that influence DSD in three specific industry sectors, building on an earlier and generic framework from existing literature. The new framework can help companies in their DSD process, and support governments and consultants to carry out regional land use planning in a way that is attractive for selected industries. The framework can also help researchers improve quantitative distribution channel and distribution centre location models, which are often based on incorrect or incomplete sets of factors.
One of the limitations in terms of the scope of this study is that the companies involved focus on the distribution of finished goods (wholesale and retail). Companies that sell semi-finished products (business-to-business) may provide different results when it comes to the importance of subfactors. New research could extend the base of interviews to include sectors that produce semi-finished goods. As our interviews were limited to global supply chains around DCs within the Netherlands, we also recommend broadening the geographic scope of the empirical research.
Acknowledgements
We are grateful to two anonymous reviewers for their constructive comments, which significantly improved the analysis of our results.
Disclosure statement
No potential conflict of interest was reported by the authors.
Additional information
Funding
References
- Agrebi, M., M. Abed, and M. N. Omri. 2017. “ELECTRE I Based Relevance Decision-Makers Feedback to the Location Selection of Distribution Centers.” Journal of Advanced Transportation: 1. doi:https://doi.org/10.1155/2017/7131094.
- Ashayeri, J., and J. M. J. Rongen. 1997. “Central Distribution in Europe: A Multi-Criteria Approach to Location Selection.” The International Journal of Logistics Management 8 (1): 97–109.
- Blair, J. P., and R. Premus. 1987. “Major Factors in Industrial Location: A Review.” Economic Development Quarterly 1 (1): 72–85.
- Bowen, J. 2008. “Moving Places: The Geography of Warehousing in the US.” Journal of Transport Geography 16 (6): 379–387.
- Boyer, K. K., and G. T. M. Hult. 2005. “Customer Behavior in an Online Ordering Application: A Decision Scoring Model.” Decision Sciences 36 (4): 569–598.
- Bryman, A. 2008. Social Research Methods. Oxford: Oxford University Press.
- Chopra, S. 2003. “Designing the Distribution Network in a Supply Chain.” Transportation Research Part E: Logistics and Transportation Review 39 (2): 123–140.
- Chopra, S., and P. Meindl. 2013. Supply Chain Management. Strategy, Planning, and Operations. Harlow, UK: Pierson Education Limited.
- Christensen, J., and I. Drejer. 2005. “The Strategic Importance of Location: Location Decisions and the Effects of Firm Location on Innovation and Knowledge Acquisition.” European Planning Studies 13 (6): 807–814.
- Christopher, M. 2011. Logistics and Supply Chain Management. 4th ed. Harlow, UK: Pierson Education Limited.
- Cooper, M. 1984. “Cost and Delivery Time Implications of Freight Consolidation and Warehousing Strategies.” International Journal of Physical Distribution & Materials Management 14 (6): 47–67.
- Dablanc, L., and C. Ross. 2012. “Atlanta: A Mega Logistics Center in the Piedmont Atlantic Megaregion (PAM).” Journal of Transport Geography 24 (2012): 432–442.
- Davydenko, I. Y. 2015. “Logistics Chains in Freight Transport Modelling.” PhD diss., Delft University of Technology, The Netherlands.
- Eisenhardt, K. M., and M. E. Graebner. 2007. “Theory Building from Cases: Opportunities and Challenges.” Academy of Management Journal 50 (1): 25–32.
- Frankel, R., D. Naslund, and Y. Bolumole. 2005. “The ‘White Space’ of Logistics Research: A Look at the Role of Methods Usage.” Journal of Business Logistics 26 (2): 185–209.
- Friedrich, H., L. A. Tavasszy, and I. Y. Davydenko. 2014. “Distribution Structures.” In Modelling Freight Transport, edited by L. A. Tavasszy, and G. de Jong, 65–88. London: Elsevier.
- Hall, P. V., and W. Jacobs. 2012. “Why are Maritime Ports (Still) Urban, and why Should Policy Makers Care?” Maritime Policy & Management 39 (2): 189–206.
- Heitz, A., and A. Beziat. 2016. “The Parcel Industry in the Spatial Organization of Logistics Activities in the Paris Region: Inherited Spatial Patterns and Innovations in Urban Logistics Systems.” Transportation Research Procedia 12: 812–824.
- Heitz, A., L. Dablanc, J. Olsson, I. Sanchez-Diaz, and J. Woxenius. 2018. “Spatial Patterns of Logistics Facilities in Gothenburg, Sweden.” Journal of Transport Geography. Available Online, doi:https://doi.org/10.1016/j.jtrangeo.2018.03.005.
- Heitz, A., P. Launay, and A. Beziat. 2019. “Heterogeneity of Logistics Facilities: An Issue for a Better Understanding and Planning of the Location of Logistics Facilities.” European Transport Research Review 11 (5): 2019. doi:https://doi.org/10.1186/s12544-018-0341-5.
- Hilmola, O. P., and H. Lorentz. 2011. “Warehousing in Northern Europe: Longitudinal Survey Findings.” Industrial Management & Data Systems 111 (3): 320–340.
- Holland International Distribution Council. 2018. Dutch Logistics Sector. Holland is a key Logistics hub That Connects Global Markets. Zoetermeer: HIDC.
- Jacobi, S. K., and B. F. Hobbs. 2007. “Quantifying and Mitigating the Splitting Bias and Other Value Tree-Induced Weighting Biases.” Decision Analysis 4 (4): 194–210.
- Ketokivi, M., and T. Choi. 2014. “Renaissance of Case Research as a Scientific Method.” Journal of Operations Management 32 (5): 232–240.
- Klauenberg, J., L.-A. Elsner, and C. Knischewski. 2016. “Dynamics in the Spatial Distribution of Hubs in Groupage Networks – the Case of Berlin.” Paper presented at World Conference on Transport Research (WCTR), Shanghai, July 10–15.
- Kuipers, B, and J. Eenhuizen. 2004. “A Framework for the Analysis of Seaport-Based Logistics Parks.” Proceedings of the 1st International Conference on Logistics Strategies for Ports. Dalian, China.
- Li, K. P., V. K. Ganesan, and A. I. Sivakumar. 2005. “Synchronized Scheduling of Assembly and Multi-Destination air-Transportation in a Consumer Electronics Supply Chain.” International Journal of Production Research 43 (13): 2671–2685.
- Lovell, A., R. Saw, and J. Stimson. 2005. “Product Value-Density: Managing Diversity Through Supply Chain Segmentation.” The International Journal of Logistics Management 16 (1): 142–158.
- Mangiaracina, R., G. Song, and A. Perego. 2015. “Distribution Network Design: A Literature Review and a Research Agenda.” International Journal of Physical Distribution & Logistics Management 45 (5): 506–531.
- McCann, P. 2015. Interview, Professor Economic Geography, University of Groningen (RUG), December 4.
- McCann, P., and S. Sheppard. 2003. “The Rise, Fall and Rise Again of Industrial Location Theory.” Regional Studies 37 (6-7): 649–663.
- McKinnon, A. C. 1984. “The Spatial Organization of Physical Distribution in the Food Industry.” PhD Diss., University College London, London.
- McKinnon, A. C. 2009. “The Present and Future Land Requirements of Logistical Activities.” Land Use Policy 26: S293–S301.
- Meixell, M. J., and V. B. Gargeya. 2005. “Global Supply Chain Design: A Literature Review and Critique.” Transportation Research Part E 41 (6): 531–550.
- Nguyen, D. H., S. De Leeuw, and W. E. H. Dullaert. 2018. “Consumer Behaviour and Order Fulfilment in Online Retailing: A Systematic Review.” International Journal of Management Reviews 20 (2): 255–276.
- North, D. C. 1990. Institutions, Institutional Change and Economic Performance. Cambridge, UK: Cambridge University Press.
- Nozick, L. K., and M. A. Turnquist. 2001. “Inventory, Transportation, Service Quality and the Location of Distribution Centers.” European Journal of Operational Research 129 (2): 362–371.
- Olhager, J., S. Pashaei, and H. Sternberg. 2015. “Design of Global Production and Distribution Networks: A Literature Review and Research Agenda.” International Journal of Physical Distribution & Logistics Management 45 (1/2): 138–158.
- Önden, I., A. Z. Acar, and F. Eldemir. 2016. “Evaluation of the Logistics Centre Locations Using a Multi-Criteria Spatial Approach.” Transport 33 (2): 322–334.
- Onstein, A. T. C., M. Ektesaby, J. Rezaei, L. A. Tavasszy, and D. A. van Damme. 2019b. “Importance of Factors Driving Firms’ Decisions on Spatial Distribution Structures.” International Journal of Logistics: Research and Applications, doi:https://doi.org/10.1080/13675567.2019.1574729.
- Onstein, A. T. C., L. A. Tavasszy, and D. A. van Damme. 2019a. “Factors Determining Distribution Structure Decisions in Logistics: A Literature Review and Research Agenda.” Transport Reviews 39 (2): 243–260.
- Pedersen, S. G., F. Zachariassen, and J. S. Arlbjørn. 2012. “Centralisation vs de-Centralisation of Warehousing.” Journal of Small Business and Enterprise Development 19 (2): 352–369.
- Picard, J. 1982. “Typology of Physical Distribution Systems in Multi-National Corporations.” International Journal of Physical Distribution & Materials Management 12 (6): 26–39.
- Rodrigue, J.-P. 2008. “The Thruport Concept and Transmodal Rail Freight Distribution in North America.” Journal of Transport Geography 16 (4): 233–246.
- Şen, A. 2008. “The U.S. Fashion Industry: A Supply Chain Review.” International Journal of Production Economics 114 (2): 571–593.
- Sheffi, Y. 2012. Logistics Clusters. Delivering Value and Driving Growth. Cambridge, MA: The MIT Press.
- Song, G., and L. Sun. 2017. “Evaluation of Factors Affecting Strategic Supply Chain Network Design.” International Journal of Logistics Research and Applications 20 (5): 405–425.
- Treacy, M., and F. Wiersema. 1993. “Customer Intimacy and Other Value Disciplines.” Harvard Business Review 71 (1): 84–93.
- van Hoek, R., H. Commandeur, and B. Vos. 1998. “Reconfiguring Logistics Systems Through Postponement Strategies.” Journal of Business Logistics 19 (1): 33-54.
- Verhetsel, A., R. Kessels, P. Goos, T. Zijlstra, N. Blomme, and J. Cant. 2015. “Location of Logistics Companies: A Stated Preference Study to Disentangle the Impact of Accessibility.” Journal of Transport Geography 42 (2015): 110–121.
- Voss, C., N. Tsikriktsis, and M. Frohlich. 2002. “Case Research in Operations Management.” International Journal of Operations & Production Management 22 (2): 195–219.
- Warffemius, P. M. J. 2007. “Modeling the Clustering of Distribution Centers around Amsterdam Airport Schiphol: Location Endowments, Economies of Agglomeration, Locked-in Logistics and Policy Implications.” PhD diss., Erasmus University Rotterdam, The Netherlands.
- Xing, Y., D. B. Grant, A. C. McKinnon, and J. Fernie. 2011. “The Interface Between Retailers and Logistics Service Providers in the Online Market.” European Journal of Marketing 45 (3): 334–357.
- Yin, R. K. 2014. Case Study Research: Design and Methods. Thousand Oaks, CA: Sage publications.