
Abstract
Introduction: The aim of this study is to evaluate prostate-specific antigen decline pattern including prostate-specific antigen kinetics following androgen deprivation therapy on prostate-specific antigen progression in the patients with advanced prostate cancer.
Materials and methods: Ninety-seven advanced prostate cancer patients receiving maximum androgen deprivation therapy were enrolled in case–control study. Baseline prostate-specific antigen, Gleason Score, bone metastase, nadir prostate-specific antigen, time to nadir prostate-specific antigen, declining slope to nadir prostate-specific antigen, estimated baseline prostate-specific antigen half-time, current prostate-specific antigen, post-nadir prostate-specific antigen time, estimated prostate-specific antigen, estimated decline of baseline prostate-specific antigen as quantitative, and ratio were recorded and calculated.
Results: The ratio of prostate-specific antigen progression was significantly lower at the patients who had slower declining slope to prostate-specific antigen, longer time to nadir prostate-specific antigen, and lower estimated decline ratio of baseline prostate-specific antigen (p: .016, p: .020, and p: .026, respectively).
Conclusions: The shorter time to nadir prostate-specific antigen following androgen deprivation therapy, faster declining slope to nadir prostate-specific antigen and higher estimated decline ratio of baseline prostate-specific antigen are associated with higher risk of disease progression in patients with hormone-sensitive prostate cancer.
Introduction
Androgen deprivation therapy is the standard and the most effective initial systematic therapy for locally advanced or metastatic prostate cancer [Citation1–4]. Median survival for the androgen-dependent period in patients with metastatic prostate is approximately 14–36 months [Citation3–5]. The disease then progresses to CRPC despite castrate testosterone levels. The PSA kinetics such as nadir PSA and TTNP have been used as useful predictive and prognostic parameters for disease progression or survival in various studies [Citation6]. In the current study, we evaulated PSA decline pattern including PSA kinetics following ADT on PSA progression in the patients with advanced prostate cancer.
Patients and methods
Ninety-seven advanced prostate cancer patients with or without bone metastase receiving maximum ADT were enrolled in a case–control study. Age, bPSA with synchronous testosterone level, GS, and bone scintigraphy were recorded. Nadir PSA, TTNP, post-nPSAT, and cPSA were determined. PSA level had been measured monthly at first 6 months and then had been measured bimonthly following ADT. As for bone scintigraphy, it has been repeated at the end of 1 year. The PSA kinetics such as ds-nPSA, e-bPSAHT, e-bPSADQ, e-bPSADR, and e-PSA were calculated using a formula that estimates PSA decline pattern. PSA progression was defined as >25% rise for at least two serial examples in PSA (taken at least 1 week apart) from its nadir level.
Statistical analysis
Age, TTNP, ds-nPSA, e-bPSADQ, and e-bPSADR were dichotomized at the median value. bPSA was dichotomized at 20 ng/mL. The e-bPSAHT was dichotomized at 1 month. GS was dichotomized at 8, nPSA and cPSA were dichotomized 0.2 ng/mL (desired group ≤0,2 ng/mL, undesired group >0,2 ng/mL). Patients were divided two groups according to PSA progression [progression(+): if current PSA level is equal >25% increase of from nPSA, progression(−): if current PSA level is equal ≤25% increase of from nPSA]. Descriptive analysis was done. The continuous and categorical variables of the groups were compared with Student’s t-test and Chi-square test, respectively. Univariate and multivariate analyses were done for the factors that predicted PSA progression. Since declining of PSA has an exponential curve, declining slope, percentile of declining, and the amount of declining were calculated using a formula [nadir PSA = baseline PSA*eʎt] using log-baseline PSA and log-nadir PSA (Appendix). The median slope shows that the decline from the median of bPSA to the median of nPSA was plotted using Mathlab software (). All statistical analyses were performed using SPSS v16.0.1 software (SPSS Inc., Chicago, IL). A two-sided p value of <.05 was considered significant. The power and the sample size calculation were done by using Power and Sample Size Calculation version 3.1.2, 2014 by William D. Dupont and Walton D. Plummer, Jr.A from the Department of Biostatistics, Vanderbilt University (http://biostat.mc.vanderbilt.edu). The sample size has been calculated for 98 patients with 80% power and 5% Type I error. KM analysis was used to evaluate the associations of TTNP, ds-nPSA, and e-bPSADR with PSA progression-free survival probability.
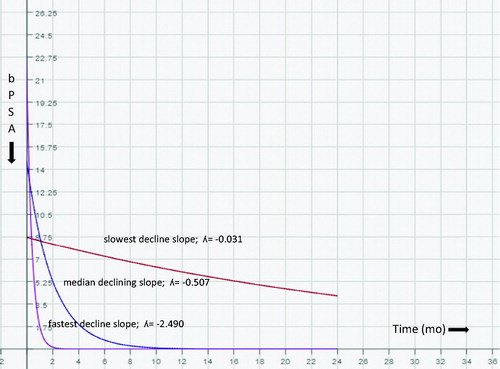
Figure 1. The graph depicts the decline with time in months from the median baseline line PSA to the median nadir PSA with the vertical axis being PSA in ng/ml and the horizontal axis being time in months.
Results
The descriptive characteristics of patients and disease are shown in . The mean and the median follow-up periods of the patients were 44.91 and 48 months, respectively (range 7–91 months). The ratio of PSA progression was 12.9% of our patients. The comparison of progressions of various parameters among their own groups is shown in . The ratio of PSA progression was significantly lower in the patients who had slower ds-bPSA (5.0%), longer TTNP (5.1%), lower e-bPSADR (5.3%), and longer e-bPSAHT (8.3%) (p: .016, p: .020, p: .026, and p: .048, respectively). There was no relationship between longer TTNP (>12 mo) and various parameters (). The mean of post-nPSAT was shorter in the PSA progression (+) group (). There was no a relationship between PSA and various parameters in the patients who had either desired nPSA or desired cPSA. The only significant finding was that the ratio of patient who had desired cPSA (PSA <0.2 ng/mL) was significantly higher in GS <8 patients (). The faster ds-nPSA, the shorter TTNP and the higher e-bPSADR predicted significantly PSA progression (p: .028, p: .033, and p: .040, respectively) in univariate analysis ().
Table 1. The descriptive characteristics of patients and disease.
Table 2. The comparison of progressions of various parameters.
Table 3. The relationship between longer TTNP (>12 months) and parameters.
Table 4. The comparison of TTNP, post-nPSAT and total follow-up times between progression (+) and (−) groups.
Table 5. The relationship between PSA values and parameters.
Table 6. The evaluation of various parameters with univariate analysis in terms of progression predicting.
Discussion
Baseline PSA level
In the current study, we demonstrated that the bPSA level was not a predictor for PSA progression () and we could not find a correlation between bPSA and TTNP durations (). The value of bPSA level has been suggested to predict the response to ADT in some reports [Citation7–9]. However, in other studies, the bPSA level was not a significant predictor of progression, PCSM, or ACM [Citation10,Citation11]. Predictive significance of bPSA level after univariate analyses was lost after multivariate analyses [Citation12–14].
Gleason score
Gleason score was an independent predictor of progression to CRPC [Citation10,Citation12,Citation15–17] or survival [Citation3,Citation4] in many studies. However, in various studies, GS was not a predictor of progression to CRPC or overall survival [Citation12,Citation17]. Seok et al. [Citation13] showed that GS had only marginal significance as a predictor of progression-free and cancer-specific survival in a univariate analysis (p = .060 and p = .064, respectively). We demonstrated that any correlation was found between GS and other parameters. The only significant finding was that the ratio of patient with desired cPSA (PSA <0.2 ng/mL) was significantly higher in GS <8 patients (). However, Gleason score was not a predictor for PSA progression in univariate analysis.
Bone metastase
Huang et al. [Citation10] demonstrated that M1 stage at diagnosis was associated with worse progression-free survival in univariate analysis and was not associated with worse progression-free survival in the multivariate analysis. We found that 34.8% of the patients had bone metastase. The count of hot-spot decreased in the 70% of the patients with bone metastase following ADT. We demonstrated that there was no correlation between bone metastase and other parameters. Bone metastase was not prognostic factor that predicted progression in univariate analysis. The results we got did not change even when we took Soloway’ classification into account [Citation18].
Nadir PSA level
In many studies, nadir PSA level following ADT has been found to be the most significant predictor of progression to CRPC [Citation8,Citation10,Citation12,Citation15] and survival [Citation11,Citation14,Citation19]. Seok et al. [Citation13] showed that higher PSA nadir (≥0.2 ng/mL) after MAB was an independent predictor of shorter progression-free and cancer-specific survival. Kwak et al. [Citation12] reported that the nadir PSA level above 1.1 ng/mL has optimal sensitivity and specificity for predicting the progression to CRPC. It was suggested that different optimal thresholds consist of 0.5, 2, and 4 ng/mL for predicting the progression to CRPC [Citation8,Citation16]. Hussain et al. [Citation3] found that a PSA of <4 ng/mL after 7 months of ADT is a strong predictor of survival. Stewart et al. [Citation19] determined that a PSA nadir of >0.2 ng/mL after 8 months of ADT is a significant predictor of prostate cancer-specific mortality in patients with biochemical recurrence after radical prostatectomy or radiation therapy. Morote et al. [Citation8] found that the nadir PSA level above 0.2 ng/mL was associated with a 20 times likelihood of progression to CRPC within 24 months. We found that the most of the patients had the desired nPSA value (92.6%). Although the percentage of TTNP >12 months was higher in the desired nPSA group (), the difference was not significant. Additionally, the ratio of PSA progression was found to be alike in either groups () and the undesired nPSA group could not predict PSA progression in univariate analysis (). However, many of these results may be related with the fact that a very few patients has an undesired nPSA value in our study.
TTNP
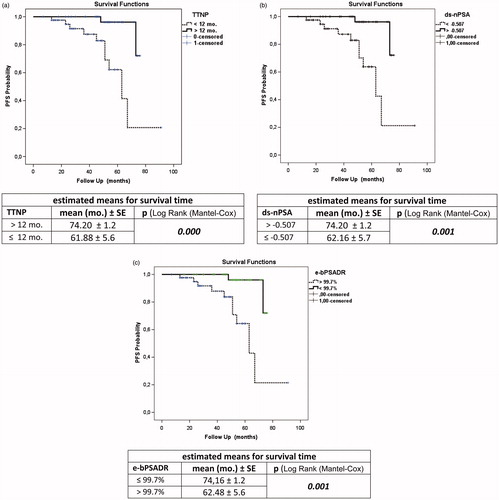
The prognostic significance of TTNP after ADT on disease progression and survival is also controversial. Arai et al. [Citation6] reported that patients whose PSA decreased rapidly to an undetectable level within 1 month after ADT had the best prognosis. Cooper et al. [Citation7] found that the PSA nadir reached within 6 months after ADT was a predictor of survival. Stamey et al. [Citation20] reported that patients whose PSA decreased rapidly to an undetectable level after ADT had prolonged survival. It was found that PSA declining to normal level PSA at 3 months after ADT was associated with a more favorable prognosis [Citation21,Citation22]. Morote et al. [Citation8] demonstrated that patients with a longer TTN (>12 months) after ADT had an 18 times higher ratio of progression to CRPC than patients with shorter TTN (≤12 months). Contrary to these, Park et al. [Citation17] did not find any relation between TTN after MAB and progression to CRPC. Sasaki et al. [Citation14] also suggested that longer TTN (>9 months) after ADT was associated with longer survival duration. Huang et al. [Citation10] also found that patients with a shorter TTN (<10 months) after ADT had a significantly shorter time to disease progression. Seok et al. [Citation13] demonstrated that shorter TTN (<8 months) after ADT was an independent predictor of shorter progression-free and cancer-specific survival in the multivariate analysis. It has been reported that lower nadir PSA (<0.2 ng/mL) and longer TTNP (>8 months, >9 months and >9 months, respectively) were early predictor of longer survival in combined analysis of nadir PSA and TTNP [Citation10,Citation13,Citation14]. Teoh et al. [Citation23] categorized the patients into three groups according to their TTPN and demonstrated that the longer TTPN (>17 months) was associated with lower logarithm of PSA velocity after progression [Log(PSAVAP)] (regression coefficient −0.030, p = .001). In the current study, we found that the patients with a longer TTNP (>12 months) following ADT had significantly lower ratio of progression (). Additionally, we also demonstrated that a shorter TTNP (≤12 months) was an independent predictor of progression (). In our study, estimated mean for survival time in the longer TTNP group was significantly longer than the shorter TTNP group in KM survival analysis (). The rapid decrease in the PSA level may be related to a transcriptional effect of ADT on PSA production rather than prostate cancer cell death [Citation4]. This decrease may be due to ablation of androgen receptor function, and, as a result, the quick suppression of androgen receptor following ADT may have a negative effect on disease progression [Citation10]. Another possibility is that a rapid decrease of hormone-sensitive prostate cancer cells might induce growing of hormone-resistant prostate cancer cells [Citation14].
Figure 2. (a) KM plot and the estimated means for survival time for TTNP. (b) KM plot and the estimated means for survival time for ds-nPSA. (c) KM plot and the estimated means for survival time for e-bPSADR.
Pattern of bPSA decline after treatment
In the literature, pattern of bPSA decline following treatment is defined as bPSA half-time/month (e-bPSAHT), estimated decline of bPSA at the end of one year as quantitative (e-bPSADQ), and the decline of bPSA at the end of 2 months [Citation4,Citation16,Citation24]. We also calculated the declining slope to nPSA (ds-nPSA), the estimated decline of bPSA at the end of 1 year as rational (e-bPSADR), and the PSA level at the end of 1 year (e-PSA). The patients with 60.6% had 1 month or less half-time duration. In these patients, the mean of TTNP was shorter (6.68 month and 23.95 month, respectively) and progression was higher (23.5% and 8.3%, respectively), whereas GS was the same in other group. Choueiri et al. [Citation4] calculated the PSA decline (PSAD) from the slope of the linear regression of the raw PSA values over time, using PSA values from 1 month prior to ADT until the nadir PSA. The estimated median PSA decline (PSAD) was 52 ng/mL/year. They demonstrated that PSAD (≥52 ng/mL/year) was associated with shorter survival in univariate analysis. Hussain et al. [Citation3] found that a PSA of 4 ng/mL or less after 7 months was a strong predictor of survival. Oosterlinck et al. [Citation25] found that a PSA of 4 ng/mL or less in 546 men with M0 and M1 disease treated with ADT occurred in 51% of patients after 3 months and in 66% of them after 6 months. The ratio of patients had a PSA of 4 ng/mL or less after 7 months was estimated to be 91.4% in our study. We calculated declining slope to nPSA (ds-nPSA). The fastests, the slowest, and the median decline slope value were calculated as −2.490, −0.031, and −0.507, respectively, using our formula (). We found that a decline of a slope of −0.507 or a faster decline was a strong predictor of progression (). Estimated mean for survival time in the slower declining slope group (> −0.507) was significantly longer than the faster declining slope group in KM survival analysis (). We also estimated bPSA declining as quantitative and rational (e-bPSADQ and e-bPSADR, respectively). The median of the e-bPSADQ was 12.58 ng/mL/year and the median of the e-bPSADR was 99.7%/year. The e-bPSADR of 99.7% or more at the end of a year was a strong predictor of progression, whereas e-bPSADQ was not a siginificant predictor for progression. We found that estimated mean for survival time in the lower e-bPSADR group (<99.7%) was significantly longer than e-bPSADR with the higher value group in KM survival analysis (). In various studies, due to different baseline PSA mean values, reporting annual PSA decline quantitatively, even with the same ratios of decline, might be troublesome. That is why, we believe that reporting annual PSA decline with ratios, would be more appropriate.
Post-nadir PSA time
Teoh et al. reported three groups to TTPN for PFS (0–3 months, 3–17 months, and >17 months) and for OS (0–6 months, 6–20 months, and >20 months) [Citation5]. They estimated that the survival beyond TTPN increased exponentially with TTPN in the TTPN >17 months group for PFS and TTPN >20 months group for OS. We compared TTNP, post-nadir PSA time (post-nPSAT), and total follow-up time values between PSA progression(+) and PSA progression(−) (). In the PSA progression(−) group, despite it having a similar total follow-up time as the other group, it was rather interesting to find that mean post-nPSAT value was shorter. It is possible that ratio of PSA progression is the same in both groups when mean post-nPSAT value in the PSA progression(−) group achieves other group’s value. We might assume that time to PSA progression following ADT depends on TTNP substantially, in the case that this probability becomes a fact.
Testosterone level
ADT has negative consequences and complications like osteoporosis, sexual dysfunction, gynecomastia, and adverse body composition are well known [Citation26]. Yassin et al. [Citation27] suggested that testosterone replacement therapy (TRT) might have a protective effect against high-grade PCa. Jhan et al. [Citation28] demonstrated that ADT use is associated with an increased risk of developing Alzheimer's disease. Teoh et al. [Citation29] found that ADT especially in diabetic patients with poor performance status increase fracture risk in Chinese men. In a meta-analysis, Dong et al. [Citation30] suggested that intermittent hormone therapy might be a better option over continuous hormone therapy for locally advanced prostate cancer. Urushima et al. [Citation31] investigated the effects of ADT on serum aP2 and adiponectin in PCa patients and found that 6 months post-ADT, serum aP2, and adiponectin levels were significantly increased, and high serum aP2 levels were correlated with the late development of metabolic syndrome. In the current study, all of our patients had continuous ADT and we measured testosterone levels with synchronous PSA measurements to evaulate response to ADT. All measurements of patients except baseline levels were at castration level of testosterone (<50 ng/dL).
Limitation and strength
Our study has limitation and strength. The study was conducted in a single center and it had a small study population with relatively shorter follow-up duration. However, we believe that the strength of our study presents new findings and new PSA parameters such as a formula of PSA decline pattern, declining slope to nPSA, estimated declining of bPSA ratio, and estimated PSA.
Conclusions
The shorter TTNP following ADT, faster declining slope to nPSA (ds-nPSA), and more estimated decline ratio of bPSA (e-bPSADR) are associated with higher risk of disease progression in patients with metastatic or non-metastatic, hormone-sensitive prostate cancer. Moreover, we might assume that perhaps time to PSA progression following ADT depends on TTNP substantially. We created a formula, because, declining of PSA has an exponential curve. Using this formula, calculating and estimating the decline slope, PSA half-time, declining of PSA yearly (quantitative/rational), and e-PSA may be helpful in predicting the prognosis following ADT.
Ethical approval
This article does not contain any studies with human participants or animals performed by any of the authors.
Disclosure statement
The authors report no conflicts of interest.
References
- Crawford ED, Eisenberger MA, McLeod DG, et al. A controlled trial of leuprolide with and without flutamide in prostatic carcinoma. N Engl J Med. 1989;321:419–424.
- Schellhammer PF. A urologist’s personal view of prostate cancer. Turk J Urol. 2016;42:121–126.
- Hussain M, Tangen CM, Higano C, et al. 2006. Absolute prostate-specific antigen value after androgen deprivation is a strong independent predictor of survival in new metastatic prostate cancer: data from Southwest Oncology Group Trial 9346 (INT-0162). J Clin Oncol. 24:3984–3990.
- Choueiri TK, Xie W, D’Amico AV, et al. Time to prostate-specific antigen nadir independently predicts overall survival in patients who have metastatic hormone-sensitive prostate cancer treated with androgen-deprivation therapy. Cancer. 2009;115:981–987.
- Teoh JYC, Tsu JHL, Yuen SKK, et al. Prognostic significance of time to prostate-specific antigen (PSA) nadir and its relationship to survival beyond time to psa nadir for prostate cancer patients with bone metastases after primary androgen deprivation therapy. Ann Surg Oncol. 2015;22:1385–1391.
- Arai Y, Yoshiki T, Yoshida O. Prognostic significance of prostate specific antigen in endocrine treatment for prostatic cancer. J Urol. 1990;144:1415–1419.
- Cooper EH, Armitage TG, Robinson MR, et al. Prostatic specific antigen and the prediction of prognosis in metastatic prostatic cancer. Cancer. 1990;66:1025–1028.
- Morote J, Trilla E, Esquena S, et al. Nadir prostate-specific antigen best predicts the progression to androgen-independent prostate cancer. Int J Cancer. 2004;108:877–881.
- Ross RW, Xie W, Regan MM, et al. Efficacy of androgen deprivation therapy (ADT) in patients with advanced prostate cancer: association between Gleason score, prostate-specific antigen level, and prior ADT exposure with duration of ADT effect. Cancer. 2008;112:1247–1253.
- Huang SP, Bao BY, Wu MT, et al. Impact of prostate-specific antigen (PSA) nadir and time to PSA nadir on disease progression in prostate cancer treated with androgen-deprivation therapy. Prostate. 2011;71:1189–1197.
- Huang SP, Bao BY, Wu MT, et al. Significant associations of prostate-specific antigen nadir and time to prostate-specific antigen nadir with survival in prostate cancer patients treated with androgen-deprivation therapy. Aging Male. 2012;15:34–41.
- Kwak C, Jeong SJ, Park MS, et al. Prognostic significance of the nadir prostate specific antigen level after hormone therapy for prostate cancer. J Urol. 2002;168:995–1000.
- Hong SY, Cho1 DS, Kim SI, et al. Prostate-specific antigen nadir and time to prostate-specific antigen nadir following maximal androgen blockade independently predict prognosis in patients with metastatic prostate cancer. Korean J Urol. 2012;53:607–613.
- Sasaki T, Onishi T, Hoshina A. Nadir PSA level and time to PSA nadir following primary androgen deprivation therapy are the early survival predictors for prostate cancer patients with bone metastasis. Prostate Cancer Prostatic Dis. 2011;14:248–252.
- Benaim EA, Pace CM, Lam PM, et al. Nadir prostate-specific antigen as a predictor of progression to androgen-independent prostate cancer. Urology. 2002;59:73–78.
- Park YH, Hwang IS, Jeong CW, et al. Prostate specific antigen half-time and prostate specific antigen doubling time as predictors of response to androgen deprivation therapy for metastatic prostate cancer. J Urol. 2009;181:2520–2524.
- Park SC, Choi HY, Kim CS, et al. Predictive variables of the progression to androgen independent prostate cancer after combined androgen blockade. Korean J Urol. 2007;48:408–415.
- Soloway MS, Hardeman SW, Hickey D, et al. Stratification of patients with metastatic prostate cancer based on extent of disease on initial bone scan. Cancer. 1988;61:195–202.
- Stewart AJ, Scher HI, Chen MH, et al. Prostate-specific antigen nadir and cancer-specific mortality following hormonal therapy for prostatespecific antigen failure. JCO. 2005;23:6556–6560.
- Stamey TA, Kabalin JN, Ferrari M, et al. Prostate specific antigen in the diagnosis and treatment of adenocarcinoma of the prostate. IV. Anti-androgen treated patients. J Urol. 1989;141:1088–1090.
- Petros JA, Andriole GL. Serum PSA after antiandrogen therapy. Urol Clin North Am. 1993;20:749–756.
- Furuya Y, Akimoto S, Akakura K, et al. Response of prostate-specific antigen after androgen withdrawal and prognosis in men with metastatic prostate cancer. Urol Int. 1998;60:28–32.
- Teoh JYC, Tsu JHL, Yuen SKK, et al. Association of time to prostate-specific antigen nadir and logarithm of prostate-specific antigen velocity after progression in metastatic prostate cancer with prior primary androgen deprivation therapy. Asian J Androl. 2016;18:1–5.
- Park BJ, Lee YG, Ahn HK. Prognostic significance of prostate-specific antigen level two months after maximal androgen blockade in metastatic prostate cancer. Korean J Urol. 2003;44:855–860.
- Oosterlinck W, Mattelaer J, Casselman J, et al. PSA evolution: a prognostic factor during treatment of advanced prostatic carcinoma with total androgen blockade—data from a Belgian mutlticentric study of 546 patients. Acta Urol Belg. 1997;65:63–71.
- Shahani S, Braga-Basaria M, Basaria S. Androgen deprivation therapy in prostate cancer and metabolic risk for atherosclerosis. J Clin Endocrinol Metab. 2008;93:2042–2049.
- Yassin A, Salman M, Talib RA, et al. Is there a protective role of testosterone against high-grade prostate cancer? Incidence and severity of prostate cancer in 553 patients who underwent prostate biopsy: a prospective data register. Aging Male. 2017. [Epub ahead of print] doi: 10.1080/13685538.2017.1298584
- Jhan JH, Yang YH, Chang YH, et al. Hormone therapy for prostate cancer increases the risk of Alzheimer's disease: a nationwide 4-year longitudinal cohort study. Aging Male. 2017;20:33–38.
- Teoh JY, Chiu PK, Chan SY, et al. Androgen deprivation therapy, diabetes and poor physical performance status increase fracture risk in Chinese men treated for prostate cancer. Aging Male. 2015;18:180–185.
- Dong Z, Wang H, Xu M, et al. Intermittent hormone therapy versus continuous hormone therapy for locally advanced prostate cancer: a meta-analysis. Aging Male. 2015;18:233–237.
- Urushima H, Inomata-Kurashiki Y, Nishimura K, et al. The effects of androgen deprivation therapy with weight management on serum aP2 and adiponectin levels in prostate cancer patients. Aging Male. 2015;18:72–76.
Appendix
Abbreviations and acronyms
bPSA: baseline PSA; nPSA: nadir PSA; cPSA: current PSA; TTNP: time to nadir PSA; TTCP: time to current PSA; e: Euler's number; e: 2.718 (Euler's number); loge: 0.434; ʎ: declining slope to nPSA; e-PSA: estimated PSA at the end of 1 year; e-bPSADR: estimated decline of bPSA at the end of one year/ratio.
A. Estimation of declining slope to nPSA
Main formula: nPSA = bPSA*eλ t
Example: bPSA: 60ng/mL, nPSA:0.2ng/mL, t:6mo.(TTNP)
B. Estimation of e-PSA and e-bPSADR
Main formula: cPSa = bPSA*elambda t
Example: bPSA:52ng/mL, cPSA:0.16ng/mL, t: 8mo.(TTCP)