
Abstract
Objective: The association of caffeine intake with testosterone remains unclear. We evaluated the association of caffeine intake with serum testosterone among American men and determined whether this association varied by race/ethnicity and measurements of adiposity.
Methods: Data were analyzed for 2581 men (≥20 years old) who participated in the cycles of the NHANES 1999–2004 and 2011–2012, a cross-sectional study. Testosterone (ng/mL) was measured by immunoassay among men who participated in the morning examination session. We analyzed 24-h dietary recall data to estimate caffeine intake (mg/day). Multivariable weighted linear regression models were conducted.
Results: We identified no linear relationship between caffeine intake and testosterone levels in the total population, but there was a non-linear association (pnonlinearity < .01). Similarly, stratified analysis showed nonlinear associations among Mexican-American and Non-Hispanic White men (pnonlinearity ≤ .03 both) and only among men with waist circumference <102 cm and body mass index <25 kg/m2 (pnonlinearity < .01, both).
Conclusion: No linear association was identified between levels of caffeine intake and testosterone in US men, but we observed a non-linear association, including among racial/ethnic groups and measurements of adiposity in this cross-sectional study. These associations are warranted to be investigated in larger prospective studies.
Introduction
Coffee has been implicated with a potential beneficial role against chronic diseases due to it being a rich source of caffeine, antioxidants and anti-inflammatory compounds [Citation1–3]. Recently, a large prospective study reported that men who consumed six or more cups of coffee per day had a lower adjusted relative risk for overall and lethal prostate cancer (PCa) compared with nondrinkers [Citation4]. One biological mechanism that has been hypothesized underlying this association is through the sex-steroid hormone axis [Citation4–6]. Although animal studies have suggested an inverse association between caffeine and testosterone [Citation7], yet the interplay between caffeine and testosterone levels in the National Health and Nutrition Examination Survey (NHANES) remains unclear.
Furthermore, a body of literature has identified that race and ethnicity and body fatness [body mass index (BMI) and waist circumference (WC)] could influence the rates of PCa, with higher rates being reported among African-Americans and obese men [Citation8–11]. Interestingly, a line of research has reported that testosterone levels are associated with race/ethnicity and body fatness [Citation12–15]. These studies have shown that Mexican American men had the highest levels of testosterone, whereas men with large BMI and WC had lowest levels of testosterone. Surprisingly, there is a research gap in our understanding on whether race/ethnicity and body fatness influence the association of caffeine intake with testosterone levels. Therefore, the objectives of this study are to investigate the association of caffeine intake with testosterone levels and determine whether this association varies by race/ethnicity and body fatness.
Materials and methods
Study population
The NHANES is a program of studies undertaken by the National Center for Health Statistics (NCHS) of the US Centers for Disease Control and Prevention (CDC) to assess the health and nutritional status of adults and children in USA. NHANES uses a multistage, stratified and clustered probability sampling strategy in which Mexican-Americans, non-Hispanic Blacks, and the elderly are oversampled to ensure adequate sample size and to represent the total US civilian, non-institutionalized population [Citation16]. The NHANES is a cross-sectional study that includes an interview, and an examination component that includes blood collection. Investigators are allowed to access surplus sera for approved studies. The present study included data from male participants in the 1999–2000, 2001–2002, 2003–2004, and 2011–2012 NHANES cycles. Details of the survey design, methods and data collections are available on the NHANES website (https://www.cdc.gov/nchs/nhanes/index.htm, accessed 30 January 2017).
Assessment of total testosterone
Total testosterone was measured from stored surplus serum samples by the study investigators in 4927 males, who were a stratified random sample of participants in the morning examination sessions of each cycle. Morning sample participants were chosen to reduce extraneous variation due to diurnal production of hormones. Male participants younger than 20 years were not included in this study (n = 10,267). We excluded participants with a self-reported history of prostate cancer because certain treatments may affect hormone levels leaving a final sample of 2581 men. The NHANES program is approved by the Institutional Review Board of the NCHS at CDC. Informed consent was obtained from all participants. Addressing questions about hormones and men’s health in NHANES was approved by the National Institutes of Health Office of Human Subjects Research and the NCHS Ethics Review Board at CDC.
Details on the blood draw, process, storage and shipping methods are provided elsewhere [Citation17,Citation18]. In NHANES 1999–2004, testosterone was measured using the Elecsys 2010 system (Roche Diagnostics, Laval, QC, Canada). The laboratory technicians were blinded to the participant characteristics of the samples. The lower limits of detection of the assays were 2 ng/dL for testosterone. One sample had a concentration below the limit of detection for testosterone, which was assigned to half the limit of detection (i.e. 1 ng/dL). Twenty-one samples were assayed in duplicate for quality control purposes, and the coefficients of variation were 4.8% for testosterone. In NHANES 2011–2012, testosterone was measured with LC-MS/MS and was isolated from 100 μL serum by two serial liquid–liquid extraction steps and quantified with [13C] stable isotope-labeled testosterone as the internal standard. The lower limit of detection was 0.3 ng/dL. Values of total testosterone ≤3.0 ng/mL are considered testosterone deficiency (TD) [Citation19,Citation20]. In this study, the term TD doesn’t imply that a deficit needs to be replaced, therefore, its use is analogous to low testosterone.
Assessment of caffeine and dietary data
The US Department of Agriculture developed and validated a multiple-pass dietary recall method for NHANES to collect dietary data [Citation21]. Participants reported all food and beverages consumed in two, 24-h dietary recall periods (midnight to midnight). The first one was conducted by dietary research interviewers face-to-face, and the second one was done 3–10 days later by telephone. Because NHANES 2001–2002 only included one recall and in order to maintain consistency with the other cycles, our analysis was limited to the first-day dietary recall for NHANES waves 2001–2002, 2003–2004 and 2011–2012. After the dietary interviews, USDA’s Food and Nutrient Database for Dietary Studies 5.0 (2012, Beltsville, MD) was used to code dietary intake data and calculate nutrient intakes [Citation21]. Based on the quantity of food and beverages reported and the corresponding nutrient contents by the NCHS, the caloric content and other nutrients derived from each consumed food and beverage item were calculated [Citation21,Citation22]. Data on caffeine intake (mg/day), plain and tap water (g), and alcohol (g) was obtained from the Total Nutrient File, which contains summed nutrients for an individual from all food and beverages provided on the dietary recall [Citation23]. We examined caffeine intake in six categories (mg/day), lowest category (C1; 0 mg/d), second category (C2; 0.1–60 mg/d), third category (C3; 61–200 mg/d), fourth category (C4; 201–325 mg/d), fifth category (C5; 326–450 mg/d), and sixth category (C6; ≥451 mg/d) using the International Coffee Organization’s (http://www.ico.org/) information related to amount of caffeine per cup and previous studies [Citation24,Citation25]. Total water intake was categorized and defined by combining plain and tap water, and it was included in multivariable models, while alcohol consumption was kept as continuous variable [Citation25,Citation26].
Assessment of covariates
Age, race/ethnicity, smoking status, education, diabetes and physical activity during the past 30 days (moderate and vigorous) were self-reported during the NHANES interview. NHANES categorizes race/ethnicity as non-Hispanic white (NHW), non-Hispanic black (NHB) and Mexican American (MA). Participants were classified as never, former and current smokers from self-reported information; participants were asked if they had smoked more than 100 cigarettes in their lifetime and if they were current smokers. Current smokers consisted of those who self-reported smoking habits and smoked more than 100 cigarettes in their lifetime. Vigorous physical activity was obtained from the questions on whether participants did any activity that caused heavy sweating or large increases in breathing or heart rate (e.g. swimming, aerobics, or fast cycling), while moderate physical activity was determined from the questions on whether they did any activities that caused light sweating or a moderate increase in the heart rate, such as playing golf, dancing, bicycling for pleasure, or walking. BMI was calculated from measured weight and height (weight in kilograms divided by height in meters squared). Overweight/obesity was defined by BMI ≥25 kg/m2. WC was measured at the iliac crest. Abdominal obesity was defined as WC ≥102 cm. Type 2 diabetes status was defined as having fasting plasma glucose of ≥126 mg/dl, medication treatment or being “told by a doctor you have diabetes or sugar diabetes”. Fasting plasma glucose concentration was measured in the morning session after an overnight fast of at least 8 h [Citation27], details related to the laboratory procedures of that measurement is found elsewhere [Citation16].
Statistical analyses
Sampling weights were applied to account for selection probabilities, over-sampling, non-response, and differences between the sample and the total US population. Geometric means and 95% confidence intervals (CIs) for total testosterone concentrations were estimated by caffeine intake using weighted linear regression models. Similarly, adjusted odds ratios (OR) and 95% CIs for TD (≤3 ng/mL) using weighted logistic regression models were estimated in relation to six categorical groups of caffeine intake. Total testosterone concentrations were transformed using natural logarithm because they were right-skewed. Caffeine intake was categorized in six groups based on previous studies [Citation24,Citation25] including cutoff points of caffeine intake per cup provided by the International Coffee Organization (http://www.ico.org/). To test for a linear trend across categories of caffeine intake, we modeled caffeine intake as a continuous variable using the median for each category. To assess the deviation from linear trend in a separate model, we included quadratic term for caffeine intake (caffeine intake-squared) in addition to the continuous variable for caffeine intake and the p values associated with this quadratic term to report curvilinear associations [Citation28]. Furthermore, a prior study using NHANES caffeine data showed that caffeine intake did not follow a simple linear dose–response curve, but rather an exponential shape; therefore, we considered using the quadratic term will be more appropriate in this association [Citation25,Citation28,Citation29]. In the multivariable linear regression models, we adjusted for age, race/ethnicity, education, BMI, smoking status, vigorous and moderate physical activity, total water intake, total energy intake and total alcohol intake. Similarly, these confounders were adjusted for in the multivariable logistic regression models to determine association between TD and caffeine intake.
Stratified and multivariable analyses were conducted by race and ethnicity (NHW, MA, NHB) and body fatness variables such as overweight/obesity (BMI ≥25 kg/m2) and abdominal obesity (WC ≥102 cm) because these variables are known to modify testosterone levels. All p values were two-sided; α = 0.05 was considered the cutoff for statistical significance. All statistical analyses were performed using STATA version 12.0 (StataCorp LLC, College Station, TX).
Results
The distribution of baseline characteristics in the study population after applying sampling weights is shown in . Fourteen percent of men reported 0 mg/day of caffeine intake, 28% reported 61–200 mg/day of caffeine intake (equivalent to at least one cup of coffee per day), and 15% of men reported 201–325 mg/day of caffeine intake (equivalent to 2–3 cups of coffee). Eight percent and 14% of men reported 326–450 mg/day and ≥451 mg/day, respectively, of caffeine intake. As expected, in the last three categories of caffeine intake (>201 mg/day) men tended to be older (mean age >49 years old). Similar observations of high caffeine intake among older men were detected when age was categorized as 20–30, 40–39, 40–49, 50–59 and ≥60 years old. Men with a higher caffeine intake (>201 mg/day) were more likely to be NHW, current smokers and non-diabetic. In , mean value for caffeine intake was 226.0 mg/day, 2010.0 mg/day for total water intake, 2630.0 kcal/day for energy and 18.0 mg/day for alcohol.
Table 1. Selected characteristics of the US population of adult men aged ≥20 years: NHANES 1999–2004 and 2011–2012.
Table 2. Summary of dietary characteristics for NHANES cycles 1999–2004 and 2011–2012.
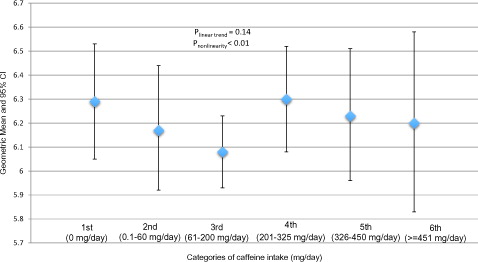
In , after adjusting for age, race/ethnicity, education, BMI, smoking status, vigorous and moderate physical activity, total water intake, total energy intake and total alcohol intake, we did not find a significant linear association between serum testosterone levels and categories of caffeine intake (low to high) in the total population (plinear trend = .21). However, we can’t exclude a possible non-linear association (pnonlinear < .01). It seemed that testosterone levels started decreasing as men consumed 0.1–60 and 61–200 mg/day of caffeine intake. However, levels of testosterone increased again among men with 201–325 mg/day of caffeine intake (equivalent of 2–3 cups of coffee), but there was a subsequent decrease of testosterone in the two highest categories of caffeine intake, 326–450 and ≥451 mg/day.
Figure 1. Geometric means and 95% confidence intervals of total testosterone (ng/mL) concentrations by categories of caffeine intake in 2581 participants (≥20 years old) in the NHANES cycles 1999–2004 and 2011–2012. Multivariable model was adjusted for age, race/ethnicity, education, BMI, smoking status, vigorous and moderate physical activity, total water intake, total energy intake and total alcohol intake. *Significantly different from 0 mg/day, p < .05.
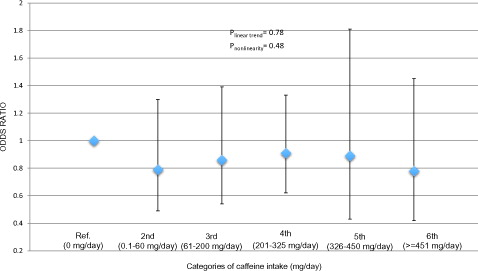
Similarly, in total population, we investigated the association of TD (3.0 ng/mL of total testosterone) with categories of caffeine intake (). The category of 0 mg/day of caffeine intake was selected as the reference group. In this analysis, there was no significant trend (plinear trend = .78) and also the independent comparisons between categories of caffeine intake with the reference group (0 mg/day) were not significantly different: 0.1–60 mg/day (OR = 0.79, 95% CI: 0.49–1.30, p = .36), 61–200 mg/day (OR = 0.86, 95% CI: 0.54–1.39, p = .54), 201–325 mg/day (OR = 0.91, 95% CI: 0.62–1.33, p = .62); 326–450 mg/day (OR = 0.89, 95% CI: 0.43–1.81, p = .73) and ≥451 mg/day (OR = 0.78, 95% CI: 0.42–1.45, p = .43).
Figure 2. Association† of caffeine intake categories with testosterone deficiency (≤3 ng/mL) in the NHANES cycles 1999–2004 and 2011–2012. †Model adjusted for age, race/ethnicity, education, BMI, smoking status, vigorous and moderate physical activity, total water intake, total energy intake and total alcohol intake. *Significantly different from 0 mg/day, p < .05.
The association of serum testosterone levels with caffeine intake was further investigated by stratification with race and ethnicity () and body fatness () in multivariable analysis. Among MA men, we identified a significant non-linear U-shape association between caffeine intake (low to high) and testosterone levels (pnonlinear = .03). Mean levels of testosterone from categories of caffeine intake, 0.1–60 mg/day and 61–200 mg/day, were significantly different from mean level of testosterone (6.61 ng/mL) in men with 0 mg/day of caffeine intake, 5.91 ng/mL (95% CI: 5.52–6.15, p = .03) and 5.92 ng/mL (95% CI: 5.60–6.25, p = .002), respectively. Among NHW men, we did not find a linear association between caffeine intake and testosterone (plinear trend = .55), but there was a significant non-linear association (pnonlinear < .01). No significant associations of any shape were found among NHB men.
Figure 3. Geometric means and 95% confidence intervals of total testosterone (ng/mL) concentrations by categories of caffeine intake stratify by race and ethnicity: NHANES cycles 1999–2004 and 2011–2012. Multivariable model was adjusted for age, education, BMI, smoking status, vigorous and moderate physical activity, total water intake, total energy intake and total alcohol intake. MA: Mexican-Americans; NHW: non-Hispanic white; NHB: non-Hispanic black. C1 = 0 mg/day; C2 = 0.1–60 mg/day; C3 = 61–200 mg/day; C4 = 201–325 mg/day; C5 = 326–450 mg/day; C6 = ≥451 mg/day. *Significantly different from 0 mg/day, p < .05.
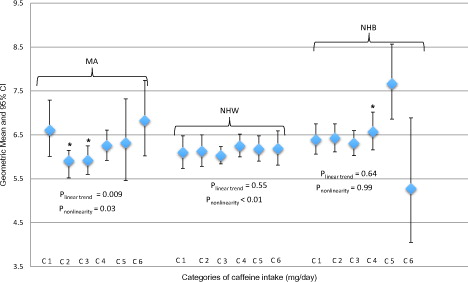
Figure 4. Stratified by body mass index (≥25 kg/m2) the association of caffeine intake categories with total testosterone (ng/mL) concentrations in 2581 participants (≥20 years old) in the NHANES cycles 1999–2004 and 2011–2012. Multivariable model was adjusted for age, education, smoking status, vigorous and moderate physical activity, total water intake, total energy intake and total alcohol intake. C1 = 0 mg/day; C2 = 0.1–60 mg/day; C3 = 61–200 mg/day; C4 = 201–325 mg/day; C5 = 326–450 mg/day; C6 = ≥451 mg/day. Body mass index ≥25 kg/m2 is defined as overweigh/obesity. *Significantly different from 0 mg/day, p < .05.
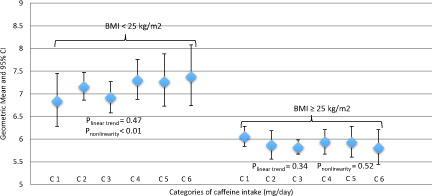
In , we stratified the association between caffeine intake and testosterone levels by overweight/obesity (BMI ≥ 25 kg/m2). No linear relationship between caffeine intake and testosterone was identified in any of the two groups, non-overweight/obesity and overweight/obesity, plinear trend = .47 and .34, respectively. However, we identified a nonlinear association between caffeine intake and testosterone levels only among men in the non-overweight/obesity group (pnonlinear < .01). Stratification by abdominal obesity (WC ≥ 102 cm) showed similar nonlinear association in the non-abdominal obesity group (pnonlinear < .01) (Supplementary Figure S1). Finally, it was observed that men who were in the overweight/obesity and abdominal obesity groups had lower levels of testosterone than those men who were in the non-overweight/obesity and non-abdominal obesity groups.
We also analyzed the association of caffeine intake (continuous variable) with serum testosterone, including stratification by race/ethnicity, and TD. The results are presented in an online Supplementary material (Supplementary Tables S1–S3). In general, we did not find any statistical significant associations. Similarly, stratification of the association between caffeine intake and testosterone by WC was not significant and did not convey any different message than stratification by BMI (Supplementary Figure S1).
Discussion
In this cross-sectional study of the NHANES cycles 1999–2004 and 2011–2012, we examined the association of caffeine intake with serum testosterone levels and determined whether this association varied by race and ethnicity and measurements of adiposity. These results showed that there was no linear relationship between caffeine intake and testosterone levels in the total population, but we can’t exclude a potential non-linear association. When the outcome was defined as TD (≤3.0 ng/mL of total testosterone), the association with caffeine intake was not significant as well. In stratified analysis, only in MA men there was a significant association between caffeine intake and testosterone levels and a significant non-linear J-shape association. In NHW men, we identified a potential nonlinear association, and null results were reported in NHB men. When the association of caffeine intake with testosterone levels were stratified by overweight/obesity (BMI ≥ 25 kg/m2), only in those men who were not overweight/obese we found significant associations.
The relationship between caffeine intake and testosterone levels has been previously investigated in women, but surprisingly very few studies have been conducted among men [Citation6,Citation30–33]. However, with the exception of one study [Citation33], most of these studies conducted among men have to be interpreted with caution mainly due, in part, to their small sample size. Donald et al. [Citation30] showed an increased in testosterone concentration in healthy male amateur games players (n = 11), who were sleep-deprived, after caffeine supplementation (6 mg kg−1, an equivalent of approximately three cups of coffee). Wu et al. [Citation31] showed an increased in testosterone concentration after a high-caffeine dose (6 mg kg−1) in 12 university male athletes. Wedick et al. [Citation6] in a parallel-arm randomized controlled trial of 14 healthy men reported that consumption of caffeinated coffee (five 6-ounce cups of caffeinated coffee) increased total testosterone at Week 4, but not at Week 8. Other randomized, double-blind, placebo-controlled, balance trial of 24 men showed an increase of testosterone in a dose-dependent manner by high concentration of caffeine (800 mg) [Citation32]. A previous large European cross-sectional study of 1563 men showed a positive association between coffee (cups/day) and total testosterone; however, statistical significance disappeared when low versus high number of cups of coffee were compared (1–4 cups versus >4 cups of coffee) [Citation33].
In a similar way, there is also a limited research on addressing the independent association of caffeine intake with testosterone levels stratified by race/ethnicity and measurements of adiposity [Citation5,Citation33]. The significance to conduct this type of investigation is that previous studies have reported independent associations of testosterone with race/ethnicity and measurements of adiposity in NHANES [Citation12–15]. Therefore, the investigation of the association between caffeine intake and testosterone levels stratified by race/ethnicity and measurements of adiposity is warranted.
Several aspects of our findings merit discussion. First, we did not find a significant linear association between caffeine intake and testosterone levels in the total population, which is in disagreement from previous studies conducted among men [Citation6,Citation30–33]. One of the main differences between previous studies and the current study is the sample size. Our study included 2581 men whose age was ≥20 years old. Some of the benefits of a large sample size are that they are more representative of the population, limiting the influence of outliers and extreme observations, and an increase in precision. In contrast, the two previous randomized trials [Citation6,Citation32] can minimize the effects of unknown confounders in the association between caffeine intake and testosterone levels, which is difficult to address in a cross-sectional study irrespective of the large sample population. Although another previous cross-sectional study reported a positive association between cups of coffee and total testosterone, this significance was attenuated when they compared 1–4 cups versus >4 cups of coffee thus concurring with our null findings in the total population [Citation33]. Second, although we can’t exclude a non-linear association between caffeine intake and testosterone, we will interpret this finding with caution for the following reasons, (i) it may be due to chance and (ii) there is still no well-established biological plausibility about the differential effects of low-, medium- or high-caffeine intake on the regulation of testosterone production. However, the mechanistic explanations for nonlinear patterns in caffeine intake-testosterone associations are complex yet plausible, in part because different processes likely explain different aspects of the findings. Future prospective and larger studies could focus on whether different amounts of caffeine have differential effects on testosterone levels or its production. Third, comparison of caffeine intake among studies is not standardized. Our study included total caffeine intake obtained from all food and beverages reported in the 24-h dietary recalls, and the categorical groups of caffeine intake per day presented in this study only provided approximation of cups of coffee per day following cutoff points of caffeine intake provided by the International Coffee Organization (http://www.ico.org/) and previous studies [Citation24,Citation25]. Moreover, the two randomized trials reported significant associations with high caffeine intake (800-mg dose) [Citation32] and a high intake of cups of coffee (five 6-ounce cups of caffeinated coffee) [Citation6], but this high intake of caffeine or cups of coffee is not typical in the general population. The other studies reported an intake of 6 mg kg−1 of caffeine supplementation (equivalent of approximately three cups of coffee) [Citation30,Citation31]. Yet it is worthwhile to mention that these previous studies were conducted in more controlled settings for caffeine intake. Therefore, it is possible that the effects of caffeine on testosterone in controlled settings may be different than the ones obtained from 24-dietary recalls in cross-sectional studies. Fourth, we couldn’t adjust for sex hormone-binding globulin and estradiol levels because they were not included in the latest NHANES 2011–2012 wave, and we wanted to capitalize on the large sample size by combining these two NHANES waves. Fifth, our multiple linear-regression models included confounders, such as total water intake and total energy, that have not been previously included in other studies, but they have the potential to mask the association between caffeine intake and testosterone levels. Finally, stratification analysis reduces the sample size in both the exposure and the outcome, and to a greater extent in categorical variables, therefore, the significant associations identified in this stratified analyses may be due to chance and they should be interpreted with caution.
Similar unexpected results were identified after stratifying by measurements of adiposity showing no significant linear associations of caffeine intake with testosterone, but only possible nonlinear associations among men who were in the non-overweight/obesity and non-abdominal obesity groups. Furthermore, irrespective of caffeine intake, men who were included in the overweight/obesity and abdominal obesity groups had lower levels of testosterone than those men who were in the non-overweight/obesity and non-abdominal obesity groups. It remains unclear what biological mechanism(s) may be influenced in this latter observation. Thus, future large prospective studies may address this observation.
Our study has many strengths. NHANES is a program of studies that is representative of the civilian non-institutionalized US population, which aids in the generalizability of these results. In addition, NHANES follows a rigorous protocol with extensive quality control procedures for the collection of the exposures (i.e. validated dietary recall methodology [Citation21,Citation22]), outcome of interest and potential confounding factors analyzed and adjusted in this study. Despite these strengths, the current study has several limitations, which may influence the interpretation of these results. First, we relied on a single measurement of total testosterone. Second, although we adjusted for several potential confounders, there is still the possibility of unmeasured confounding from additional factors. However, due to our detailed adjustment for confounders, it is unlikely these would fully account for the observed findings. Finally, NHANES is a cross-sectional study, and there is an inherent bias in the use of surveys for data collection. Thus, these findings should be confirmed in large prospective studies.
Conclusions
In general, we did not find significant linear association between caffeine intake and total testosterone in the total population, but we cannot exclude potential nonlinear associations. Stratification analyses by race/ethnicity and measurements of adiposity seemed to influence the association of caffeine intake with total testosterone. Yet, the role of race/ethnicity and measurements of adiposity in these associations should be investigated in larger prospective studies.
Online_Supplement_Full_Document.pdf
Download PDF (121.3 KB)Disclosure statement
No potential conflict of interest was reported by the authors.
References
- O’Keefe JH, Bhatti SK, Patil HR, et al. Effects of habitual coffee consumption on cardiometabolic disease, cardiovascular health, and all-cause mortality. J Am Coll Cardiol 2013;62:1043–1051.
- Leon-Carmona JR, Galano A. Is caffeine a good scavenger of oxygenated free radicals? J Phys Chem B. 2011;115:4538–4546.
- Freedman ND, Park Y, Abnet CC, et al. Association of coffee drinking with total and cause-specific mortality. N Engl J Med. 2012;366:1891–1904.
- Wilson KM, Kasperzyk JL, Rider JR, et al. Coffee consumption and prostate cancer risk and progression in the Health Professionals Follow-up Study. J Natl Cancer Inst. 2011;103:876–884.
- Hsieh CC, Signorello LB, Lipworth L, et al. Predictors of sex hormone levels among the elderly: a study in Greece. J Clin Epidemiol. 1998;51:837–841.
- Wedick NM, Mantzoros CS, Ding EL, et al. The effects of caffeinated and decaffeinated coffee on sex hormone-binding globulin and endogenous sex hormone levels: a randomized controlled trial. Nutr J. 2012;11:86.
- Park M, Choi Y, Choi H, et al. High doses of caffeine during the peripubertal period in the rat impair the growth and function of the testis. Int J Endocrinol. 2015;2015:368475.
- Lopez D. Racial/ethnic differences in the association between energy balance and prostate cancer. In: Platz EA, Berger N, editors. Energy balance and prostate cancer. New York: Springer; 2018. p 21.
- Strom SS, Yamamura Y, Flores-Sandoval FN, et al. Prostate cancer in Mexican-Americans: identification of risk factors. Prostate. 2008;68:563–570.
- Giovannucci E, Michaud D. The role of obesity and related metabolic disturbances in cancers of the colon, prostate, and pancreas. Gastroenterology. 2007;132:2208–2225.
- Allott EH, Masko EM, Freedland SJ. Obesity and prostate cancer: weighing the evidence. Eur Urol. 2013;63:800–809.
- Rohrmann S, Shiels MS, Lopez DS, et al. Body fatness and sex steroid hormone concentrations in US men: results from NHANES III. Cancer Causes Control. 2011;22:1141–1151.
- Lopez DS, Peskoe SB, Joshu CE, et al. Racial/ethnic differences in serum sex steroid hormone concentrations in US adolescent males. Cancer Causes Control. 2013;24:817–826.
- Rohrmann S, Nelson WG, Rifai N, et al. Serum estrogen, but not testosterone, levels differ between black and white men in a nationally representative sample of Americans. J Clin Endocrinol Metab. 2007;92:2519–2525.
- Lopez DS, Rohrmann S, Peskoe SB, et al. Racial/ethnic differences in the associations of overall and central body fatness with circulating hormones and metabolic factors in US men. Int J Endocrinol Metab 2017;15:e44926.
- National Center for Health Statistics. Plan and operation of the Third National Health and Nutrition Examination Survey, 1988-94. Series 1: programs and collection procedures. Vital Health Stat 1994;1:1–407.
- Nyante SJ, Graubard BI, Li Y, et al. Trends in sex hormone concentrations in US males: 1988–1991 to 1999-2004. Int J Androl. 2012;35:456–466.
- Vesper HW, Wang Y, Vidal M, et al. Serum total testosterone concentrations in the US household population from the NHANES 2011-2012 study population. Clin Chem. 2015;61:1495–1504.
- Paduch DA, Brannigan RD, Fuchs EF, et al. The laboratory diagnosis of testosterone deficiency. White Paper 2017. Available from: http://university.auanet.org/common/pdf/education/clinical-guidance/Testosterone-Deficiency-WhitePaper.pdf
- Khera M, Adaikan G, Buvat J, et al. Diagnosis and treatment of testosterone deficiency: recommendations from the fourth International Consultation for Sexual Medicine (ICSM 2015). J Sex Med. 2016;13:1787–1804.
- Ahuja JK, Montville JB, Omolewa-Tomobi G, et al. USDA food and nutrient database for dietary studies, 5.0. Beltsville, MD: U.S. Department of Agriculture, Agricultural Research Service, Food Surveys Research Group; 2012.
- Bleich SN, Wang YC, Wang Y, et al. Increasing consumption of sugar-sweetened beverages among US adults: 1988-1994 to 1999-2004. Am J Clin Nutr. 2009;89:372–381.
- National Center for Health Statistics [Internet]. National Health and Nutrition Examination Survey. 2001–2004 Data documentation, codebook, and frequencies. Dietary interview: total nutrient intakes – first day. Atlanta, GA: National Center for Health Statistics. Available at: https://wwwn.cdc.gov/nchs/nhanes/search/datapage.aspx?Component=Dietary&CycleBeginYear=2001 [last accessed November 2013].
- Lopez DS, Liu L, Rimm EB, et al. Coffee intake and incidence of erectile dysfunction. Am J Epidemiol. 2017 [Aug 23]; DOI:10.1093/aje/kwx304.
- Lopez DS, Wang R, Tsilidis KK, et al. Role of caffeine intake on erectile dysfunction in US men: results from NHANES 2001-2004. PLoS One. 2015;10:e0123547.
- Drewnowski A, Rehm CD. Sources of caffeine in diets of US children and adults: trends by beverage type and purchase location. Nutrients 2016;8:154.
- Ford ES, Giles WH. A comparison of the prevalence of the metabolic syndrome using two proposed definitions. Diabetes Care. 2003;26:575–581.
- Greenland S. Dose-response and trend analysis in epidemiology: alternatives to categorical analysis. Epidemiology. 1995;6:356–365.
- Wendell CR, Zonderman AB, Katzel LI, et al. Nonlinear associations between plasma cholesterol levels and neuropsychological function. Neuropsychology. 2016;30:980–987.
- Donald CM, Moore J, McIntyre A, et al. Acute effects of 24-h sleep deprivation on salivary cortisol and testosterone concentrations and testosterone to cortisol ratio following supplementation with caffeine or placebo. Int J Exerc Sci. 2017;10:108–120.
- Wu BH. Dose effects of caffeine ingestion on acute hormonal responses to resistance exercise. J Sports Med Phys Fitness 2015;55:1242–1251.
- Beaven CM, Hopkins WG, Hansen KT, et al. Dose effect of caffeine on testosterone and cortisol responses to resistance exercise. Int J Sport Nutr Exerc Metab. 2008;18:131–141.
- Svartberg J, Midtby M, Bonaa KH, et al. The associations of age, lifestyle factors and chronic disease with testosterone in men: the Tromso Study. Eur J Endocrinol. 2003;149:145–152.