
 ?Mathematical formulae have been encoded as MathML and are displayed in this HTML version using MathJax in order to improve their display. Uncheck the box to turn MathJax off. This feature requires Javascript. Click on a formula to zoom.
Abstract
Objective: To study red cell distribution width (RDW), RDW to platelet ratio (RPR) and mean platelet volume to platelet ratio (MPR), novel inflammatory markers of routine hemogram, of patients with or without dementia, according to the grade of the disease established by Fazekas’s score in magnetic resonance imaging (MRI).
Methods: A total of 1342 cases that undergone cranial MRI study were retrospectively analyzed. Patients without a previous stroke and over 45 years were enrolled in the study. Demographic and laboratory characteristics of the participants were obtained from institutional computerized database. Subcortical and periventricular white matter were evaluated in axial FLAIR images according to Fazekas’s grading scale. Univariate and multivariate analysis were performed for assessing the predictors of Fazekas’s grading scale.
Results: MPR of Fazekas 0, Fazekas 1, Fazekas 2 and Fazekas 3 groups were 3, 3, 4 and 3%, respectively. MPR difference between study groups was not significant (p = .32). RPR of Fazekas 0, Fazekas 1, Fazekas 2 and Fazekas 3 groups were 6, 7, 7 and 7%, respectively. RPR difference between study groups was significant (p < .001).
Conclusion: We suggest that increased RDW and RPR values may indicate higher Fazekas’s score and dementia in cranial imaging studies. The radiologist should pay particular attention in interpretation of cranial MRI of these patients.
Introduction
Brain tissue rarefaction is a common condition in older population and as well as seen in subjects with cerebrovascular diseases. An important marker of rarefaction in brain is Leukoaraiosis, as known as, white matter hyperintensity, which is also associated with vascular and neurodegenerative disorders [Citation1,Citation2]. Despite it is a radiological sign with a low specificity, its presence may predict neuronal loss, ischemic demyelination, and gliosis and it has also been accepted as a prognostic marker in cerebrovascular diseases [Citation3,Citation4].
Inflammation has an important role in the development of vascular cerebral diseases [Citation5,Citation6]. Therefore, we hypothesized that inflammatory markers could be related with the degree of Leukoaraiosis.
Studies on novel inflammatory markers derived from routine hemogram test are on rise in literature. One of these indices is red cell distribution width (RDW), which refers the size variability of erythrocytes [Citation7]. Association of RDW with various inflammatory conditions has been well-established [Citation8–11]. Association between hemogram parameters and inflammation promoted the research about the association between inflammatory conditions and the novel hemogram derived predictors that are not routinely measured by calculated from the hemogram indices. In this manner, recent studies suggested close relation between inflammation and these hemogram derived inflammatory indices; such as mean platelet volume to platelet count ratio (MPR) [Citation12–15], and RDW to platelet count ratio (RPR) [Citation16,Citation17].
Fazekas’s score is used in grading the periventricular and subcortical white matter in the diagnosis of leukoaraiosis (0: absent to 3: severe leukoaraiosis) [Citation18].
In the present retrospective study, we aimed to observe the association between Fazekas’s scores and RDW, MPR and the RPR values of the patients with dementia and to compare to those in subjects without dementia.
Methods
A total of 1342 cases that undergone cranial magnetic resonance imaging (MRI) study in Radiology Department of our institution between 01.01.2018 and 30.04.2018 were retrospectively analyzed after approval of Abant İzzet Baysal University (AIBU) Ethics Committee for Clinical Researches by 2018/253. A legal consent for the procedure was obtained from each patient. Patients without a diagnosis of stroke and over 45 years of age were enrolled in the study. Demographic and laboratory characteristics of the participants obtained from the database of the institution. Exclusion criteria were as follows: active infection, advanced hepatic or renal disease, recent major trauma or surgery, allergic systemic conditions, stroke, congenital central nervous diseases, vasculitis, multiple sclerosis, intracranial masses, cancer and conditions characterized with increased intracranial pressure.
While 491 subjects were not included in the study cause of age younger than 45 years, 357 cases excluded according to these exclusion criteria and 53 were excluded due to the lack of appropriate laboratory assay.
All MRI assays were performed with a 1.5 T MRI device (Symphony; Siemens, Erlangen, Germany). The slice thickness was 5 mm. T1-weighted images (repetition time (TR)/echo time (TE) = 552/17 ms), T2-weighted images (TR/TE = 4080/103 ms), T2 fluid-attenuated inversion recovery images (TR/TE = 9930/114 ms). Subcortical and periventricular white matter were evaluated in axial FLAIR images according to Fazekas’s grading scale. In Fazekas’s grade, 0 score applied to absent or dot-shaped signal, 1 score applied to multiple dot-shaped lesions, 2 score applied to unified lesions and 3 score applied to large confluent lesions. According to this grading scale, study population grouped into four; Fazekas 0, Fazekas 1, Fazekas 2 and Fazekas 3 groups.
Hemogram parameters, such as white blood cell count (WBC), hematocrit (Htc), mean corpuscular volume (MCV), RDW, platelet count (PLT) and mean platelet volume (MPV) were obtained from routine hemogram tests. MPR was calculated by division of MPV by PLT and RPR was calculated by division of RDW by PLT.
Statistical analyses were conducted with SPSS software (SPSS 15.0 for Windows, IBM Co., Chicago, IL, USA). Univariate analyses were performed using One-Way ANOVA. and chi-square tests. In addition, multivariate analysis was conducted using logistic regression analysis for identifying independent predictors of the degree of leukoaraiosis and the odds ratio (OR) for each predictor was calculated after adjusting for the effects of the other variables. Pearson correlation analysis was used to observe correlation between Fazekas’s score and study parameters; RDW, MPR, and RPR. Statistical significance was set on p values lower than .05.
Results
The study population consisted of 449 subjects (258 in Fazekas 0, 114 in Fazekas 1, 47 in Fazekas 2 and 30 in Fazekas 3 groups). Age of the Fazekas 0, Fazekas 1, Fazekas 2 and Fazekas 3 groups were 57.41 ± 9.12, 67.26 ± 10.28, 66.72 ± 9.82 and 73.13 ± 9.34 years, respectively. Age difference between study groups was statistically significant (p < .001) ().
Table 1. General characteristics and univariate analysis of laboratory data for study groups.
106 of 258 (41%) in Fazekas 0 group, 47 of 114 (41%) in Fazekas 1 group, 22 of 47 (47%) in Fazekas 2 group, 18 of 30 (60%) in Fazekas 3 group were men. 152 of 258 (59%) in Fazekas 0 group, 67 of 114 (59%) in Fazekas 1 group, 25 of 47 (53%) in Fazekas 2 group, 12 of 30 (40%) in Fazekas 3 group were women. Gender difference between study groups was not statistically significant (p = .23) ().
WBC (p = .27), Htc (p = .047), MCV (p = 0.19) and MPV (p = .29) of the study groups were not statistically different. Characteristics of the study groups were summarized in .
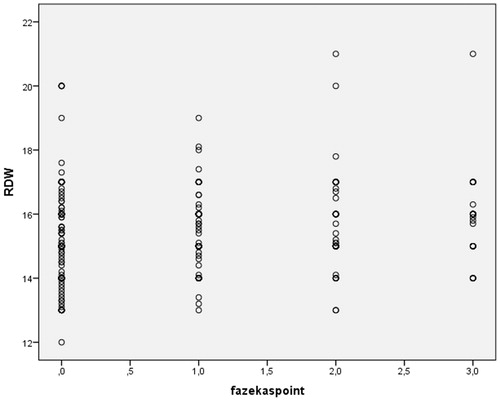
The RDW of Fazekas 0, Fazekas 1, Fazekas 2 and Fazekas 3 groups were 15.14 ± 1.26, 15.41 ± 1.03, 15.73 ± 1.49 and 15.89 ± 1.35%, respectively. RDW difference between study groups was statistically significant (p = .001) () ().
Figure 1. Correlation between Fazekas’s score and RDW.
The MPR of Fazekas 0, Fazekas 1, Fazekas 2 and Fazekas 3 groups were 0.03 ± 0.01, 0.04 ± 0.01, 0.04 ± 0.01 and 0.04 ± 0.01%, respectively. MPR difference between study groups was not statistically significant (p = .04) ().
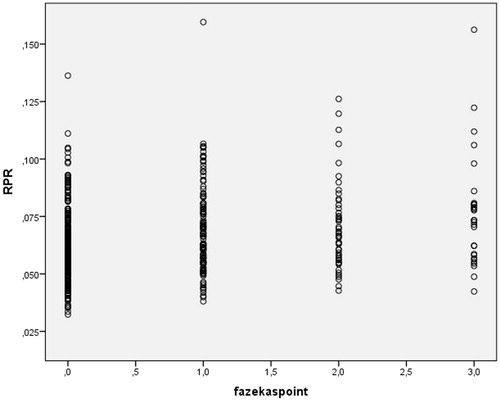
The RPR of Fazekas 0, Fazekas 1, Fazekas 2 and Fazekas 3 groups were 0.06 ± 0.02, 0.07 ± 0.02, 0.07 ± 0.02 and 0.08 ± 0.03%, respectively. RPR difference between study groups was statistically significant (p < .001) () ().
Figure 2. Correlation between Fazekas’s score and RPR.
The PLT of Fazekas 0, Fazekas 1, Fazekas 2 and Fazekas 3 groups were 253.71 ± 59.5, 237.2 ± 61.62, 237 ± 58.26 and 226.83 ± 68.39, respectively. PLT difference between study groups was statistically significant (p = .015) () ().
Figure 3. Correlation between Fazekas’s score and PLT.
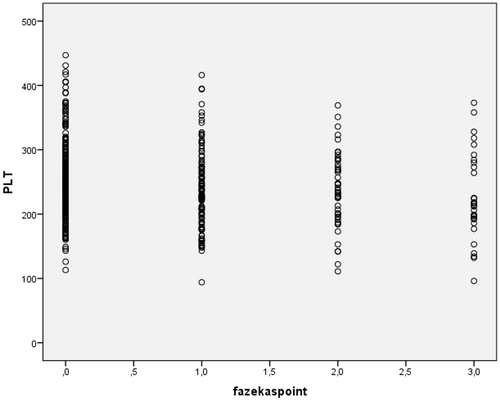
Both RDW (r = 0.19, p < .001) and RPR (r = 0.23, p < .001) were positively correlated with Fazekas’s score. PLT was inversely correlated with Fazekas’s score (r=0.14, p = .002). shows the correlation between Fazekas’s score and RDW, shows the correlation between Fazekas’s score and RPR and shows the correlation between Fazekas’s score and PLT ().
The frequency of type 2 diabetes mellitus (p = 0.31), atherosclerotic heart disease (p = .40) and hyperlipidemia (p = .21) were similar study groups ().
Logistic regression analysis is performed to identify the independent risk factors of Leukoaraiosis after adjusting for other variables (). After controlling for other variables, such as age, DM and Hypertension, RDW was found to be an independent predictor for severe degree of Fazekas score. The patients with elevated levels of RDW have higher probability for obtaining severe degree of Fazekas score. That is the chance of having a Fazeka score of 2 or 3 increased by 32.5% with one unit increase in RDW (OR = 1.325; 95% CI: 1.034–1.699; p = .026).
Table 2. Results of multivariate analysis for prediction of independent predictors of the degree of leukoaraiosis.
Discussion
The main finding of present study is RDW and RPR were significantly elevated and PLT was significantly decreased in patients with greater Fazekas’s score compared to those with lower Fazekas’s score. Moreover, RDW and RPR were positively and PLT was negatively correlated with Fazekas’s score. In this manner, correlation between Fazekas’s score and RPR was stronger than the correlations between Fazekas’s score and RDW and between Fazekas’s score and PLT.
Numerous studies established the diagnostic significance of RDW in literature in inflammatory and vascular diseases [Citation19,Citation20]. Since inflammation promotes anisocytosis by interfering erythropoiesis in bone marrow [Citation21], authors suggested that RDW elevates in inflammatory conditions [Citation22]. Indeed, a positive correlation between inflammatory indices and RDW has been reported [Citation23]. On the other hand, inflammation could play important role in subjects with leukoaraiosis. Umemura et al. [Citation24] reported that endothelial and inflammatory markers were associated with vascular cerebral disease in subjects with type 2 diabetes mellitus. Similarly, Wright et al. [Citation25] found that markers of inflammation were related with the degree of leukoaraiosis. Thus, RDW elevation reported in the present study in subjects with higher Fazekas’s score could be explained via inflammation.
Erythrocyte deformability, which makes erythrocytes able to change their morphology during transition through small vessels, is crucial for maintaining microcirculation and oxygen supply of the tissues. Increased RDW is considered as a marker of erythrocyte deformability [Citation26]. Erythrocytes with reduced deformability may cause deterioration of blood flow in capillaries [Citation27]. Such blockage in cerebral vessels may cause leukoaraiosis and increased Fazekas’s scores in imaging studies. However, it is not clear whether elevated RDW is a cause of leukoaraiosis or it is a consequence of that pathological condition.
Iron deficiency anemia is a condition characterized by decreased hematocrit and MCV and elevated RDW values. Production of normal and small-sized erythrocytes cause anisocytosis and thus, elevated RDW in iron deficiency anemia. Although RDW was significantly increased in patients with higher Fazekas’s score, Htc, and MCV levels of the participants were not different statistically in present study.
There are many studies in literature that reported increased RDW values in various diseases such as atherosclerotic heart disease [Citation22], dyslipidemia [Citation28] and type 2 diabetes mellitus [Citation29]. In a study by Jhan et al reported that the risk of Alzheimer’s disease is higher in subjects with prostate cancer that receive hormone therapy [Citation30].
In present study, the number of subjects with type 2 diabetes mellitus, coronary artery disease and dyslipidemia were statistically similar in study groups. Therefore, we suggest without doubt that increased RDW values in higher Fazekas’s score in our study indicate the degree of underlying leukoaraiosis.
Limitations of present report include retrospective design of the study and selection of the cohort from subjects that visited outpatient radiology clinic of our institution that may not reflect general population. However, to our knowledge, this is the first study in literature that found an association between the degree of Fazekas’s score and hematological parameters; RDW and RPR.
In conclusion, we suggest that increased RDW and RPR values in hemogram may indicate higher Fazekas’s score and dementia in cranial imaging studies. Radiologist should pay particular attention in interpretation of cranial MRI of these patients.
Disclosure statement
The authors declare that there is no conflict of interest.
References
- Nam KW, Kwon HM, Lim JS, et al. Leukoaraiosis is associated with pneumonia after acute ischemic stroke. BMC Neurol. 2017;17:51.
- Pantoni L, Garcia JH. Pathogenesis of leukoaraiosis: a review. Stroke. 1997;28:652–659.
- Grueter BE, Schulz UG. Age-related cerebral white matter disease (leukoaraiosis): a review. Postgrad Med J. 2012;88:79–87.
- Smith EE. Leukoaraiosis and stroke. Stroke. 2010;41:S139–S143.
- Tokgoz S, Kayrak M, Akpinar Z, et al. Neutrophil lymphocyte ratio as a predictor of stroke. J Stroke Cerebrovasc Dis. 2013;22:1169–1174.
- Jin R, Yang G, Li G. Inflammatory mechanisms in ischemic stroke: role of inflammatory cells. J Leukocyte Biol. 2010;87:779–789.
- Dagistan Y, Dagistan E, Gezici AR, et al. Could red cell distribution width and mean platelet volume be a predictor for lumbar disc hernias? Ideggyogy Sz. 2016;69:411–414.
- Aktas G, Sit M, Karagoz I, et al. Could red cell distribution width be a marker of thyroid cancer? J Coll Physicians Surg Pak. 2017;27:556–558.
- Cakir L, Aktas G, Mercimek OB, et al. Are red cell distribution width and mean platelet volume associated with rheumatoid arthritis? Biomed Res. 2016;27:292–294.
- Aktas G, Alcelik A, Ozlu T, et al. Association between omentin levels and insulin resistance in pregnancy. Exp Clin Endocrinol Diabetes. 2014;122:163–166.
- Aktas G, Alcelik A, Tekce BK, et al. Red cell distribution width and mean platelet volume in patients with irritable bowel syndrome. pg. 2014;9:160–163.
- Duman TT, Aktas G, Atak B, et al. Is mean platelet volume to platelet ratio a promising indicator of diabetic regulation in type 2 diabetes mellitus? J Med Res. 2018;4:137–139.
- Kosekli MA, Erkus E, Kocak MZ. Mean platelet volume to platelet ratio as a promising marker of hepatosteatosis. J-Ebr. 2018;1:55–59.
- Atak BM, Erkus E, Duman TT, et al. Mean Platelet volume to platelet and red cell distribution width to platelet ratios in Irritable Bowel Syndrome. J-Ebr. 2018;1:60–63.
- Velioglu Y, Yuksel A. Complete blood count parameters in peripheral arterial disease. Aging Male. 2019;1–5. DOI:10.1080/13685538.2019.1588873
- Taefi A, Huang CC, Kolli K, et al. Red cell distribution width to platelet ratio, a useful indicator of liver fibrosis in chronic hepatitis patients. Hepatol Int. 2015;9:454–460.
- Cetinkaya E, Senol K, Saylam B, et al. Red cell distribution width to platelet ratio: new and promising prognostic marker in acute pancreatitis. World J Gastroenterol. 2014;20:14450–14454.
- Fazekas F, Chawluk JB, Alavi A, et al. MR signal abnormalities at 1.5 T in Alzheimer's dementia and normal aging. AJR Am J Roentgenol. 1987;149:351–356.
- Salvagno GL, Sanchis-Gomar F, Picanza A, et al. Red blood cell distribution width: a simple parameter with multiple clinical applications. Crit Rev Clin Lab Sci. 2015;52:86–105.
- Poludasu S, Marmur JD, Weedon J, et al. Red cell distribution width (RDW) as a predictor of long-term mortality in patients undergoing percutaneous coronary intervention. Thromb Haemost. 2009;102:581–587.
- Öztürk ZA, Ünal A, Yiğiter R, et al. Is increased red cell distribution width (RDW) indicating the inflammation in Alzheimer's disease (AD)? Arch Gerontol Geriatr. 2013;56:50–54.
- Tonelli M, Sacks F, Arnold M, et al. Relation between red blood cell distribution width and cardiovascular event rate in people with coronary disease. Circulation. 2008;117:163–168.
- Fornal M, Wizner B, Cwynar M, et al. Association of red blood cell distribution width, inflammation markers and morphological as well as rheological erythrocyte parameters with target organ damage in hypertension. Clin Hemorheol Microcirc. 2014;56:325–335.
- Umemura T, Kawamura T, Umegaki H, et al. Endothelial and inflammatory markers in relation to progression of ischaemic cerebral small-vessel disease and cognitive impairment: a 6-year longitudinal study in patients with type 2 diabetes mellitus. J Neurol Neurosurg Psychiatry. 2011;82:1186–1194.
- Wright CB, Moon Y, Paik MC, et al. Inflammatory biomarkers of vascular risk as correlates of leukoariosis. Stroke. 2009;40:3466–3471.
- Patel KV, Mohanty JG, Kanapuru B, et al. Association of the red cell distribution width with red blood cell deformability. Adv Exp Med Biol. 2013;765:211–216.
- Cines DB, Lebedeva T, Nagaswami C, et al. Clot contraction: compression of erythrocytes into tightly packed polyhedra and redistribution of platelets and fibrin. Blood. 2014;123:1596–1603.
- Lippi G. Red blood cell distribution width and mean platelet volume: surrogate markers for, or treatment targets in, dyslipidemia? Clin Biochem. 2015;48:555–556.
- Nada AM. Red cell distribution width in type 2 diabetic patients. Diabetes Metab Syndr Obes. 2015;8:525–533.
- Jhan JH, Yang YH, Chang YH, et al. Hormone therapy for prostate cancer increases the risk of Alzheimer's disease: a nationwide 4-year longitudinal cohort study. Aging Male. 2017;20:33–38.