
Abstract
Background
Inflammation is crucial in the pathogenesis of lower urinary tract symptoms (LUTS) in men. Diet modulates inflammation. Therefore, diet could be a modifiable factor in male LUTS prevention and treatment. We aimed to investigate the association between dietary inflammatory potential and male LUTS.
Methods
We used two cycles of National Health and Nutrition Examination Survey (NHANES) with self-report LUTS data. We calculated the dietary inflammatory index (DII) based on a 24 h diet recall and evaluated male LUTS. Clinical LUTS was defined as two or more coexisting symptoms. We used univariate and multivariate logistic regression models, the smooth curve fitting to analyze the relationship between clinical LUTS and the DII score. Subgroup analyses were conducted.
Results
We observed a positive non-linear relationship between clinical LUTS and DII. We found that when DII was higher than the inflection point 2.39, a 1-unit increase in DII was associated with 26.1% higher adjusted odds of clinical LUTS. Subgroup analyses showed that the DII score was only positively correlated with clinical LUTS risk in non-drinkers, smokers, and non-obese people (DII >2.39).
Conclusions
Inflammation might be the key mechanism bridging dietary consumption to male LUTS. Excessive pro-inflammatory food intake (DII >2.39) warrants special vigilance, especially for non-drinkers, smokers, and non-obese men.
1. Introduction
Lower urinary tract symptoms (LUTS) are common in older men, affecting 70% of males over 40 years old in Western countries [Citation1]. Male LUTS are often attributed to the bladder outlet obstruction due to benign prostatic hyperplasia (BPH) and can also be caused by bladder dysfunction. LUTS are a major health care problem due to the great financial burden and impairment of quality of life in older males [Citation2,Citation3]. Studies over the past two decades have provided important information on risk factors of LUTS, including diet, chronic inflammation, obesity, and diabetes, as reviewed by Parsons et al. [Citation4].
Diet modulates systemic inflammation [Citation5,Citation6], which is positively associated with prostatic inflammation [Citation7]. Therefore, a diet with high inflammatory potential may influence prostatic inflammation and lead to LUTS secondary to BPH. Recent studies [Citation8,Citation9] have also shown that inflammation plays a key role in the pathogenesis of bladder fibrosis, resulting in compromised bladder capacity and symptoms like urinary frequency and urgency. The dietary inflammatory index (DII) is a quantitative index to represent the individual intake of pro-inflammatory diets. The first attempt to quantify pro-inflammatory diets was made in 2009 by Cavicchia [Citation10] to predict the CRP in the SEASONS study. In 2014, Shivappa et al. [Citation11] designed and developed a literature-derived, population-based DII. In the next few years, this formula was validated among different populations predicting different systemic inflammatory markers, including interleukin-6, high-sensitivity C-reactive protein, and tumor necrosis factor-α [Citation12–14]. Thus, DII is an appealing approach to quantify the dietary inflammatory potential. Besides, emerging studies have demonstrated that DII was associated with all-cause mortality [Citation15], cardiovascular mortality [Citation16], fragility [Citation17], and risk of genitourinary cancers, including prostate cancer [Citation18] and bladder cancer [Citation19].
In this study, we sought to examine the relationship between dietary inflammation and LUTS. We hypothesized that individuals who consume a higher DII score diet were at a higher risk of LUTS compared with those on a diet of lower DII score.
2. Materials and methods
2.1. Participants
The National Health and Nutrition Examination Survey (NHANES) is a cross-sectional study conducted by the Centers for Disease Control and Prevention, including demographic, socioeconomic, and dietary questions and medical measurements of US citizens. The NHANES examines a nationally representative sample each year. In the NHANES survey, informed consent was obtained from all participants. The National Center for Health Statistics (NCHS) approved the survey and made the data publicly available while maintaining participants confidentially. In this study, we only used the data for the purpose of analyzing and reporting. According to the policies of the West China Medical Center, the use of publicly available data does not require the ethical review or exempt determination of the institutional review board. The NHANES data were available on DataDryad (https://doi.org/10.5061/dryad.d5h62) for public use.
We performed a secondary analysis of data from the two cycles of NHANES with self-report LUTS (2005–2006 and 2007–2008). We included male participants aged between 40 and 85 with complete LUTS data and a calculable DII based on 24 h diet recall. The flowchart of participant selection was demonstrated in Figure S1.
2.2. Variables
We calculated the DII based on the 24-h dietary recall interview conducted in the NHANES. This retrospective assessment method has been validated by the Nutrition Methodology Working Group [Citation20]. The DII, originally designed by Shivappa et al. [Citation11], consists of 45 food parameters, including macro and micronutrients, flavonoids, spices, and food items, each labeled with an inflammatory effect score. However, only 27 of the 45 food parameters were available from the 24-h dietary recall in the NHANES database. Therefore, we used the 27 food parameters in our study to calculate the DII, as per Park et al. [Citation16]. In one previous study [Citation13], the DII formula of 28 food parameters showed no significant decrease in the predicting ability. In the DII scoring system, more negative scores indicate anti-inflammatory diets, while more positive scores indicate pro-inflammatory diets.
Besides, we extracted covariates from the NHANES database, including age, 24-h energy intake, race, body mass index (BMI), smoking history, alcohol consumption, and Charlson comorbidity index [Citation21], the sum of weights of patients’ comorbidities. LUTS was accessed in NHANES by four questions, which included (1) How often have urinary leakage? This question asked about urinary frequency (Question number: KIQ005), (2) Usually have trouble trying to urinate? This question asked about urinary hesitancy (Question number: KIQ081), (3) After urinating, does bladder feel empty? This question asked about incomplete emptying (Question number: KIQ101), and (4) How many times urinate in the night? Nocturia was defined as two or more nightly voids (Question number: KIQ480). This study’s outcome, clinical LUTS, was defined as two or more than two above-mentioned LUTS, as per Fantus et al. [Citation22].
2.3. Statistical analysis
We compared the baseline characteristics of DII quintiles using the Student’s t-test for continuous variables and the chi-square test for categorical variables. We summarized continuous variables by the average and standard deviation and categorical variables by the frequency and percentage. We used univariate and multivariate logistic regression models to analyze the relationship between clinical LUTS (present or not) and the DII (both continuous and quintiles). We adjusted for covariates in the adjusted model, including age, race, Charlson comorbidity index, alcohol consumption, smoking, BMI, and energy intake. The non-linear relationship between DII and clinical LUTS was visualized and determined by the smooth curve fitting and a generalized additive model. We used the trial and error method to determine the inflection point with the maximal model likelihood and conducted a log-likelihood ratio test comparing the one-line linear model with a two-piecewise linear model. We further evaluated the association between DII and clinical LUTS stratified by covariates. We calculated the p for interaction using the log-likelihood ratio test comparing models with and without the interaction of covariates.
All statistical analyses were conducted using R 3.6.1 software (R Foundation for Statistical Computing, Vienna, Austria; http://www.r-project.org/) and EmpowerStats (X&Y Solutions, Boston, MA; http://www.empowerstats.com/). A two-sided p value of less than .05 was considered statistically significant.
3. Results
3.1. Baseline characteristics
There were 2993 male individuals included in our analysis. The distribution of participants’ characteristics was shown in . Men eating a diet of a higher DII were more likely to be older and non-white and reported lower energy intake and less frequent alcohol assumption (p<.05).
Table 1. Distribution of participant characteristics of patients with or without clinical lower urinary tract symptoms (LUTS) in the National Health and Nutrition Examination Survey (NHANES) 2005–2006 and 2007–2008.
3.2. DII and LUTS
As a continuous variable, the DII score was significantly correlated with clinical LUTS in the unadjusted model (odds ratio [OR]: 1.05, 95%CI: 1.00 − 1.11, p=.034). However, after adjustment for covariates, there’s no significant correlation between continuous DII score and LUTS risk (OR: 1.05, 95%CI: 0.99–1.12, p=.117).
When we considered the DII score as a categorical variable with quintiles, we found that, compared with individuals in the lowest DII quintile, those in the highest DII quintile had 36% higher clinical LUTS risk in the unadjusted model (OR 1.36; 95%CI: 1.03 − 1.80, p=.032), and 43% higher risk in the adjusted model (OR 1.43, 95%CI: 1.01–2.03, p=.045) ().
Table 2. Relationship between the dietary inflammatory index (DII) and clinical lower urinary tract symptoms (LUTS) in the Unadjusted and Adjusted Logistic Regression Models.
The adjusted smooth curve fitting revealed a positive non-linear relationship between the DII score and the clinical LUTS risk (p value for log-likelihood ratio test <.05) with the inflection point being 2.39 (). When the DII score was higher than the threshold of 2.39, it is positively correlated with clinical LUTS likelihood (OR 1.26, 95%CI: 1.03–1.54, p=.025). Whereas when the DII score was lower than 2.39, no significant correlation was observed (OR 1.01, 95%CI: 0.93–1.09, p=.850) ().
Figure 1. Dose–response relationship and threshold analysis of the dietary inflammatory index (DII) and the probability of lower urinary tract symptoms (LUTS). A non-linear association between the DII and LUTS risk was found (p value for log-likelihood ratio test <.05) in a generalized additive model. The solid line and dashed line represent the estimated values and their corresponding 95% confidence intervals. Adjustment factors included age, race, Charlson comorbidity index, alcohol consumption, smoking, body mass index, and energy intake. A DII value of 2.39 was found to be the inflection point. The positive correlation between the DII score and the likelihood of clinical LUTS was only observed on the right side of the inflection point (OR 1.26, 95%CI: 1.03–1.54, p=.025). Whereas when the DII was lower than the threshold 2.39, no significant correlation was observed (OR 1.01, 95%CI: 0.93–1.09, p=.850). DII: dietary Inflammatory Index; LUTS: lower urinary tract symptoms; OR: odds ratio.
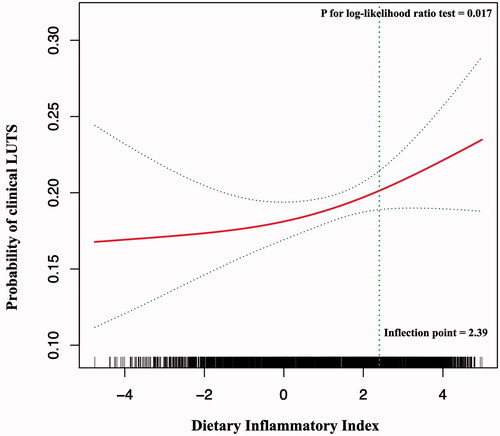
Table 3. Threshold effect analysis of the dietary inflammatory index (DII) on clinical lower urinary tract symptoms (LUTS).
3.3. Subgroup analyses
In the subgroup stratified by alcohol consumption, there is a significant difference in the association between the DII and clinical LUTS risk (p=.048 for the interaction). The DII was only positively correlated with clinical LUTS risk among participants with alcohol consumption up to once a week (overall OR 1.09, 95%CI: 1.01–1.17, p=.022). Among those who drank alcohol up to once a week, on the left and the right side of the inflection point of DII (2.39), the ORs (95%CI) were 1.04 (0.94, 1.16) and 1.50 (1.09, 2.07), respectively. In the subgroup stratified by other covariates, a positive association was also observed on the right side of the inflection point (DII ≥ 2.39) among participants with a BMI <25 kg/m2 (OR 2.48, 95%CI: 1.24–4.94, p=.010) and participants who have smoked at least 100 cigarettes in a lifetime (OR 1.67, 95%CI: 1.18–2.38, p=.004) ().
Table 4. Associations of the dietary inflammatory index (DII) with clinical lower urinary tract symptoms (LUTS) in subgroups of potential effect modifiers.
4. Discussion
In this study, we found that men with a higher intake of the pro-inflammatory diet were at higher risk of clinical LUTS. Furthermore, we revealed a positive non-linear relationship between the DII score and LUTS and determined the inflection point. A diet of a DII score <2.39 might be considered healthy concerning LUTS. The association of the DII score and LUTS risk was stronger among participants who drank alcohol up to once a week, smoked at least 100 cigarettes in a lifetime, and non-obese men (BMI <25 kg/m2). To the best of our knowledge, this is the first epidemiological study to provide evidence of the association between the DII scores and the risk of clinical male LUTS.
Inflammation plays a crucial role in the development of LUTS secondary to BPH. Hussein et al. [Citation23] found that T cells’ density in the benign nodular prostatic hyperplasia specimens was four times higher than that in the normal prostates. A more recent study [Citation24] found not only T cells were positive in 81% of BPH specimens, and macrophages were also positive in 82% of BPH specimens. Moreover, various inflammatory cytokines were upregulated in BPH tissues [Citation25–27]. Among them, interleukin-2, interleukin-7, interferon-gamma, and interleukin-18 have been shown to promote the proliferation of prostate cells in vitro [Citation26,Citation28]. Therefore, prostatic inflammation might initiate continuous tissue damage and wound healing and contribute to prostatic enlargement [Citation29–32]. Apart from prostatic inflammation, systemic inflammation has also been found to be correlated with LUTS. One secondary analysis [Citation33] of the placebo arm of the Prostate Cancer Prevention Trial showed that a high concentration of interleukin-6 in peripheral blood was correlated with a higher risk of BPH. In our previous study, we have confirmed that systemic and prostatic inflammation was intrinsically associated.
Another possible link between inflammation and LUTS is inflammation-induced bladder fibrosis. Lai et al. [Citation9] found that inflammation activated the NF-κB-JMJD3 signaling and promoted proliferation and extracellular matrix deposition of human bladder smooth muscle cells. Further research is warranted to investigate whether the association between LUTS and DII results from inflammation-induced prostatic enlargement or bladder dysfunction. It’s also plausible that both organs are involved.
Previous studies on food and LUTS presented inconsistent data. One case–control study found that milk or dairy products increased the risk of LUTS [Citation34]. However, this finding was rebutted in an Italian study [Citation35] with larger sample size, in which researchers found no association between milk or dairy product and LUTS. Previous studies looked into different kinds of food, including cereal, vegetables, and milk. But this approach had its limitations. Participants who consumed less one specific kind of food might take more other kinds which share similar nutritional components as compensation. This could be the reason for the heterogeneity among previous studies. In our study, we investigated the food pattern using the DII score to quantify the dietary pro-inflammatory potential.
Systemic inflammatory factors could mediate the association between the DII score and clinical LUTS. For instance, a higher DII score was associated with a higher serum interleukin-6 [Citation11]; meanwhile, a higher serum interleukin-6 was predictive of a higher risk of LUTS [Citation33].
Another interesting finding was the non-linear relationship between the dietary inflammatory potential and clinical LUTS. The non-linear relationship suggested pro-inflammatory food consumption beyond the threshold would contribute to the pathogenesis of LUTS. There are two potential explanations for the threshold effect. First, the inflammatory stimuli need to be strong enough to activate components of the immune system. Recent studies revealed that the threshold for inflammatory responses existed at the level of protein complexes like NLRP3 inflammasome [Citation36] and the level of immune cells like T cells [Citation37]. Molecule-level and cell-level thresholds might create the system-level threshold for inflammation-induced LUTS. Second, suppressive compartments of our immune system, such as regulatory T cells (Tregs) [Citation38], allow the human body to tolerate pro-inflammatory stimuli. However, excessive pro-inflammatory food intake beyond the threshold might overwhelm the immune system’s regulatory networks by exhausting Tregs or immune-suppressive cytokines.
Our study had several strengths. First, this study benefited from a large sample size from NHANES, in which both participants’ diet and health data were well recorded. Second, we used the adjusted smooth curve fitting to visualize the relationship between DII and LUTS and conducted the threshold effect analysis.
As a retrospective study, our study had unavoidable flaws. First, the NHANES study was a questionnaire study and carried an inevitable subjective measure error and diet-associated recall bias. Second, our retrospective secondary analysis only revealed the association, but the causality between diet and LUTS has not been validated. Third, the LUTS questionnaire in the NHANES was limited due to inadequate coverage of storage and voiding symptoms. Finally, we did not control for physical activities, which may alleviate male LUTS. Nevertheless, this is the first investigation of the relationship between LUTS and food intake using the DII score, providing preliminary evidence of the pro-inflammatory diet’s impact on LUTS.
5. Conclusion
Inflammation might be the key mechanism bridging dietary consumption to male LUTS. Excessive pro-inflammatory food intake (DII >2.39) warrants special vigilance, especially for non-drinkers, smokers, and non-obese men.
| Abbreviations | ||
| LUTS | = | Lower urinary tract symptoms |
| NHANES | = | National Health and Nutrition Examination Survey |
| DII | = | Dietary inflammatory index |
| OR | = | Odds ratio |
| CI | = | Confidence interval |
| BPH | = | Benign prostatic hyperplasia |
| Tregs | = | Regulatory T cells |
Supplemental Material
Download MS Word (151.8 KB)Acknowledgments
Chi Chen and Xing-Lin Chen (EmpowerStats X&Y Solutions, Inc., Boston, MA) provided statistical methodology consultation.
Disclosure statement
The authors declare that there are no conflicts of interest to report.
Additional information
Funding
References
- Coyne KS, Sexton CC, Thompson CL, et al. The prevalence of lower urinary tract symptoms (LUTS) in the USA, the UK and Sweden: results from the Epidemiology of LUTS (EpiLUTS) study. BJU Int. 2009;104(3):352–360.
- De Nunzio C, Tubaro A. Unmet needs in managing LUTS—a European perspective. Nat Rev Urol. 2012;9(1):9–10.
- Fourcade RO, Lacoin F, Rouprêt M, et al. Outcomes and general health-related quality of life among patients medically treated in general daily practice for lower urinary tract symptoms due to benign prostatic hyperplasia. World J Urol. 2012;30(3):419–426.
- Parsons JK. Benign prostatic hyperplasia and male Lower urinary tract symptoms: epidemiology and risk factors. Curr Bladder Dysfunct Rep. 2010;5(4):212–218.
- Giugliano D, Ceriello A, Esposito K. The effects of diet on inflammation: emphasis on the metabolic syndrome. J Am Coll Cardiol. 2006;48(4):677–685.
- Esposito K, Marfella R, Ciotola M, et al. Effect of a Mediterranean-style diet on endothelial dysfunction and markers of vascular inflammation in the metabolic syndrome: a randomized trial. JAMA. 2004;292(12):1440–1446.
- Liao X, Tang Z, Ai J, et al. Detection of prostatic inflammation from peripheral lymphocyte count and free/total PSA ratio in men With LUTS/BPH. Front Pharmacol. 2020;11:589–589.
- Cantu H, Maarof SNM, Hashim H. The inflammatory contracted bladder. Curr Bladder Dysfunct Rep. 2019;14(2):67–74.
- Lai J, Ge M, Shen S, et al. Activation of NFKB-JMJD3 signaling promotes bladder fibrosis via boosting bladder smooth muscle cell proliferation and collagen accumulation. Biochim Biophys Acta Mol Basis Dis. 2019;1865(9):2403–2410.
- Cavicchia PP, Steck SE, Hurley TG, et al. A new dietary inflammatory index predicts interval changes in serum high-sensitivity C-reactive protein. J Nutr. 2009;139(12):2365–2372.
- Shivappa N, Steck SE, Hurley TG, et al. Designing and developing a literature-derived, population-based dietary inflammatory index. Public Health Nutr. 2014;17(8):1689–1696.
- Tabung FK, Steck SE, Zhang J, et al. Construct validation of the dietary inflammatory index among postmenopausal women. Ann Epidemiol. 2015;25(6):398–405.
- Shivappa N, Steck SE, Hurley TG, et al. A population-based dietary inflammatory index predicts levels of C-reactive protein in the Seasonal Variation of Blood Cholesterol Study (SEASONS). Public Health Nutr. 2014;17(8):1825–1833.
- Wirth MD, Shivappa N, Davis L, et al. Construct validation of the dietary inflammatory index among African Americans. J Nutr Health Aging. 2017;21(5):487–491.
- Garcia-Arellano A, Martínez-González MA, Ramallal R, et al. Dietary inflammatory index and all-cause mortality in large cohorts: the SUN and PREDIMED studies. Clin Nutr. 2019;38(3):1221–1231.
- Park YM, Choi MK, Lee SS, et al. Dietary inflammatory potential and risk of mortality in metabolically healthy and unhealthy phenotypes among overweight and obese adults. Clin Nutr. 2019;38(2):682–688.
- Resciniti NV, Lohman MC, Wirth MD, et al. Dietary inflammatory index, pre-frailty and frailty among older US adults: evidence from the National Health and Nutrition Examination Survey, 2007–2014. J Nutr Health Aging. 2019;23(4):323–329.
- Zhu Y, Li Q, Xu X. Dietary inflammatory index and the risk of prostate cancer: a dose-response meta-analysis. Eur J Clin Nutr. 2020;74(7):1001–1008.
- Shivappa N, Hébert JR, Rosato V, et al. Dietary inflammatory index and risk of bladder cancer in a large Italian case-control study. Urology. 2017;100:84–89.
- Ahluwalia N, Dwyer J, Terry A, et al. Update on NHANES dietary data: focus on collection, release, analytical considerations, and uses to inform public policy. Adv Nutr. 2016;7(1):121–134.
- Charlson ME, Pompei P, Ales KL, et al. A new method of classifying prognostic comorbidity in longitudinal studies: development and validation. J Chronic Dis. 1987;40(5):373–383.
- Fantus RJ, Packiam VT, Wang CH, et al. The relationship between sleep disorders and lower urinary tract symptoms: results from the NHANES. J Urol. 2018;200(1):161–166.
- Hussein MR, Al-Assiri M, Musalam AO. Phenotypic characterization of the infiltrating immune cells in normal prostate, benign nodular prostatic hyperplasia and prostatic adenocarcinoma. Exp Mol Pathol. 2009;86(2):108–113.
- Robert G, Descazeaud A, Nicolaiew N, et al. Inflammation in benign prostatic hyperplasia: a 282 patients' immunohistochemical analysis. Prostate. 2009;69(16):1774–1780.
- Vital P, Castro P, Tsang S, et al. The senescence-associated secretory phenotype promotes benign prostatic hyperplasia. Am J Pathol. 2014;184(3):721–731.
- Kramer G, Steiner GE, Handisurya A, et al. Increased expression of lymphocyte-derived cytokines in benign hyperplastic prostate tissue, identification of the producing cell types, and effect of differentially expressed cytokines on stromal cell proliferation. Prostate. 2002;52(1):43–58.
- Steiner GE, Stix U, Handisurya A, et al. Cytokine expression pattern in benign prostatic hyperplasia infiltrating T cells and impact of lymphocytic infiltration on cytokine mRNA profile in prostatic tissue. Lab Invest. 2003;83(8):1131–1146.
- Hamakawa T, Sasaki S, Shibata Y, et al. Interleukin-18 may lead to benign prostatic hyperplasia via thrombospondin-1 production in prostatic smooth muscle cells. Prostate. 2014;74(6):590–601.
- Briganti A, Capitanio U, Suardi N, et al. Benign prostatic hyperplasia and Its aetiologies. Eur Urol Suppl. 2009;8(13):865–871.
- De Nunzio C, Aronson W, Freedland SJ, et al. The correlation between metabolic syndrome and prostatic diseases. Eur Urol. 2012;61(3):560–570.
- De Nunzio C, Kramer G, Marberger M, et al. The controversial relationship between benign prostatic hyperplasia and prostate cancer: the role of inflammation. Eur Urol. 2011;60(1):106–117.
- Alcaraz A, Hammerer P, Tubaro A, et al. Is there evidence of a relationship between benign prostatic hyperplasia and prostate cancer? Findings of a literature review. Eur Urol. 2009;55(4):864–873.
- Schenk JM, Kristal AR, Neuhouser ML, et al. Biomarkers of systemic inflammation and risk of incident, symptomatic benign prostatic hyperplasia: results from the prostate cancer prevention trial. Am J Epidemiol. 2010;171(5):571–582.
- Lagiou P, Wuu J, Trichopoulou A, et al. Diet and benign prostatic hyperplasia: a study in Greece. Urology. 1999;54(2):284–290.
- Bravi F, Bosetti C, Dal Maso L, et al. Food groups and risk of benign prostatic hyperplasia. Urology. 2006;67(1):73–79.
- Cox LAT. Jr. Risk analysis implications of dose-response thresholds for NLRP3 inflammasome-mediated diseases: respirable crystalline silica and lung cancer as an example. Dose Response. 2019;17(2):155932581983690.
- Scherer A, Noest A, de Boer RJ. Activation-threshold tuning in an affinity model for the T-cell repertoire. Proc R Soc Lond B. 2004;271(1539):609–616.
- Sakaguchi S, Mikami N, Wing JB, et al. Regulatory T cells and human disease. Annu Rev Immunol. 2020;38:541–566.