Abstract
Can network thinking be extended to the broad range of social organization conventionally studies by sociologists? Applying structural thinking to American election data, it is possible to detect a social-economic hierarchy solely from the links among categories, without reference to external numerical indicators of rank. It is possible to detect and verify sensible and suggestive relative social positions for categories of income, education, gender, age, religion, race, party identification, and region – forming correlated hierarchies. The special contribution of the structural analysis is its simultaneous attention to detail and the overview of links, coupled with less dependence on a priori assumptions.
Acknowledgements
I am indebted to Barry Wellman and Brendan J. Murphy, for ideas that shaped this work and to Paul Rosenfield and Bonnie R. Siegal for advice and assistance.
Notes
These materials are based on work supported by the National Science Foundation and a number of other sponsors. Any opinions, findings and conclusions or recommendations expressed in these materials are those of the author and do not necessarily reflect the views of the funding organizations.
The choice of 47 attributes expresses an arbitrary balance between substantive richness, pedagogical simplicity, and numerical stability: very roughly, the number of frequencies corresponds to the square of the number of categories while the number of parameters to be estimated corresponds directly to the number of categories. Perhaps counter-intuitively 47 attributes (as compared to fewer) obtain both an easier computation and a result more easily compared to the familiar substance of the American election data.
It is difficult to generalize about the large family of network graphics routines, but Euclidean space appears to be the usually unstated default geometry in common for network visualization. See The CASOS software suite, http://www.casos.cs.cmu.edu/projects/ora/software.php; UCINET, https://sites.google.com/site/ucinetsoftware/home; Gephi 0.8, https://gephi.org/; NodeXL, http://nodexl.codeplex.com/
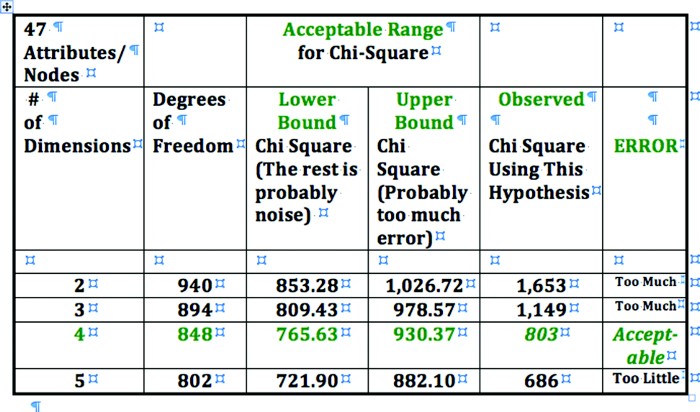
We know that from the goodness-of-fit relative to the degrees of freedom and sample size: in four dimensions, the goodness-of-fit is within the level of noise – after which further analysis is likely to be idiosyncratic and non-reproducible. Adopting chi-square as a convention, chi-square provides a way to evaluate fit and make comparisons among models with different numbers of parameters. For these data, acting as if the fitted frequencies were Poisson distributed, if a model fits, it should show a chi-square equal to the number of degrees of freedom, plus or minus the root of two times the number of degrees of freedom (the mean and twice the standard deviation of a theoretical chi-square distribution). As shown in the table below, comparing the fits achieved in different numbers of dimensions, the goodness of fit suggests that the fit in two dimensions, discussed here, is incomplete – while suggesting that the four-dimensional solution exhausts the reliable information that can be extracted from this sample.