
ABSTRACT
Previous research has shown that people who are in poverty live in deprived neighbourhoods. Ethnic minority groups are more likely than the White majority to be poor and live in such areas. The likelihood of being poor may be reduced by having access to mixed social networks. But, for those living in deprived neighbourhoods there may be neither opportunities nor resources to form and maintain social networks that are mixed in terms of their ethnic or geographic composition. This paper tests this contention, for ethnic groups in the UK. Specifically, we use the UK’s largest household survey to examine the relationship between deprivation and mixing by investigating the following research questions: (1) Does neighbourhood deprivation alter the influence of mixed social network on poverty status? and (2) Is the influence of neighbourhood deprivation and social networks on poverty status equivalent for all ethnic minority groups? Our results suggest that high neighbourhood deprivation tends to over-ride the positive associations of geographically mixed social networks. Moreover, while this result is strong for the White British majority, there is only weak evidence that it holds for ethnic minority groups. This may imply that resource constraints restrict social network benefits, particularly for ethnic minorities.
Introduction
Over recent years there has been increased interest in the beneficial nature of social networks. In the health field particularly, it has been shown that the social support and increased opportunity for social participation that social networks provide positively affect health and well-being (Ferragina, Tomlinson, and Walker Citation2013; Holt-Lunstad, Smith, and Layton Citation2010). There is, however, less understanding and clarity on the relationship between social networks and poverty though it has been established that the people we know and socialise with can provide resources to us: economic, social, and supportive (Crisp and Robinson Citation2010). These resources can provide materials and financial support, help during crises and access to opportunities, including in the labour market (Cattell Citation2012; Gilchrist and Kyprianou Citation2011; Granovetter Citation1973; McCabe et al. Citation2013). From an economic perspective, Chantarat and Barrett (Citation2012, 299) find that ‘social network capital can either complement or substitute for productive assets in facilitating some poor households’ escape from poverty’. From a sociological perspective, the same benefits of social networks have been identified: ‘social networks are key mediators between the harsh circumstances of people’s lives and their lived experience’ (Cattell Citation2004, 142).
There is also a view that social networks are particularly beneficial when the networks themselves are mixed, and there is a need to encourage and enable people to create a diversity of networks, and discourage tendencies for people to choose friends and acquaintances who are similar to themselves on some characteristic: ethnicity, language, gender, age group, geographical location, employment type or a combination of these (McPherson, Smith-Lovin, and Cook Citation2001). The benefit of mixed (or diverse) networks is theorised in terms of providing access (bridging and linking capital: Granovetter Citation1973; McCabe et al. Citation2013) to people in different spheres of resources, A bridging tie – creating more heterogeneous networks – is particularly important in that it can deliver information and opportunities which can improve access to knowledge about employment opportunities, important local services, resources and life chances. It has been suggested that ties between groups, such as race and class, can result in social capital for the disadvantaged (Blokland Citation2008) and the more varied the make-up of a network, the greater the range of resources accessible (Cattell Citation2012).
Another perspective of social networks is that they have a universal positive impact on social well-being. While we might concede that this is true compared to having no friendship network, there is evidence that some network types may lock people into detrimental situations, and restrict social mobility. Such horizontal effects appear when considering the economic aspect of social well-being. This is evident in the limited literature on social networks and poverty: some find that social network capital can rival ‘real’ monetary capital in mediating economic mobility; others claim it is ineffective for the most disadvantaged, especially in highly polarised economies (Chantarat and Barrett Citation2012). It is widely recognised that there are costs associated with establishing and maintaining social networks (Chantarat and Barrett Citation2012; McCabe et al. Citation2013); and that use of social networks can have a negative impact in economic terms.
This suggests that mixing in networks is in itself not enough; the type of mix matters. As McCabe et al. (Citation2013, 5) point out in their qualitative study of poverty and ethnic minority social networks: ‘Where social networks did help people to escape poverty, it was usually through connections into influential, predominantly white, mainstream society.’ Others have also pointed out that mixing cannot be seen as uni-dimensional; it is not solely about ‘ethnicity’ or any single marker of identity or circumstance but about a host of demographic, socio-economic, attitudinal, and value-based characteristics (DiPrete et al. Citation2011; McCabe et al. Citation2013). Ryan (Citation2011, 721) illustrates this in her study of social networks of Polish migrants: ‘Most of the migrants in this paper clearly demonstrated that nationality (simply being Polish) was not enough to guarantee close bonds of friendship. Shared interests, similar careers, education backgrounds, common interests or ambitions all shaped friendships.’
The mixed-ness of networks depends on the opportunity to mix, and this is not equally experienced. Social networks are themselves part of exclusionary social processes which cannot be disassociated from broader socio-economic inequalities. Consequently, there has been some interest in the literature on how place, or neighbourhood, shapes social networks. Characterisations of neighbourhoods, particularly in terms of their ethnic mix, have been employed in studies of social capital, with mixed findings (Finney and Jivraj Citation2013; Putnam Citation2007). Social networks have been looked at in urban contexts (e.g. Blockland and Savage Citation2008) and a key issue raised is how poor residents make their ties productive (Blokland and Noordhoff Citation2008). Poortinga (Citation2012) examines this by testing whether social networks (social capital) can aid resilience or be a buffer to the detrimental impacts of area deprivation on health; he finds that they cannot.
The focus of this paper adds to this literature by investigating the impact of neighbourhood conditions, social network mixedness (diversity) and ethnic minority groups on an individual’s poverty status. The following example illustrates the possible mechanisms that drive our hypothesis, that poor local conditions may negate positive network associations, particularly regarding economic outcomes. Consider a low-waged ethnic minority worker in one sector of the economy. They may have an ethnic group social network that is mixed, in the sense that they have co-workers in the same sector from different minority groups. These co-workers may live in other neighbourhoods and as such give rise to a mixed neighbourhood social network (a social network in which members live in different neighbourhoods from one another). These networks permit our worker to move between similar positions within the same sector, possibly seeking marginal gains such as improvement in working hours or perks. However, they do not permit our worker to move out of this sector. Our low-waged worker is likely to live in a poor neighbourhood and is in a sense locked into their own networks. The deprived neighbourhoods most likely lack social amenities that might allow residents to engage with people outside of their present network, and provide an opportunity for bridging the gap to a better-paid job. This example alludes to the practice of job-seeking through informal networks that may serve to keep some people in poverty (DiMaggio and Garip Citation2012; Hudson et al. Citation2013).
Our investigation uses the UK’s largest longitudinal survey, Understanding Society. Our first analytical step takes a descriptive look at how mixed networks relate to ethnic group poverty, and how neighbourhood deprivation varies for ethnic groups. This is followed by our first statistical model, which examines the joint influence of these and other variables, and answers the question: Does neighbourhood deprivation alter the influence of mixed social networks on poverty status? However, one concern is that the form of social networks may vary across different social groups. We, therefore, extend our statistical model to address a second question: Is the influence of neighbourhood deprivation and social networks on poverty status equivalent for all ethnic minority groups?
In addressing these questions this paper takes an interdisciplinary approach, taking ideas of ‘neighbourhood effects’ from geographical literatures, approaches to studying poverty from economics, and theories of social network mixing from sociology. It is part of a Special Issue that provides new insights into the relationships between ethnicity and place from the perspective of a broader concern with understanding ethnic inequalities in the UK. This interdisciplinary work has been conducted within the Centre on Dynamics of Ethnicity (CoDE), as discussed in Finney et al. (Citation2019), and is one of two pieces involving economic outcomes, the other being the Clark et al. (Citation2019) investigation of labour market integration.
Methods
Data: understanding society
We used Understanding Society Wave 3 (the UK Household Longitudinal Study) which is a survey of over 35,000 households across the UK (University of Essex Citation2015). The study began in 2009 and includes an Ethnic Minority Boost (EMB) Sample, consisting of over 6000 adults, to enable the survey to represent five target ethnic minority groups (Indian, Pakistani, Bangladeshi, Black Caribbean, Black African) as well as the White British population.
Understanding Society is the only dataset in the UK that allows analysis of ethnicity, social network composition, poverty and neighbourhood. Standard data from Understanding Society that are used in this article have been accessed via the UK Data Service. Additionally, special licence data have been obtained for the purpose of investigating neighbourhood deprivation. These contain the Middle Super Output Area (MSOA) of residence of each survey respondent.
Our analyses are undertaken for England, rather than the whole of the UK. This is because of difficulties in making consistent small areas, ethnic group categories and indicators of neighbourhood deprivation for UK constituent countries. Furthermore, given low counts in the survey sample for ethnic minority groups in Wales, Scotland and Northern Ireland our analysis has been confined to England.
Outcome variable: poverty
The standard method of assessing poverty is to calculate a measure using a household’s income. This is available in Understanding Society, which reports monthly incomes at the household level. Using household income means that we can identify poor households precisely, as we can account for intra-household transfers (including income that is earnt by one member of a household but shared between household members), and economies of scale. This measure is also equivalised to account for different household composition, using the OECD modified measure (OECD Citation2013, 174) reported in Understanding Society. As the poverty measure is calculated for households, any analysis using Understanding Society’s individual data refers to the poverty status of someone living in a poor household, rather than an individual being personally poor. This is an important distinction, and needs to be borne in mind when considering the impact of individual characteristics. We defined poverty by the percentage of the population that fell below a cut off income threshold known as a poverty line. The poverty line was set at 60 per cent of the median net equivalised UK household income.
A final adjustment was made to income to relate all incomes to a fixed point in time. The size of the Understanding Society sample is such that data are collected over a two-year cycle, with Wave 3 data collected from 2011 to 2012. This means some people were interviewed at the beginning of the period, and others at the end. To account for this, all incomes have been adjusted for inflation using before-housing-cost Retail Price Index (RPI) monthly deflators. Using these criteria, the poverty line was defined as £971.
Once we defined our poor category using the income variables, we expanded the not poor group into three others: a prosperous category defined as those above 1.67 times the median, and a high and low middle income category for individuals between the median and the prosperous and poor groups respectively. This grading, going along a ‘poverty’ axis from prosperous (1) to poor (4), is the ordinal response variable we use in our models.
Explanatory variables
Ethnicity
Ethnicity is measured in Understanding Society via a question that asks ‘What is your ethnic group?’ and provides 18 categories to choose from that match those used in the 2011 Census. In our analyses, we used 10 categories of ethnic group, shown in . The 10 categories have been constructed from the original 18 by amalgamating similar groups with small sample sizes to obtain a larger sized group whilst retaining substantive meaning of ethnic group categories. The ‘White Gypsy and Irish Traveller’ group (eight people) has been moved into ‘Other White’ category, the four mixed categories into one overarching Mixed ethnic group, and the remaining five ethnic groups (Chinese, Other Asian, Other Black, Arab, and Other ethnic group) are amalgamated in the ‘Other’ ethnic group category. reports ethnic group membership size in our sample.
Table 1. Number and percentage of respondents in each ethnic group, using 10 ethnic group classifications, Understanding Society, Wave 3 (England).
Social network composition
Wave 3 of Understanding Society consists of a series of questions about the composition of the respondent’s friendship network. A number of these questions employ the concept of homophily, or the degree to which a person’s friends are similar to them. These include questions on the ethnicity and geographical distance (neighbourhood) of friends. These questions are used here to produce measures of mixed-ness of social networks. Other dimensions of mixed-ness were asked about in the survey (age, income, education, employment) but composition of friendship networks on these dimensions were either not found to vary between ethnic and income groups in earlier studies (Finney, Kapadia, and Peters Citation2015), or were deemed not pertinent to the mixing focus of this study: race and neighbourhood. We also included an indicator based on a question about the number of close friends an individual has. This is used as a measure of network size.
To summarise the responses to the social network questions about ethnic group and local area (neighbourhood), we have condensed the answer categories into two: mixed network and not-mixed network. A mixed social friendship network has been conceptualised as one where some network members are different from the participant (i.e. more than half, half or less than half of friends share the same characteristic as the respondent in terms of ethnicity or neighbourhood of residence). For the question relating to the proportion of friends living in the local area, there was a fifth response option, ‘none’. This was amalgamated with ‘more than half’, ‘about half’ and ‘less than half’.
Neighbourhood characteristics
Neighbourhood has been defined as MSOA and Special Licence Understanding Society data were obtained with MSOA of place of residence attached to individuals’ records. MSOAs are an official statistical boundary and there are 7,201 MSOAs in England and Wales (2011 boundaries). MSOAs have populations between 5000 (2000 households) and 15,000 (6000 households) people. This is roughly comparable to the size of electoral wards. Although it could be argued that MSOAs are rather large to be classed as neighbourhoods (see Lloyd, Shuttleworth, and Wong Citation2014), there are both statistical and conceptual reasons why this scale is appropriate for this study. Although Understanding Society has a large sample for surveys of this type, and the sample is geographically spread out, any one small area of the UK contains few survey respondents. Working with local areas smaller than MSOA, where (on average) 35,000 households are spread over 7000 areas, reduces the robustness of statistical comparison of areas. Furthermore, it has been demonstrated that MSOA scale is capable of discerning ‘neighbourhood influences’ in relation to the deprivation and ethnic mix of the areas (e.g. Becares et al. Citation2011; Finney and Jivraj Citation2013). Conceptually, the sense of neighbourhood as an area that could be walked across in quarter of an hour is captured by MSOAs apart from for very rural areas; and the correspondence of MSOA and ward scale has practical meaning for residents in relation, for example, to school ‘catchments’ and political representation.
Neighbourhood deprivation is the focus of our analysis. We have measured deprivation using the 2010 Index of Multiple Deprivation (IMD) for England (DLCG Citation2011). An IMD score has been matched to each individual in the Understanding Society dataset according to their MSOA of residence. This involves some data manipulation of IMD data that are provided for Lower Super Output Areas (LSOAs) at 2001 boundaries. IMD scores for LSOAs were averaged to provide MSOA IMD scores (2001 boundaries). IMD scores were then calculated for MSOAs at 2011 boundaries by allocating the same IMD score to areas created as a result of division of MSOAs between 2001 and 2011; and giving an average of IMD scores to MSOAs that were created from aggregation of areas between 2001 and 2011.
Control variables
We employed a group of variables commonly used when modelling poverty to act as controls in our models. These are used as they are representative of other explanations as to why an individual may be in poverty. This set of variables does not constitute all those that may be of interest for the general problem of modelling income levels. However, they are sufficient to act as a comparator for gauging the strength of whether or not an individual’s friendship network has an association with their poverty status. They are comprised of individual and household characteristics which are noted in the third paragraph of the following section.
Methods of analysis
The first stage of the analysis consisted of descriptive work, detailing the ethnic group composition of individuals with mixed networks who are poor or not, and looking at the distribution of ethnic groups over the neighbourhood deprivation range. The second and third stages used statistical models to investigate our two research questions.
The statistical model(s)
We used a multi-level ordered logit model to establish if social network composition could predict an individual’s state of poverty. This model has an ordered response, which we use to enable a finer grading of the income distribution for our individuals rather than a binary state of in poverty or not.
This modelling decision requires some clarification as the natural first step would be to use a standard logit model. This was tried, but the results did not allow us to pursue an investigation into one focus of our study: the trade-off between neighbourhood deprivation and social networks. The poor category is quite small (∼15%) compared to not poor, which suggested pursuing a different response variable. One alternative would to use a different definition of poverty; however, this could be viewed as somewhat arbitrary and could be less accessible to readers compared to the present headcount poverty measure. Another alternative would to do a quantile regression analysis of the income distribution, which would produce different equations for each quantile under study. Notwithstanding issues regarding the measurement of income, this approach was deemed to be unduly complex for the research questions under consideration. Our model is in a sense an intermediate step towards such a model. We use ordinal categories to get some access to the income range, but also retain a single equation for modelling. Given we have categories that range from prosperous to poor, we look at how our variables are associated with being poorer or not, rather than in poverty or not.
The model categories are predicted using the social network composition variables and control variables, with neighbourhood random effects and neighbourhood IMD score in the model specification. The neighbourhood level random effect is indicated by an individual residing in a particular MSOA.
The first set of variables included in the models was a group of control variables consisting of (a) individual characteristics: age, gender, number of dependent children, legal marital status, economic activity status, highest educational qualification; and (b) household characteristics: housing tenure and region of residence: as we are dealing only with England, this is just split between London and the rest of England, which was the reference category.
The models also include a categorisation of the responses to the question asking for the number of close friends. This was split into a reference category of zero or 1 friends, and the following categories: 2 friends, 3 or 4 friends, 5 to 7 friends, 8 or 9 friends and 10 or more friends (each with a 0/1 indicator in the model). This merging of the counts to categories, including the combination of zero and 1 as the reference category, was tested statistically, with 10 set as the ceiling due to relatively small number of respondents having a very large number of friends.
Neighbourhood is introduced into the model in two ways: by using IMD score (as a continuous variable) and by using the MSOA indicator to introduce geographic random error into the model (the relationship between social networks and poverty grade is allowed to vary according to individuals’ neighbourhood of residence). In other words, we can control for where an individual lives and assess whether this, and the deprivation of the area, are significant independent of other (individual and household) factors we have seen to be important for understanding how social networks affect poverty.
The mixed-ethnic group social network indicator and mixed-neighbourhood social network indicator were entered into the models as binary variables: mixed-ethnic group network (1)/not mixed-ethnic group network (0); mixed-neighbourhood network (1)/not mixed-neighbourhood network (0). Thus, the models indicate the association between friendship network mix and poverty status.
The IMD score is present in all models, though a key difference in model specification depends on how it is combined with the social network variables. For the first model, it is combined with the mixed social network indicators to create interaction terms for these two network variables. These IMD/network interaction terms are particularly important as it is these that allow us to assess: (I) if the network variables work independently from neighbourhood deprivation (which would be indicated by insignificant interactions), and (II) at what point on the deprivation scale any mixed network impact on poverty status changes. The model is estimating the influence of two underlying lines, one solely due to the IMD score from some base a (a + b*IMD) and another that includes the mixed network variable (c) and its interaction with IMD (d) (a + c+(b + d)*IMD). If we believe (I) holds, then the crossover point on the IMD scale, if it exists, can be found as –c/d.
For the next model specification, each binary network variable was subdivided by ethnic group to enable us to see if the effect of a mixed network was different for each. However, there would be issues if the same IMD/network interaction variable as the first round were retained in its original form, as it could be viewed as: (a) enforcing the restriction that the interaction holds for each group, and (b) restricting any crossover point to a single common value. This meant we needed a specific line for each ethnic group, rather than a common one. This was achieved with a further breakdown by ethnic group of the original IMD/network variable. Note that this final specification was equivalent to adding interaction terms between the network effect and ethnic minority groups, and then interacting these with the IMD. All analyses were carried out using Stata 14 (StataCorp. Citation2015).
Results
The relationship between ethnicity, mixed networks, and poverty
We first present descriptive statistics of how the relationship between poverty and mixed social networks varies by ethnic group. shows the proportion of those in poverty and those not in poverty in each ethnic group who had ethnically mixed social networks (left graph a), and mixed neighbourhood social networks (right graph b).
Figure 1. (a) Percent of ethnic group with mixed-ethnic network, by poverty status and (b) percent of ethnic group with mixed-neighbourhood network, by poverty status.
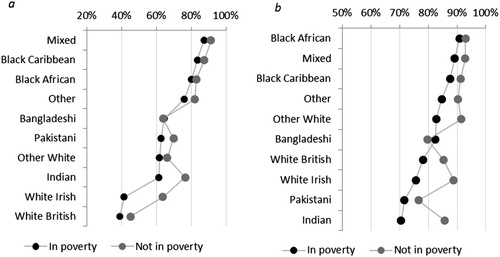
For most ethnic groups (with the exception of the Bangladeshi group), those in poverty were less likely to have ethnic or neighbourhood mixed networks, compared to people not in poverty. The differences between those in poverty and those not in poverty in the ethnic mix of friendship networks (left, graph a), is particularly marked for the White Irish and Indian ethnic groups. For Indians, for example, 22 percentage points more people not in poverty had ethnically mixed social networks compared to those in poverty. A similar pattern arises when considering the geographically mixed networks (right, graph b). The difference between poor/not poor in percent with mixed networks is again largest for the Indian and White Irish group (15 and 13 percentage points). Overall, however, a point to note is that the gaps between the poor and not poor group in percent with mixed social networks is quite narrow for most ethnic groups.
Which ethnic groups live in the most deprived neighbourhoods?
For participants living in England, we were able to use the IMD to ascertain which ethnic groups lived in the most deprived areas. The median IMD scores for Pakistani, Bangladeshi, Black African, and Black Caribbean groups were the highest in the Understanding Society sample, indicating that these groups were the most likely to live in deprived neighbourhoods. White British and White Irish groups were the least likely to live in deprived neighbourhoods ().
Figure 2. Deprivation score (IMD) of neighbourhoods of residence for ethnic groups (box plots indicating median, interquartile range and range of deprivation scores).
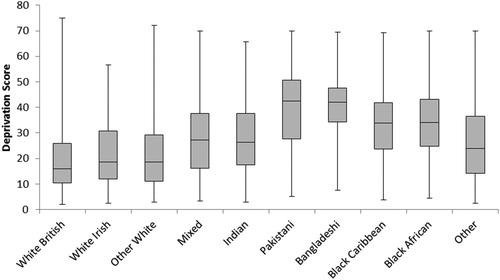
The IMD score scale is not a symmetric linear scale, so some care needs to be taken when viewing . The median IMD score for MSOAs in England is in fact just below 20, which places the majority of the White ethnic groups as residing in the half with the least deprived neighbourhoods (i.e. in neighbourhoods with IMD below 20). In contrast, the majority of the remaining ethnic groups, and more than 75% for the Pakistani, Bangladeshi, Black Caribbean and Black African groups, reside in neighbourhoods that are more deprived than average (i.e. IMD scores above 20).
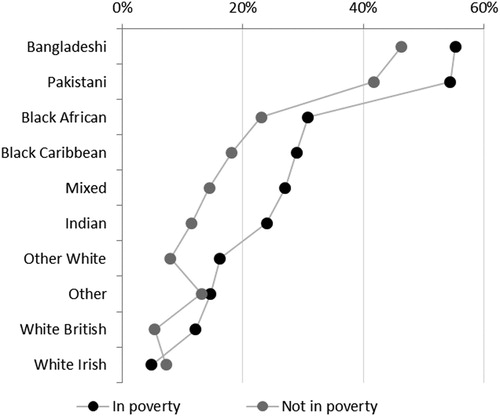
presents the proportion of poor and not-poor individuals in each ethnic group who lived in the most deprived areas, defined as areas in the bottom 10% of IMD scores (just above 40 on ). Pakistani and Bangladeshi groups were the most likely to live in the most deprived neighbourhoods, regardless of whether individuals lived in poverty or not. White British and White Irish groups were the least likely to live in deprived neighbourhoods.
Figure 3. Percentage of ethnic group living in the most deprived neighbourhoods (bottom 10% on IMD score) by poverty status.
Neighbourhood deprivation and the impact of mixed networks on poverty status
The results from our first statistical model are presented in and . These report the odds ratios for the explanatory variables used in the model, which consist of the control variables () and social network and neighbourhood variables. These last two groups of variables, along with structural variables specific to the multi-level ordinal model, are reported in .
Table 2. Multilevel model showing predictors of an individual’s poverty status: control variables only.
Table 3. Multilevel model showing predictors of an individuals’s poverty status continued: network, neighbourhood and model specific variables.
First, recall that we are using an ordinal model and as such the odds are not of whether an individual is in poverty or not, but of whether an individual is becoming poorer or not. That is, we are looking at individual’s probability of moving towards poverty rather than being in poverty. Odds ratios above one increase the chance of becoming poorer, while odds ratios below one decrease that chance.
Second, as we are using categories of poverty that are calculated from household income, how concerned should we be about modelling this using individual data? Issues related to what is known as assortative mating patterns in the economics literature, or selective partnering in geography/demography, imply that households contain people with similar individual characteristics. This suggests there should be minimal concerns regarding interpretation of our educational and employment individual characteristics, and as only 5.8% of households contain multiple ethnicities, we conjecture that this will have a limited bias on the interpretation of ethnicity based variables.
Third, although we are using a model-based approach for our analysis (Snijders and Bosker Citation2012, chapter 14), this does not correct for attrition. We are using wave 3 of Understanding Society as a cross-sectional data set, but it is not the original survey sample and the data have drifted away from the original respondents present at wave 1 (Lynn et al. Citation2012). If we examine the attrition rates for our ethnic group categories, we find that the least attrition occurs for the White majority group (28% of wave 1 respondents have disappeared), while the most attrition occurs for the Bangladeshi group (44%). As lower income groups are also more likely to drop out, this could result in fewer poorer people in wave 3 than there should be, with this being exacerbated for the ethnic minority groups as they leave the study at a greater rate than the White majority. This suggests any association of an individual’s characteristics with being poorer could be weaker than for a scenario with no attrition. However, the situation is more complex because of the addition of extra sample members after wave 1 (e.g. Understanding Society absorbed the British Household Panel Study at wave 2), the varying attrition rate by individual characteristic (Lynn et al. Citation2012), and our social network variables not being collected before wave 3.
Notwithstanding these issues, the majority of the controls increase the odds of being poorer, with the strongest effect being that of being unemployed, which takes a value of 5.01. All our sets of controls are significant below the 1% level (sets with multiple members are tested jointly). Further, the marital status, education, and employment status variables all do what one expects, and give worse odds than their baselines of married (in a partnership), undergraduate degree, and paid employment respectively. The household tenure categories also show worse odds than the baseline of home ownership with a mortgage, which seems contradictory for the case of outright home ownership. This relationship also holds if we model household poverty solely with this set of tenure categories, so we must conjecture that something else is happening, possibly related to asset rich (home owners) cash poor (low income) individuals. Investigating this and other aspects of the controls, such as the impact of lone parenthood, is beyond the scope and focus of the present study but would warrant further investigation.
The magnitude of the odds ratios of most of the control variables in dominates those of the network effects which are reported in . Although all the main network variables reduce the odds of being poor, the strongest reduction is 0.62 for those with 8 or 9 close friends.
In the case of our mixed ethnic group friendship variable, the interaction with IMD score is not significant, which suggests that the influence of this network variable is unaffected by neighbourhood deprivation. However, while the main IMD score variable is highly significant, with an odds ratio of 1.013 (indicating that a higher deprivation score increases the odds of being poor), the main mixed ethnic group friendship variable is only significant at the 5% level. While its value of 0.91 does reduce the odds of being poorer, this is not a strong association when compared to the other discrete control variables.
For the mixed geographic friendship network, the interaction with the IMD score is significant, at the 1% level. The main variable is also similarly significant with an odds ratio of 0.76, and in the expected direction, reducing the odds of becoming poorer. So, the model results suggest that the influence of having a geographically mixed social network on poverty is affected by the deprivation level of the neighbourhood an individual lives in. Given these results, the odds for having mixed friendship networks, compared with having non-mixed friendship networks, is most advantageous in terms of improving poverty status for those living in the least deprived areas and seems to be disadvantageous in terms of poverty status for those living in the most deprived neighbourhoods of England.
Q1. Does neighbourhood deprivation alter the influence of mixed social network on poverty status?
We address this first research question by considering the coefficient estimates (the logs of the odds ratios) for our IMD and mixed network variables in more detail. These are used to produce . This shows the probability of becoming poorer (vertical axis) according to the IMD score of a neighbourhood (horizontal axis) for those with a mixed neighbourhood friendship network (solid line) compared with those without a mixed neighbourhood network (dotted line). The probability of becoming poorer has been set to a starting point of 10 per cent; this absolute level is not the focus of the charts, rather they show how this probability changes as neighbourhood deprivation (IMD score) increases. As expected, the higher the level of deprivation of a neighbourhood, the higher the probability of becoming poorer, whatever the nature of an individual’s friendship network. What is notable, however, is the relative probability of people with mixed friendship networks compared to those without, and the position at which the dotted line crosses the solid.
Figure 4. The likelihood of an individual being poorer by neighbourhood deprivation, for those with and without a mixed neighbourhood social network.
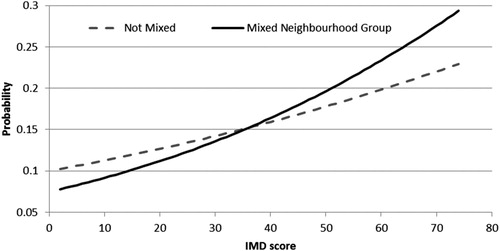
The crossing point can be calculated from the coefficients for the network variable and interaction terms to give a value of 36.1. To put this in context, the positive impact of having a mixed neighbourhood friendship group disappears for people living in the bottom 10% of the deprivation scale, i.e. it vanishes for those in the most deprived areas.
Q2. Is the influence of neighbourhood deprivation and social networks on poverty status equivalent for all ethnic minority groups?
We investigate this using an extended specification of the previous model. The mixed ethnic-group friendship variable had no significant interaction with the IMD score, and we, therefore, do not consider this interaction effect any further. We have rolled out the interactions and main effect for the mixed neighbourhood friendship variable by calculating them directly for each ethnic group. This gives 10 dotted lines to estimate per model, rather than the single ones presented in , with the results being reported in . For reasons of brevity and focus, we have restricted the presentation to the network and neighbourhood variables only.
Table 4. Network and neighbourhood variable model results for ethnic groups.
For the majority of ethnic groups the associated geographically mixed network variable, and its combination with the IMD score, was not statistically significant. Only the White majority, Indian and Other White groups report significant social network and interaction variables. All of these lines have the same pattern as , implying a mixed neighbourhood friendship network reduces the odds of becoming poorer only up to a specific level of deprivation. displays the location in the deprivation range for the crossover points implied by the results in .
Table 5. The position in the UK neighbourhood deprivation score distribution at which having a mixed neighbourhood friendship no longer reduces the likelihood of being poorer, by ethnic group.
Compared to the single interaction term presented in , the crossover point for the White British majority has stayed about the same, but is not repeated for the other groups The Indian group is displaying a crossover point at a higher absolute level of deprivation than the White British and Other White cases. This is giving a somewhat distorted impression, as the starting level for an ethnic group’s position is different, which we have observed in the within-group distributions presented in . To compensate for this, we also report the distance between the crossover point’s location and the ethnic group’s median neighbourhood IMD.
In summary, we have seen from our first statistical model that high levels of local area deprivation override the positive benefits of an individual having a geographically mixed social network. This result, however, does not repeat itself for the ethnically mixed social networks. When we extend the analysis to compare having a geographically mixed network by ethnic group, the impact is only significant for the White British majority, Other White and Indian ethnic minority groups.
Conclusions
Recent years have seen policy and research interest in the significance of social networks for people’s circumstances, and it has been found that having social networks can be beneficial for health and wellbeing (Ferragina, Tomlinson, and Walker Citation2013). The contention has also been raised that social networks can be economically beneficial by providing information and resources – bridging capital – that can enable individuals to avoid or even escape poverty (Crisp and Robinson Citation2010). Work in the literature has supported this contention and suggested that the nature and role of social networks may differ between ethnic groups (McCabe et al. Citation2013). However, social networks do not have an isolated effect on poverty determination, and there may be an important role for place, in the context of area of residence, to impact on both poverty and the ability to form and maintain social networks. This is particularly important for ethnic minorities, as we have seen in , the majority of most of the ethnic minority groups in England reside in neighbourhoods in the lower half of the area deprivation scale, with this being particularly acute for the Bangladeshi group. This study aimed to further investigate whether there is any empirical link between social networks and area that may affect the poverty status of ethnic groups in the UK. To do this we have made use of the UK Household Longitudinal Study (Wave 3), Understanding Society for individuals residing in England.
The level of deprivation in a neighbourhood alters the relationship between mixed social networks and poverty status
The neighbourhood in which you live, and the deprivation of that neighbourhood, matters: the level of deprivation of neighbourhood affects the relationship between an individual’s social network mixed-ness and their poverty status. Our results show that this holds for networks that are geographically mixed (when an individual has friends who live in a different area from them). Having friends from outside as well as within your neighbourhood is associated with lowering the probability of poverty, and this is strongest for those living in areas of lower deprivation. In other words, people living in the least deprived neighbourhoods are most likely to have a lower risk of poverty associated with having geographically mixed social networks.
One reason for this could be that better off people, in the sense here of those living in better (less deprived) areas, have higher quality social networks, and these allow individuals to reduce the probability of being poor, rather than maintaining it at the same level. The study by Lancee (Citation2016) also makes a similar observation when investigating the German immigrant job market: Better off individuals are able to exploit bridging social capital more than the least well off.
An underlying cause for this could be the resource constraints implied by area deprivation, rather than the lack of opportunities for mixing. Indeed, as our network of interest is one that is geographically mixed, this implies an increase in opportunities as the friendship area varies over a larger catchment zone than one that is confined to a single area.
However, our conclusions are not as obvious when we move to our extended model analysis and consider the effect of mixed geographic networks and neighbourhood deprivation by ethnic group. Only the Indian and Other White group manifests similar effects to the White British majority cases. According to , the Bangladeshi group in particular is tightly clustered around its median IMD score, and located, along with the Pakistani median, at the lowest group median position: in the bottom quintile of neighbourhoods in terms of deprivation. These groups are already at, or beyond, the absolute position for the White British groups at which area deprivation negates the benefits of a geographically mixed network. They are, therefore, unlikely to have the resources to form and maintain a beneficial geographically mixed network to begin with. If the type of geographic mixing is also confined to being co-ethnic, then for the Bangladeshi group in particular, it will have a higher chance of being linked with areas that are also very deprived, resulting in a lower quality network in that there is unlikely to be a bridging link towards information and opportunities that could alleviate poverty. This echoes the point made by McCabe et al. (Citation2013, 5): it is the type of mix that matters. It appears that access to the type of social network mix that does matter for improving poverty status is restricted for some ethnic minority groups. This also has implications for any policy designed to address an ethnic group’s ability to build and maintain quality networks, as more investment will be needed given their local conditions impart what could be viewed as a neighbourhood deprivation penalty.
While the Understanding Society data set has allowed us to model the association between social networks, area deprivation and poverty status by different ethnic minority groups (and is, indeed, the only UK data to allow this), it also presents a limitation of this study. Our networks are ego networks and as such we do not know who connects to whom and we are unable to assess either network quality or whether the links are useful for bridging. A second limitation is that our model is purely an associative or predictive one. Some of our control variables are of the type used in network formation models, and our outcome variable, poverty, could also impact on network formation. Further, if you are poor you will be less able to afford to maintain a quality network, particularly one that is geographically spread out. Both of these limitations are directions for future research that could augment understandings from this paper, that neighbourhood deprivation alters the influence of mixed social network on poverty status and differently so for ethnic groups.
Acknowledgements
The authors would like to thank the special issue editors and referee for helpful comments on an earlier draft. Any errors are the responsibility of the authors.
Disclosure statement
No potential conflict of interest was reported by the authors.
Additional information
Funding
References
- Becares, L., M. Stafford, J. Laurence, and J. Nazroo. 2011. “Composition, Concentration, and Deprivation: Exploring their Association with Social Cohesion among Different Ethnic Groups in the UK.” Urban Studies 48 (13): 2771–2787. doi: 10.1177/0042098010391295
- Blockland, T., and M. Savage, eds. 2008. Networked Urbanism: Social Capital in the City. Aldershot: Ashgate.
- Blokland, T. 2008. “Gardening with a Little Help from Your (Middle Class) Friends: Bridging Social Capital Across Race and Class in a Mixed Neighbourhood.” In Networked Urbanism: Social Capital in the City, edited by T. Blockland and M. Savage, 147–170. Aldershot: Ashgate, Chapter 8.
- Blokland, T., and F. Noordhoff. 2008. “The Weakness of Weak Ties: Social Capital to Get Ahead among the Urban Poor in Rotterdam and Amsterdam.” In Networked Urbanism: Social Capital in the City, edited by T. Blockland and M. Savage, 105–126. Aldershot: Ashgate, Chapter 6.
- Cattell, V. 2004. “Social Networks as Mediators between the Harsh Circumstances of People’s Lives, and Their Lives Experience of Health and Well-Being.” In Social Networks and Social Exclusion: Sociological and Policy Perspectives, edited by C. Phillipson, G. Allan, and D. Morgan, 142–161. Aldershot: Ashgate, Chapter 9.
- Cattell, V. 2012. Poverty, Community and Health. Basingstoke: Palgrave Macmillan.
- Chantarat, S., and C. B. Barrett. 2012. “Social Network Capital, Economic Mobility and Poverty Traps.” Journal of Economic Inequality 10: 299–342. doi: 10.1007/s10888-011-9164-5
- Clark, K., L. Garratt, Y. Li, K. Lymperopoulou, and W. Shankley. 2019. “Local Deprivation and the Labour Market Integration of New Migrants to England.” Journal of Ethnic and Migration Studies 45(17): 3260–3282. doi:10.1080/1369183X.2018.1481000.
- Crisp, R., and D. Robinson. 2010. “Family, Friends and Neighbours: Social Relations and Support in Six Low Income Neighbourhoods.“ Living Through Change Research Paper No. 9. Sheffield: Centre for Regional Economic and Social Research (CRESR), Sheffield Hallam University.
- DCLG. 2011. The English Indices of Deprivation 2010, Department for Community and Local Government, Crown Copyright.
- DiMaggio, P., and F. Garip. 2012. “Network Effects and Social Inequality.” Annual Review of Sociology 38: 93–118. doi: 10.1146/annurev.soc.012809.102545
- DiPrete, T. A., A. Gelman, T. McCormick, J. Teitler, and T. Zheng. 2011. “Segregation in Social Networks Based on Acquaintanceship and Trust.” American Journal of Sociology 116 (4): 1234–1283. doi: 10.1086/659100
- Ferragina, E., M. Tomlinson, and R. Walker. 2013. Poverty, Participation and Choice: The Legacy of Peter Townsend. York: Joseph Rowntree Foundation.
- Finney, N., K. Clark, and J. Navroo. 2019. “Opportunities and Challenges Doing Interdisciplinary Research: What Can We Learn from Studies of Ethnicity, Inequality and Place?” Journal of Ethnic and Migration Studies 45(17): 3173–3187. doi:10.1080/1369183X.2018.1480995.
- Finney, N., and S. Jivraj. 2013. “Ethnic Group Population Change and Neighbourhood Belonging.” Urban Studies 50 (16): 3323–3341. doi: 10.1177/0042098013482497
- Finney, N., D. Kapadia, and S. Peters. 2015. How are Poverty, Ethnicity and Social Networks Related? York: Joseph Rowntree Foundation.
- Gilchrist, A., and P. Kyprianou. 2011. Social Networks, Poverty and Ethnicity. York: Joseph Rowntree Foundation.
- Granovetter, M. S. 1973. “The Strength of Weak Ties.” American Journal of Sociology 78 (6): 1360–1380. doi: 10.1086/225469
- Holt-Lunstad, J., T. B. Smith, and J. B. Layton. 2010. “Social Relationships and Mortality Risk: A Meta-analytic Review.” PLoS Medicine 7 (7): e1000316. doi:10.1371/journal.pmed.1000316.
- Hudson, M., G. Netto, F. Sosenko, M. Noon, P. de Lima, A. Gilchrist, and N. Kamenou-Aigbekaen. 2013. In-Work Poverty, Ethnicity and Workplace Cultures. York: Jospeh Rowntree Foundation.
- Lancee, B. 2016. “Job Search Methods and Immigrant Earnings: A Longitudinal Analysis of the Role of Bridging Social Capital.” Ethnicities 16: 349–367. doi: 10.1177/1468796815581426
- Lloyd, C. D., I. G. Shuttleworth, and D. W. S. Wong. 2014. Social-Spatial Segregation: Concepts, Processes and Outcomes. Bristol: Policy Press.
- Lynn, P., J. Burton, O. Kaminska, G. Knies, and A. Nandi. 2012. “An Initial Look at Non-response and Attrition in Understanding Society.” Understanding Society Working Paper Series, 2012–2.
- McCabe, A., A. Gilchrist, K. Harris, A. Afridi, and P. Kyprianou. 2013. Making the Links: Poverty, Ethnicity and Social Networks. York: Joseph Rowntree Foundation.
- McPherson, M., L. Smith-Lovin, and J. M. Cook. 2001. “Birds of a Feather: Homophily in Social Networks.” Annual Review of Sociology 27: 415–444. doi: 10.1146/annurev.soc.27.1.415
- OECD. 2013. OECD Framework for Statistics and the Distribution of Household Income. Organisation for Economic Co-operation and Development.
- Poortinga, W. 2012. “Community Resilience and Health: The Role of Bonding, Bridging, and Linking Aspects of Social Capital.” Health and Place 18: 286–295. doi: 10.1016/j.healthplace.2011.09.017
- Putnam, R. 2007. “E Pluribus Unum: Diversity and Community in the Twenty-First Century, the 2006 Johan Skytte Prize Lecture.” Scandinavian Political Studies 30 (2): 137–174. doi: 10.1111/j.1467-9477.2007.00176.x
- Ryan, L. 2011. “Migrants’ Social Networks and Weak Ties: Accessing Resources and Constructing Relationships Post-migration.” The Sociological Review 59 (4): 707–724. doi: 10.1111/j.1467-954X.2011.02030.x
- Snijders, T. A. B., and R. J. Bosker. 2012. Multilevel Analysis. Bodmin: Sage.
- StataCorp. 2015. Stata Statistical Software: Release 14. College Station, TX: StataCorp LP.
- University of Essex. Institute for Social and Economic Research and National Centre for Social Research. 2015. Understanding Society: Waves 1–5, 2009–2014 [data collection]. 7th Edition. UK Data Service [distributor]. SN: 6614.