
ABSTRACT
Residence by investment (RBI) programmes, or ‘golden visa’ schemes, are now found in half of European Union member states. Yet no empirical studies have tested the economic drivers or impacts of these programmes. Filling this lacuna, this article supplies the first comparative quantitative evaluation of the economic origins and outcomes of so-called golden visa programmes in the European Union. Utilising new data, we show that governments across the political spectrum are more likely to begin RBI programmes after a decline in economic growth, especially during an economic crisis, and that the programmes are generally targeted to address failing areas of the economy. Furthermore, we show that wealthy investor migrants are better conceptualised as mobile populations akin to tourists or investors, rather than as immigrants, and that countries price programmes in response to both demand-side and supply-side forces. We also find that the programmes represent a miniscule proportion of foreign investment in most countries, and that the vast majority of the investments go into real estate even when other options are available. However, the impact on real estate markets is trivial, with the sole exception of Greece. The results suggest that states turn to golden visa programmes to plug short-term economic gaps but with negligible national-level economic impact.
Introduction
Over the last decade, residence by investment (RBI) programmes have grown across the European Union, with currently thirteen countries offering clear options for receiving residence based on a passive economic investment. These schemes are often touted as a means for boosting the economy by attracting foreign investment. However, they are not without controversy. In 2018 and 2019, reports by the European Parliamentary Research Service and the European Commission questioned their economic benefits, as has much media coverage (Scherrer and Thirion Citation2018; European Commission Citation2019). Others have raised concerns that these ‘golden visa’ programmes may price locals out of the housing market. Yet to date, no studies have systematically assessed the economic origins or outcomes of these programmes.
RBI programmes are one of several migration policy tools available for attracting economic resources, including also residence permits for entrepreneurs and business start-up visas. Within this field, investment-based visa programmes can be divided into ‘active’ and ‘passive’ variants. Active programmes require the demonstration of business experience and an on-going involvement with the investment in order to qualify, and thus aim to harness both economic and human capital. Passive programmes require merely the expenditure of money (see Sumption and Hooper Citation2014). That is, applicants park their funds in the country – typically in real estate, government bonds, or a company – and have no significant further obligations in maintaining the investment. It is the passive nature of the qualification, selecting individuals based on economic capital alone, which has generated much controversy around these programmes, sometimes billed, if inaccurately, as ‘cash-for-passports’ (Spiro Citation2014, 9; Shachar and Hirschl Citation2014, 244), raising the concern that they put a ‘price tag’ on membership (e.g Scherrer and Thirion Citation2018, 12).
In practice, the boundary between the entrepreneurial and investor visas can be blurry, either in the law’s specificity or how it is implemented. Entrepreneur programmes, for example, may not assess whether applicants have relevant business skills or are regularly involved in managing the qualifying business, as is the case with Croatia’s ‘stay and work permit.’ The result is in an ‘active’ scheme with strong ‘passive’ characteristics. Similarly, business investment programmes that do not specify or monitor the degree of investor involvement at their outset may come to more strictly police human capital contributions. This occurred, for example, when Germany in 2012 revised Section 21 of its Act on the Residence, Economic Activity, and Integration of Foreigners in the Federal Territory to require applicants to demonstrate entrepreneurial experience and involvement in the business. As will be discussed below, this article adopts a strict definition of RBI programmes to focus solely on the more controversial economic-capital-only options.
Despite substantial media attention, no empirical studies have tested whether countries turn to these so-called golden visa schemes out of economic need, and no study has offered a thorough assessment of their economic impact. Filling this lacuna, this article supplies the first comparative quantitative evaluation of the economic origins and outcomes of RBI programmes in the European Union. Utilising new data released by governments and gained through freedom of information requests, it first employs regression analyses to investigate the relationship between programme inception, economic decline, and the types of qualifying investments selected. It next assesses demand curves to understand the factors that affect pricing. Finally, it evaluates economic impact by assessing RBI revenue as a proportion of FDI inflows, as well as its effect on the real estate sector. The findings indicate that governments across the political spectrum launch programmes in the wake of economic downturns – and economic crises in particular – and broadly engineer them to target sectors in need. Yet states tailor prices to respond to needs beyond revenue-maximization. The analysis shows that applicants, too, select programmes like tourists and profit-oriented businesspeople, rather than as immigrants. Contra claims that foreigners are crowding locals out of the housing market, the effect on real estate is shown to be small even in countries with the largest programmes. The sole exception is Greece, where the RBI programme now represents a third of real estate transactions. The results suggest that states are increasingly turning to residence by investment programmes to plug short-term economic gaps, but with negligible economic impact on the national economy.
Residence by investment programmes
RBI programmes now can be found around the world from Malaysia to the United Arab Emirates to Panama. However, the most popular over time have been in Canada and the US, with similar programmes in Australia and New Zealand. These emerged in the late 1980s and early 1990s out of entrepreneurial programmes that were lax in assessing business involvement, bringing mixed economic outcomes. The US’s EB-5 programme, for example, floundered for its first decade due to its high price point, rigid system, and unfavorable tax implications (Wong Citation2003; see also Rose Citation1992), while programmes in Canada and Australia attracted significant investment to rural regions in particular (DeRosa Citation1995; Steier Citation1992; Wong Citation2003). Canada’s programme – the most popular by far – quickly became the greatest source of venture capital in four provinces, producing over 14,000 jobs in less than a decade (DeRosa Citation1995, 395, 404). In British Columbia alone, the programme attracted over one billion Canadian dollars in business investment and created or maintained 25,000 jobs between 1990–1998 (Ley Citation2003, 430). Yet the Canadian business investor scheme – which included entrepreneurs and investors – was one of several channels that contributed to a boom in Vancouver real estate, with housing prices rising more steeply than local incomes (Ley Citation2010, 126–61). As such, programmes in the past have generated both economic winners and economic losers.
Despite the spread of RBI programmes in the EU, research evaluating their origins and economic outcomes is lacking. Existent studies usually treat RBI schemes as one subset of immigrant investor programmes (IIPs), which includes also citizenship by investment channels (e.g. Dzankic Citation2012, Citation2018; Sumption and Hooper Citation2014; Christians Citation2017; Veteto Citation2014; Scherrer and Thirion Citation2018; European Commission Citation2019; Holleran Citation2019). The amalgamation, however, can obscure more than it reveals for citizenship is a fundamentally different status to residence (see Surak, CitationForthcoming). Within the EU, residence in a member state brings only the right to temporarily visit other member states (cf. Holleran Citation2019, 3), but citizenship also secures the right to reside in them as well, even for the long term. Furthermore, citizenship is inheritable, whereas residence is not, changing calculations of future impact. Crucial for assessing economic implications of the programmes is the length of time the investment must be held. In RBI programmes, an investor must maintain their investment in order to retain the visa. If the asset is sold, the residence permit is not renewed.Footnote1 Citizenship, by contrast, is difficult to revoke. Malta, Cyprus, Turkey, and Saint Kitts, among others, require their naturalised investors to retain their qualifying investment, in part or whole, for only five years, after which it may sold, and – of course – they keep their citizenship. Thus the long-term economic impact of the economic infusion may be greater for RBI programmes.
The empirical research on IIPs in Europe has focused on policy design and debates rather than programme operation and outcomes. Existing studies have typologized policy choices (Sumption and Hooper Citation2014), examined the possible causes of policy choices (Dzankic Citation2018), dissected political debates around the programmes (Parker Citation2017; Carrera Citation2014), unpacked marketing (Holleran Citation2019), discussed the possible impact on tax competition (Adim Citation2017; Christians Citation2017). Investigating programme operation and demand, Surak (Citation2020b) assessed differences in the scale of programmes and the demographics of their participants. Yet the existing research leaves open questions about the economic origins of the programmes in the EU, as well as their economic outcomes. Are they simply intended to add a revenue stream or do they arise out of and address economic need? Some have associated the launch of these programmes with economic declines. Dzankic (Citation2018) proposes that states with medium-sized economies hit by the Eurocrisis produce RBI programmes, an assertion that resonates with Holleran’s (Citation2019) qualitative interpretation of the origins of Spain’s RBI scheme. However, a full appraisal of whether the claim holds across all EU cases requires more empirical evidence: it is necessary to include the timing of programme implementation, as well as the particular economic needs of the countries, and whether investment options of the programmes targeted areas that flagged during the crisis.
The question of whether states implement programmes in response to economic need raises the related query about how governments adjust prices accordingly. Dzankic (Citation2018, 12, 14) suggests that richer countries place higher prices on their investment migration programmes, ostensibly because ‘the investment needs to have an impact on the country’s GDP.’ However, the proposition does not take into account the shape of the demand curve: higher prices do not necessarily mean higher revenue. For example, the Netherlands stipulates a minimum investment of €1.25 million, but earns very little from the programme as it has less than five applicants year each year. Bulgaria, in comparison, requires an investment of only €127,000 but approves on average more than 100 applicants annually, far outstripping the revenue generated by its economically larger counterpart (cf. Dzankic Citation2018, 11).
Finally, do these programmes, designed to attract investment, pay off? Full assessments of the economic outcomes of RBI schemes are scant, even among studies of longer-standing investment migration programmes outside Europe. Existing research on investment migration programmes in North America and the Caribbean has shown that, unsurprisingly, the magnitude of their economic impact depends on the size of the economy, with larger countries seeing proportionally less benefit than smaller ones (Xu, El-Ashram, and Gold Citation2016; see also Migration Advisory Committee Citation2014). Within countries, urban areas attract more investment, but rural areas may see more relative benefit (Ley Citation2010; DeRosa Citation1995; Friedland and Calderon Citation2017), and programmes may contribute to job creation and business formation, but not always at the promised levels (Ley Citation2003, Citation2010).
Comparing cases within Europe, a report by European Parliamentary Research Service suggests that the programmes make a positive contribution to foreign investment, but may also create macro-economic imbalances (Scherrer and Thirion Citation2018, 36–41). However, the study bases its conclusion on only two countries – Ireland and Portugal – out of its sample of eighteen countries that include also business-based RBI programmes.Footnote2 Furthermore, it considers only the total amount invested over time and average annual programme receipts as a proportion of GDP. Notably, the aggregate measures mask substantial annual variation. Their analysis of Ireland is a case in point, where the average total investment amount hides a jump of 500 percent between 2015 and 2016. If the calculation had ended in 2015, the average total investment would be a mere €65 million, or €16.3 million per year, rather than €209 million total and €41.8 million per year. If the analysis extended to 2017, the average would be yet greater: €79.7 million per year. The limited sample significantly skews the estimated impact of the contribution to GDP.
Although most RBI schemes offer several investment options, discussions focus almost entirely on real estate investment, and no empirical studies have examined the outcomes of other investment channels. Generally, the interest in real estate stems from the concern that programmes may price locals out of affordable housing (Scherrer and Thirion Citation2018; Holleran Citation2019). To date, only two reports have investigated real estate market impact, and then only with proxies or limited timeframes. Viesturs, Pukite, and Nikuradze (Citation2017) examine the Latvian case by looking at the change in property transactions involving foreigners across a time when the government doubled the minimum requirements for investing in real estate. Using a difference-in-differences approach, they deduce that the decline in demand for RBI led to a decline in real estate purchases by foreigners. Scherrer and Thirion (Citation2018, 41–3) conclude that RBI programmes may destabilise real estate markets in the EU based on a single data point. They reach this generalisation by examining the variation in property transactions involving all foreign buyers in Portugal in a single year, finding that in 2016 the number of foreigner buyers increased by 18 percent over the previous year. Not only does their sample encompass a very narrow time frame and case selection, but the measure includes sales to all foreigners of which RBI applicants may be only a small proportion. Thus we still do not know whether the increase resulted from the RBI programme, or whether it is indicative of the global trend in foreign real estate investment occurring outside these programmes.Footnote3
Existing research on RBI programmes has opened important questions concerning whether the schemes are launched to address economic need, as well as the nature and extent of their economic impact. However, these questions have remained inadequately assessed to date due largely to the dearth of empirical evidence. Using new materials and government sources, we supply the first multi-country data-driven account of the economic origins and outcomes of the programmes. To investigate whether and how countries implement RBI programmes in response to economic need, we test the timing of programme implementation and type of investment options offered, as well as the extent and type economic decline in the countries. To assess the economic impact of the programmes, we analyse the factors involved in pricing. We also contextualise the inflows by examining the investments as a proportion of foreign direct investment (FDI), and then narrow our analysis to the areas of the economy seeing the largest inflows, namely real estate. To assess its scale and potential for destabilising property markets, we examine RBI investment as a proportion of foreign investment in property.
Research design and methods
This study focuses on RBI programmes that screen participants based only on economic capital contributions. To eliminate options that may also include human capital components, it adopts a strict definition of RBI that includes only programmes that have at least one clearly passive investment option. Qualifying investments come in six types: (1) investment in a company, (2) investment in an investment fund or structure, (3) investment in government bonds, (4) deposits in a bank, (5) investment in real estate, and (6) financial contributions to the public good. Financial contributions to a government may also be a minor component, but in no EU case is it a stand-alone option. Because it may be ambiguous whether business investments are fully active or passive as addressed above, this article considers only programmes where company investment is not the sole option for qualification. In these cases, at least one additional channel that is passive by definition, such as real estate or government bond purchases, must be available.
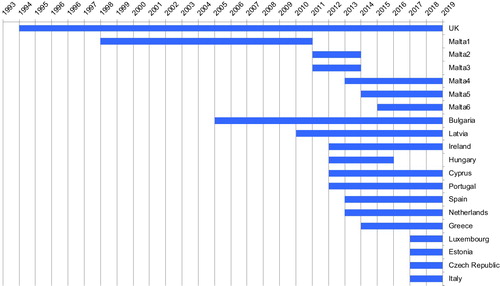
The analysis employs new data from government reports and freedom of information requests, in addition to information from parliamentary debates. Latvia and Portugal have regularly produced publicly available government statistics on their programmes. Since 2018, Greece has issued government reports. Spain produced one report covering September 2013 to December 2014 and has thereafter issued brief summaries, and the UK has released basic, publicly available statistics about its programme since 2008. Freedom of information requests for demographic and economic information were answered in whole – or more often in part – by Bulgaria, Estonia, Hungary, Ireland, Luxembourg, the Netherlands, and the United Kingdom. Cyprus, Italy, and Malta ignored repeated requests for information and therefore are excluded from analyses dependent on participation numbers. Although the United Kingdom (UK) is no longer a member of the EU, it is included in the analysis during the period of its membership. The programme in Hungary, which was terminated in 2016, is included for the duration of its existence (see ). Since 1998, Malta has had six different RBI programmes, three of which are still active. Where relevant, we operationalise the minimum investment amount for Malta using the least costly option.
Figure 1. Timeline of RBI programmes.
Malta 1: Permanent Residence Scheme; Malta 2: High Net Worth Individual Visa for EU/EAA/Switzerland; Malta 3: High Net Worth Individual Visa for non-EU/EAA/Switzerland; Malta 4: Global Residence Programme; Malta 5: The Residence Programme; Malta 6: Malta Residency and Visa Programme.
RBI programmes in the EU
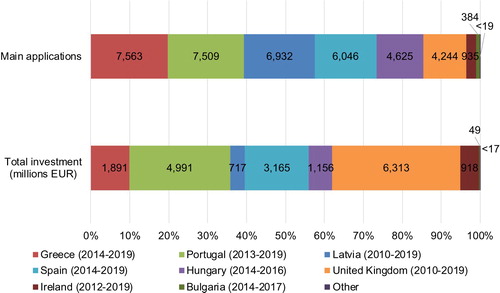
Half of all EU member states possess RBI programmes, yet these vary greatly in size. Our analysis does not test for why individuals select one country over another, which can depend on historical links, marketing, and the commissions that intermediaries earn for promoting programmes (see Surak Citation2020b). Notable, however, is that demand is channelled into a narrow selection. Only 3 out of 14 countries that have had programmes – Latvia, Portugal, and Greece – account for over half of all golden visas issued. Together with Spain, the UK, and Hungary, these 6 countries have generated over 95 percent of golden visa cases and 95 percent of its revenue (see ). The UK and Portugal together account for more than half of the revenue brought into the EU through the programmes over time.
Figure 2. Total main applications and investments approved over time by country issuing visa.
Sources: Bulgaria: Investment Bulgaria, Estonia: Police and Border Guard Board, Greece: Enterprise Greece, Hungary: Immigration and Asylum Office, Ireland: Department of Justice and Equality, Latvia: Office of Citizenship and Migration Affairs, Luxembourg: Ministry of Foreign and European Affairs, Netherlands: Immigration and Naturalization Service, Portugal: Immigration and Borders Service, Spain: Ministry of Labor and Migration, UK: Home Office. Note: Exact investment figures are available for only Portugal and Latvia. In all other cases, total investment is estimated by multiplying the number of applicants by the minimum investment amount. The ‘other’ category includes Estonia, Luxembourg, and Netherlands, which have less than 20 applicants among them.
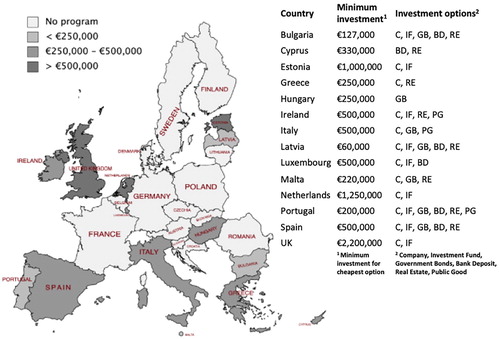
Notably, too, minimum qualifying investment amounts for RBI programmes vary substantially, ranging from €60,000 in Latvia to over €2 million in the UK (). Most, however, fall between €250,000 and €500,000. Among the investment types, company investment is the most popular, with 12 out of 14 countries offering this channel. Investment funds follow with 9 countries and real estate with 8 countries. Further qualifying options include government bonds (7 countries), bank deposits (6 countries), and contributions to the public good (3 countries). Additionally, contributions to government coffers are a minor component of the Latvian programme, as well as the three Maltese schemes in operation.
Map 1. RBI programmes in EU member states to 2020.
Economic origins and outcomes
Carrying out a detailed evaluation of economic origins and outcomes presents several challenges. Governments are reluctant to respond to freedom of information requests and publicly available detailed reports are uncommon. Only Latvia and Portugal provide annual figures on investors selecting particular investment channels, while Greece has done the same for the real estate option only. Of the remaining countries, only Ireland and Spain have issued cumulative totals for specific periods. To a degree, the dearth of basic information on all programmes is manageable when assessing their economic impact: Portugal, Spain, Latvia, and Greece account for around 70 percent of all approved applications and nearly 60 percent of all revenue generated ().Footnote4
Figure 3. Revenue by country.
Sources: Bulgaria: Investment Bulgaria, Estonia: Police and Border Guard Board, Greece: Enterprise Greece, Hungary: Immigration and Asylum Office, Ireland: Department of Justice and Equality, Latvia: Office of Citizenship and Migration Affairs, Luxembourg: Ministry of Foreign and European Affairs, Netherlands: Immigration and Naturalization Service, Portugal: Immigration and Borders Service, Spain: Ministry of Labor and Migration, UK: Home Office.
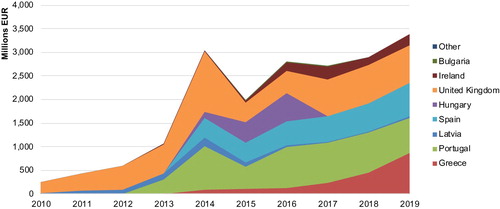
Since 2014, the programmes have brought in close to €3 billion annually to the EU. Though the UK sees only a few hundred applications per year, its high minimum investment amount and long history make it the largest-grossing programme, attracting over €5.5 billion since 2010. Overall, the trend has been upwards, with the exception of a decline in 2015 among several leading countries. The causes, however, are case-specific. The UK doubled its minimum investment amount from £1 million to £2 million in 2015, leading to a rush before the new prices took effect and a decline thereafter. In Latvia, a new coalition government with a nationalist, anti-Russian agenda took power in 2014. It dramatically slowed the processing of applications, long dominated by Russians, and doubled the minimum investment amount in real estate options, leading to a significant decline. In 2015, Portugal became mired in a corruption scandal involving its RBI programme. The programme was frozen and audited, producing a temporary halt and large backlog before recovering and levelling off.
Programme origins: economic need
Do countries start programmes to address economic need? To test which factors motivate countries to adopt RBI programmes, we analyse data from 2005 to 2019 across 28 countries in the EU and conduct a regression using country-year as the unit of analysis. First, we examine whether or not programmes are established in response to an economic downturn by using a dummy variable for the start of the programme as the dependent variable.Footnote5 For the main independent variable, we test GDP growth over one-year, two-year, and three-year time spans. If the start of a programme correlates with a lower level of GDP growth, it is likely that governments begin RBI programmes in response to economic need. We also look for the effect of the Eurocrisis as a more systemic and severe event that we operationalise as occurring from 2010 to 2012 and by including a dummy variable if the dependent variable contains values from 2010–2012. We expect this dummy variable to be significant if governments behave differently due to the economic crisis. We include an interaction term with GDP growth to see if governments were particularly sensitive to drops in GDP during the crisis. The number of countries with pre-existing residence programmes is included as a control variable to address the possibility of contagion effects: governments may introduce programmes because others already have them. To test whether changes in a government’s political orientation, such as the rise of right-wing parties, have an effect, we include the relative strengths of right wing, centre, and left wing parties in government, taken from the Comparative Political Data Set (CPDS).Footnote6 Year- and country-fixed effects are included to control for other factors.
In the next step, we explore whether the specific investment options are chosen to combat declines in targeted sectors of the economy. RBI programmes can stimulate the economy in three key ways. First, the sale of government bonds allows states to ease their debt burden by incentivizing the purchase of such loans. Second, investment into businesses (including through investment funds) can create jobs and thereby lower the unemployment rate. Third, real estate investment can boost the domestic property market. Assessing these options involves three regressions, each taking the start of the specific investment option (business, bonds, real estate) as the dependent variable. To operationalise the economic need that each option might respond to, the main independent variables are the housing market price index (real estate), debt-to-GDP ratio (government bonds), and unemployment rate (business investment), for their respective regressions. The control variables included are the annual GDP growth rate, the long-term interest rate,Footnote7 and the number of countries with an RBI programme. The growth rate is designed to control for general economic activity, as opposed to the economic indicators more closely related to the investment options. Based on the results in the first step, a one-year GDP growth is used. The interest rate tests for the possibility that governments use the RBI programme to borrow cheaply at the expense of distorting the financial market. We again control for political orientation, as well as year- and country- fixed effects.
Although the dependent variables are binary, we use a linear regression in all cases since countries which do not have an RBI programme would be dropped in probit-type regressions. To account for the time needed to establish a programme, we used values lagged by one year. In addition, we control for year- and country-specific effects. The results are shown in and .
Table 1. Main regression results for programme start.
Table 2. Main regression results for investment option start.
The first regression shows that RBI programmes are indeed implemented after a period of slowed economic growth. The effect is strongest for the three-year averages, and the interaction for the two-year average regression is negative and significant. Thus governments are more likely to implement programmes if they have experienced a sustained economic downturn, and more likely to do so if the downturn occurred during the Eurocrisis. For the option-level data, we find that the real estate and business investment options have a significant relationship with their respective economic indicators. However, the start of bond option does not correlate significantly with the unemployment rate. Thus, the real estate and business investment options appear to be designed to address areas of economic need, while the government bond option does not. Notably, the number of programmes already in existence does not have a significant effect on starting an RBI programme, indicating that there is no contagion effect. The political variables are also insignificant, which is consistent with the findings of scholars who disaggregate the impact of political orientation on migration policy (de Haas and Natter Citation2015). Not only do both left-wing and right-wing governments implement RBI programmes, but also opposition parties, once in power, do not end the use of such programmes. Notably, however, our findings show that a decline in GDP growth is correlated not with greater restrictiveness, but its opposite: governments under declining economic conditions are more likely to launch such programmes, suggesting that they are treated more akin to economic tools rather than immigration-related ones (cf. de Haas and Natter Citation2015, 18, 20). Robustness checks show that the results hold even when each country is left out of the regression one at a time, and thus reflect a general trend.
Programme pricing: a demand-side approach
If states implement programmes in response to economic need, do they adjust prices accordingly? More specifically, what factors influence the pricing of investment amounts? Dzankic (Citation2018) asserts that richer countries place higher prices on RBI options because the investment needs to impact GDP, which is larger in such cases. However, as discussed above, the economic logic supporting this ‘supply-side’ approach is not clear, since higher prices do not always generate higher revenue if the decrease in demand offsets the increase in price. The alternative ‘demand-side’ explanation is that governments choose the profit-maximising point on the demand curve: they select a price that generates the most revenue, and thus the minimum investment amount is determined by the demand curve of the applicants. As a result, more attractive countries will have a higher minimum investment amount.
To understand how governments price programmes, we need to first determine the factors influence the decision. Here, we consider three hypotheses. First, investors – like others seeking residence options – may behave as though they are making an immigration decision and select a country based on factors that make it livable in the long run, such as education, pollution, and crime rates. Second, investors may have a more short-term orientation, leading them to behave like tourists. Qualitative research on wealthy migrants has found that many maintain multiple bases and do not principally reside in countries where they have acquired residence. They instead live as ‘flexible citizens’ (Ong Citation1999) who travel frequently between residences and business locations (see also Surak Citation2020a). Thus, a country’s attractiveness is more likely to be correlated with its attractiveness as a tourist destination with, for example, desirable resort areas more important than average level of health care or pollution. Third, a country may be more attractive because it provides better investment opportunities and a higher rate of return.
To test these three hypotheses, we run a regression with data from all EU countries with RBI programmes from 2008 to 2019, taking the number of applicants as the main dependent variable (). For the first hypothesis, we use as the explanatory variable several quality of life variables from the Eurostat database. The variables were chosen based on the completeness of the data over our time period, as well as whether they are ‘public goods’ in the sense that even a wealthy investor with ample money cannot obtain them individually.Footnote8 For the second, we use the annual number of tourists that arrive in each country. For the third, we use the year-on-year GDP growth rate as well as the housing rate because – as will be seen in the next section – the vast majority of investment goes into real estate. All of the variables are lagged by one year to avoid the simultaneity problem, namely the problem that the independent variables may be determined by the number of applicants in the same year. As control variables, we include the number of RBI programmes already in existence, as well as the minimum investment amount. The number of existing resident programmes represents the number of choices the applicant has, or in other words, the degree of competition in the market.Footnote9 Thus, we would expect the coefficient for existing programmes to be negative. The minimum investment amount is designed to account for the slope of the demand curve and thus is expected to be negative. The regression also includes fixed year-effects.Footnote10
Table 3. Main regression results for investor behaviour.
The results suggest that RBI participants behave like tourists when choosing countries: the more tourists there are in a country, the more applicants it is likely to receive. The long-term quality of life variables, such as education, crime, and pollution, are not significant. In addition, the coefficient for housing prices is significantly negative, which suggests that people prefer countries where real estate is cheaper. As such, RBI program participants act more like tourists or investors and less like immigrants when choosing among the offerings. As for the control variables, the minimum investment price has a negative correlation, showing that on average the slope of the demand curve is negative and lower prices lead to more applications. The effect of the number of RBI programmes is insignificant, which aligns with the results found in the previous section: there is no contagion effect. In sum, we see that minimum investment prices are higher where the demand curve is more favourable due to attractive living conditions. Again, the results hold even when we leave out any one country from the regression.
Knowing what shapes a demand curve, we can now evaluate what determines the minimum investment amount for each country by comparing two hypotheses. The ‘demand-side’ hypothesis posits that governments react passively to market demand and set a minimum price that maximises the total revenue. Thus, proxies for attractiveness should have a positive impact on investment price. The ‘supply-side’ argument asserts that the price depends on needs internal to the country. In the first regression analysis, we found that countries begin programmes in response to economic crises. As such, we can expect that as the economy improves, the priority of these programmes would decline. If the political costs involved in maintaining a controversial programme outweigh the benefits of additional revenue, countries may raise their price to decrease the number of applicants, as occurred in the case of Latvia discussed above.
To test these hypotheses, we run a regression, but this time the dependent variable is the minimum investment amount for each country from 2008 to 2019. The independent variables are similar to the regression above. For the demand side, we include the significant quality of life variables from the above regression. For the supply side, we revisit the economic considerations from the first regression analysis, and include all key economic variables, lagged by one year. Since the regression result in shows that economic indicators are not significantly correlated with applications, any significant effect in this new regression must come from the supply side. Other control variables included are the number of existing RBI programmes and year-fixed effects.
Although the regressions in and are similar in terms of variables, they are different in their interpretation. In , where the main variable is the number of applications, the focus is on what variables affect applicant choice and how. In , the focus is on what governments judge is important when adjusting their prices: domestic need or investor demand. The results are summarised in .
Table 4. Main regression results for demand curve determinants.
The regressions support the demand-side hypothesis: a country's attractiveness as measured by the number of tourists and education is significantly correlated with the minimum investment amount. This shows that applicants tend to choose countries with higher livability, and that governments of those countries charge more in response. There is some asymmetry in that applicants evaluate countries as tourists and profit-oriented businesspeople, while governments price according to the country's overall attractiveness. At the same time, the supply-side hypothesis receives some support as well: GDP growth and unemployment rate are negatively correlated with investment price. From an economic perspective, maximizing revenue is best outcome, but the number of new residents may have other effects on the domestic economy. For example, a country with higher unemployment rate may want more investor residents since the qualifying investment may create new jobs. On the other hand, low GDP growth may correlate with increased political pressure to keep rich investors from buying houses. The results of the paired regressions show that applicants behave most similarly to tourists and investors when selecting options, and that governments respond to both supply-side and demand-side forces when setting prices.
Programme outcomes: economic impact
What are the effects of these programmes on the overall economy? In assessing this question, it is important to note several issues that can dilute a programme’s overall economic benefit. Real estate may be sold above market value to investors seeking to fulfil minimum investment requirements. Businesses may not grow or be sustainable. Administrative oversight may facilitate the exaggeration of job creation or neglect to register business collapse (e.g. Ley Citation2003). To assess whether such practices undermine the economic benefits of the programmes requires a detailed analysis of how each operates on the ground, which lies beyond the scope of this article. Instead it relies on the available information on the number of main applicants, amount of investment, and type of investment, and extrapolates based on the number of applicants and the minimum investment amount where data are not available.
Qualifying investments enter the economy from external sources and thus they resemble foreign direct investment (FDI), though officially they do not come under this category.Footnote11 Other studies have used Foreign Portfolio Investment (FPI) to situate the magnitude of these flows (Scherrer and Thirion Citation2018). However, FDI is a better comparison because the assets are relatively illiquid for the investor: if the investor sells the investment, then she loses the visa. The upshot is a longer-term orientation more characteristic of FDI than FPI.Footnote12 reveals substantial variance among countries where data are available, ranging from RBI receipts representing 15 percent of FDI in Portugal, to less than 1 percent in Ireland.
Figure 4. Investment as a Proportion of Foreign Direct Investment and GDP.
Sources: Bulgaria: Investment Bulgaria, Greece: Enterprise Greece, Ireland: Department of Justice and Equality, Latvia: Office of Citizenship and Migration Affairs, Portugal: Immigration and Borders Service, Spain: Ministry of Labor and Migration, Eurostat: FDI, World Bank: GDP.
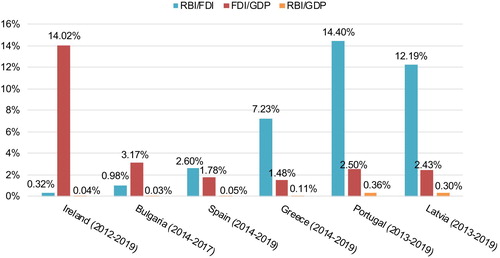
We also see that the scale of the programme does not necessarily correlate with the proportion of FDI. Spain, for example, has the second highest number of annual applicants, but the programme constitutes only 3 percent of FDI inflows. By contrast, the programmes in Latvia and Portugal – countries with smaller economies overall – attract investment that is equivalent to a substantial proportion of FDI. Even in countries that are heavily reliant on FDI, such as Ireland, programme revenue is miniscule in comparison to other sources of foreign investment. Notably, RBI programmes are not subject to EU rules concerning state aid, which can pose challenges when states compete for FDI. As such, it has been hypothesised that the programmes offer an alternative means to compete for foreign investment (Lindeboom and Meunier, CitationForthcoming). However, our analysis shows that most countries are not actively exploiting programmes in this manner. Importantly, even large programmes in small economies, such as the one in Latvia, contribute less than 1 percent to GDP. Thus contra Scherrer and Thirion (Citation2018, 39–41), concerns that the programmes may destabilise economies and produce macroeconomic risks are unwarranted.
How do the injections affect specific sectors? Existing work claims that RBI programmes can have a negative impact on the real estate market by driving out locals (Scherrer and Thirion Citation2018; Holleran Citation2019). Unfortunately, the sole empirical assessment to date takes into account only partial data from two countries and does not isolate the impact of RBI investment from general foreign investment in real estate (Scherrer and Thirion Citation2018, 42–3). In the following analysis, we use more complete data to test these arguments by examining the four largest programmes in Greece, Latvia, Portugal, and Spain, which account for over 70 percent of total approvals in the EU. If there is a deleterious affect on local real estate, it is likely to be found in these cases.
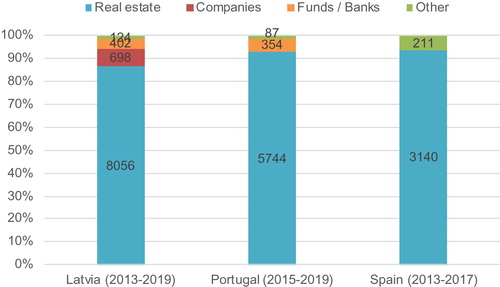
First, we find that the focus on the real estate sector is warranted. Only Portugal, Spain, and Latvia have released information about the number of investors selecting each type of investment, but these countries account for nearly 60 percent of approved applications. In Portugal and Spain, over 90 percent of investors select real estate, as do over 85 percent in Latvia (). Greece has released figures only for applicants selecting real estate. Bureaucrats involved with the programme have confirmed that these represent the vast majority of cases. Thus we see that an overwhelming proportion of the investment goes into the real estate market. Accordingly, if there is a strong effect on the economy, positive or negative, it would appear in the real estate sector. The Latvian numbers are particularly striking since the minimum amount for qualifying through business investment is around one-quarter of the minimum real estate investment. Although countries may hope the programmes address other economic sectors, investors overwhelmingly choose real estate options when available.
Figure 5. Number of investors by investment type.
Sources: Latvia: Office of Citizenship and Migration Affairs, Portugal: Immigration and Borders Service, Spain: Ministry of Labor and Migration.
How significant are RBI programmes to a country’s property sector? If we look at total foreign investment in residential property in Portugal, we find 8 percent of homes were sold to non-residents in 2018, which amounts to 13 percent of the residential property sector (). However, RBI investments constituted just 22 percent of total foreign investment in real estate and about 3 percent of the total real estate market. A similar situation can be found in Spain. From 2013 to 2017, there were 3,350 golden visas issued, with 94 percent secured through investment in real estate, amounting to a total investment of €2.3 billion in property.Footnote13 During the same period, foreign nationals comprised 13 percent to 15 percent of the total market in real estate, or nearly 219,000 transactions.Footnote14 Thus only 1.5 percent of the foreign investment in property came through the RBI programme, which represented less than one percent of the country’s real estate market.
Table 5. Significance of RBI investment within the real estate market.
In Latvia, investment through RBI programmes has had a larger, though still not substantial, impact on the real estate market. In 2014, the government raised the minimum investment amount for its real estate option from €142,000 in urban areas and €71,000 in rural areas to €250,000 nationwide. Drawing on data in Viesturs, Pukite, and Nikuradze (Citation2017), we can see that this caused a large decrease in applications, as numbers dropped from 5600 in 2014–1400 in 2015. At the same time, the proportion of foreigners in real estate transactions fell from 15 percent to 10 percent. Thus RBI applicants accounted for roughly 6.7 percent (2014) and 1.7 percent (2015) of total transactions. Furthermore, the impact was concentrated in two regions. Riga, the capital of Latvia and the most urbanised area, saw transactions halve from around 2000 to 1000. Saulkrasti, a resort district, experienced an even more drastic drop in the percentage of real estate transactions involving foreigners, from about 70 percent to 10-20 percent. The concentration of investments in this resort area conforms to the findings in that investors behave as tourists.
The Greek programme presents a markedly different story in comparison to the other cases. Since implementation in 2014, it has become one of the most popular in Europe. With a minimum investment amount of €250,000 in real estate, the programme attracted at least €470 million into the property in 2018 alone.Footnote15 To put this in perspective, the total real estate market the same year was more than €1.3 billion, of which €655 million came from foreign investors.Footnote16 Thus, we can reasonably estimate that investment from the RBI programme accounts for about 36 percent of the real estate sector, and 72 percent of foreign investment into the sector. As such, the programme has come to constitute a substantial proportion of the total property market. The findings warrant further investigation of whether the property market is showing signs of destabilisation and where specifically locals have been priced out of housing.
Our findings show that the programmes do not appear to be ‘pressuring’ the real estate sector based on this measure alone (cf. Scherrer and Thirion Citation2018, 36). If only Greece raises concerns, what accounts for the anxiety about such programmes? Only speculation is possible, but notably the nationality composition of RBI programmes sets them apart from dominant sources of foreign investment in property. In Portugal, the golden visa programme attracts applicants predominantly from China (55 percent), Brazil (10 percent), and Turkey (5 percent). However, the top countries accounting for foreign real estate investment – a far larger proportion of the property market – are in Europe: France (28 percent), Great Britain (15 percent), Switzerland (8 percent), and Germany (6 percent).Footnote17 Similarly, in Spain, the main players are predominantly European, with the United Kingdom, France, Germany, Belgium, and Sweden claiming the top five spots for a total of 44 percent of the foreign transactions in the market.Footnote18 Spain’s RBI programme attracts predominantly Chinese (37 percent), Russians (27 percent), and other non-EU nationals.Footnote19 Notably too studies have presented their analyses in ways that overstate the impact of RBI investments in real estate while underplaying changes in local and EU real estate purchases (e.g. Scherrer and Thirion Citation2018, 42–3). As such, it is possible that the purchase of property by more distant, even racially distinct, ‘others’ raises greater fear among nationals that the country is being bought up by putatively threatening foreigners (see also Rogers, Wong, and Nelson Citation2017).
Conclusion
The twentieth century saw a remarkable shift from screening new immigrants based on racial origins to screening based on human capital contributions (Joppke Citation2005; FitzGerald and Cook-Martín Citation2014). The spread of RBI programmes in the twenty-first century adds a new dimension: screening new residents by economic capital contributions only. The results of this investigation suggest an upper limit on Ellerman’s (Citation2019) finding that western countries now devalue the economic offerings of foreigners when selecting new members. In contrast to the policies aimed at workers that she examines, here we see that countries are indeed supplying pathways to long-term residence and citizenship for those making economic contributions – as long as they are very sizeable. Notably, the injections are one-off and the new residents are not expected to continue to contribute to economic growth in the same way that migrant workers might; they must simply maintain the original investment. The trend suggests a short-term calculation on the part of states, seeking to plug economic gaps, as our analysis finds, rather than a longer-term orientation of crafting a middle-class national identity (cf. Elrick and Winter Citation2018; Ellerman Citation2019). If social capital (Portes Citation1998), human capital (Stark, Helmenstein, and Fürnkranz-Prskawetz Citation1998; Ellerman Citation2019), and ethnic capital (Mateos and Durand Citation2012; Kim Citation2018) have captured the attention of social scientists analysing migration, the developments tracked here suggest that a renewed focus on economic capital may be warranted. We find that states continue to harness mobility policies in service of economic objectives, now in a more starkly transactional manner, and – as we show – no matter what the political orientation of the government may be.
If RBI programmes are becoming an increasingly popular policy option, not all countries see the same uptake. Demand in Europe is concentrated in a handful of programmes: just four countries represent 75 percent of all investor residents. The programmes now bring nearly €3.5 billion to the Union annually, yet the economic benefits are uneven. Indeed, only in two countries, Latvia and Portugal, are the economic injections large enough to represent a significant proportion of FDI. However in no country do they represent a substantial proportion of GDP, suggesting that concerns about macroeconomic destabilisation are unwarranted.
Our analysis reveals that economic decline leads to a greater likelihood that countries will start programmes, and that if the economic decline occurred during the Eurocrisis, the likelihood is yet greater – an argument proposed but not demonstrated by the literature (e.g. Parker Citation2017; Holleran Citation2019; Dzankic Citation2018; Veteto Citation2014). The choice of investment options, too, is largely responsive to economic need when governments implement real estate and business investment options, though not government bond options. Furthermore, the spread of programmes itself does not lead to more programmes: there is no contagion effect. As such, driving the onset of RBI programmes is more than mere client politics or neo-liberal ideology (cf. Mavelli Citation2018); economic need is a significant factor behind them. However, investors may stymie government intentions to use programmes to boost several areas of the economy, for they overwhelmingly invest in real estate if given the option.
Furthermore, our analysis suggests that wealthy investor migrants may be better conceptualised as mobile, profit-oriented populations akin to tourists and businesspeople, rather than as long term-oriented immigrants. The results lend support to qualitative work that identifies such mobile populations as ‘flexible citizens’ (Ong Citation1999), who use investment to multiply their options and secure additional bases, rather than to pack up and immigrate or invest in a growing economy (see also Ley Citation2010; Surak Citation2020a). We also find that countries with strong tourism sectors can charge more for their programmes as well. Yet they are not merely profit maximisers, choosing a price that will attract the most applicants; they respond to internal issues too, changing price in accordance with economic growth and employment rates.
A number of analysts have raised warning flags that investor migrants may price locals out of real estate (Scherrer and Thirion Citation2018; Holleran Citation2019). Our analysis shows the concern is unwarranted: the proportion of RBI real estate transactions in the national market is miniscule in nearly all cases. Notably, these programmes attract more distant and often ‘browner’ others than the fellow Europeans who constitute the greatest proportion of foreign real estate buyers and raise less media hype, suggesting that xenophobia may lie behind the concern. Greece is the sole, but significant, exception where the scale of the programme could indeed destabilise the property market. As real estate investment tends to be concentrated in specific locales (Friedland and Calderon Citation2017; Viesturs, Pukite, and Nikuradze Citation2017), regional and city-level data are necessary to further identify whether more limited destabilisation is occurring in particular areas.
What has been the impact of Covid-19 on these programmes? The sudden hardening of borders across the world has sent many wealthy people looking for ways to hedge their risks by securing mobility options and a Plan B (Surak Citation2020b, Citation2020c). To date, as we show, national-level healthcare statistics have been insignificant, but Covid-19 may encourage wealthy investors to select countries that have handled the pandemic well or that offer state-of-the-art healthcare. Covid-19 may also bring a shift away from a short-term ‘tourist-like’ calculation to a medium-term calculation preferring a place for longer-stint stays.
Regarding supply, Covid-19 is likely to increase the attractiveness of RBI programmes as a way to draw in foreign investment. Our study found that countries are more prone to start programmes after a period of slowed economic growth, particularly after a systemic recession. If the economic downturn spurred by the pandemic continues, it is likely that new countries will start their own programmes, replicating the pattern we found, and that countries with RBI offerings already in place will attempt to develop them further to address deepening economic need. Even if the schemes to date have been small, they still offer a means to attract additional resources at little cost. With real estate the most popular qualifying option, the investment boost is likely to be concentrated in the property and construction sector, which itself is transforming as the pandemic reconfigures work patterns and the desirability of urban living. Even if the European Commission continues to call for ending the programmes, countries are more likely to adapt their RBI offerings – perhaps by shifting them closer to, or even transforming them into, entrepreneurial options – rather than do away with them entirely.
Disclosure statement
No potential conflict of interest was reported by the author(s).
Notes
1 Bulgaria, which offers permanent residence, is the exception. Cyprus also grants permanent residence, but requires investors to maintain the real estate purchased for qualification. The bank deposit can be withdrawn after three years.
2 The report’s definition of RBI programmes is more expansive than our own and includes cases where human capital contributions are assessed. See the research design and methods section below.
3 The report also strains to make a similar case with respect to citizenship by investment programmes. The authors flag a 43 percent increase in real estate sales in Cyprus between 2015 and 2016, with nearly a quarter coming from foreigners – a 34 percent increase over the previous year. The explanation, however, ignores the much larger jump in real estate purchases by locals in the comparable time span, which rose by 46 percent. The full picture indicates that it is not that foreigners are increasingly dominating the market, but that the market as a whole is becoming more attractive to foreigners and locals alike.
4 The Figure does not include Malta, Cyprus, or Italy, which have not issued reports and did not respond to repeated requests for data. Service providers involved with developing the Italian programme confirm that only a handful of people have applied. The lack of data on Cyprus and Malta, however, leaves a potentially significant gap. Both countries host popular citizenship by investment schemes, and their RBI programmes possess structures similar to popular real estate-based programmes in the Mediterranean. Thus, it is likely that the number of approvals in Malta and Cyprus contribute more to the EU’s total RBI admissions, though they are unlikely to be among the top choices
5 We operationalized this by setting the value to ‘1’ for every year a new programme starts. In all of the robustness checks, the significance and magnitude of the coefficients were similar and did not change our conclusions.
6 In the regressions, we drop centre parties to avoid collinearity. To check robustness, we run regressions using the other two definitions and find that the results are consistent.
7 Estonia does not have comparable data since it only rarely issues government bonds, and therefore 0 was substituted for all values
8 Because of their visa status, investors cannot make use of most important welfare state provisions such as public pensions, unemployment payments, or public housing benefits, should these wealthy individuals even seek them out. Furthermore, all the programmes require participants to possess private health insurance.
9 We include Hungary as an option and count Malta as only one programme as investors are unlikely to select more than one residence programme in a single country.
10 Fixed country effects are left out of the regression since tourism and quality of life likely include time-invariant, country-specific elements, such as the Colosseum, Côte d'Azur, or the London School of Economics.
11 The exception are cases – possible only in Bulgaria and Luxembourg – where local banks can finance the qualifying investment by loaning a portion of the funds to the investor, effectively printing the money within the country.
12 FDI data are taken from the World Bank. We use the minimum investment amount to calculate overall investment where only the total number of accepted investors is available.
13 Data from Extranjeros Residentes en España Reports from the Ministry of Labor and Migration.
14 Data from Estadísticas de la Propiedad, Registrar of Spain. To match the period for the Golden Visa figures, we start from the fourth ‘trimestral’ in 2013.
15 Data from Enterprise Greece.
18 Data from Estadísticas de la Propiedad, Registrar of Spain. To match the period for the Golden Visa figures, we start from the fourth ‘trimestral’ in 2013
19 Similar information for Greece and Latvia is unavailable.
References
- Adim, L. 2017. “Between Benefit and Abuse: Immigrant Investment Programs.” Saint Louis University Law Journal 62 (1): 121–136.
- Carrera, S. 2014. “How Much Does EU Citizenship Cost?” CEPS Paper in Liberty and Security in Europe, No. 64.
- Christians, A. 2017. “Buying In: Residence and Citizenship by Investment.” St. Louis University Law Journal 62: 51–71.
- de Haas, H., and K. Natter. 2015. “The determinants of migration policies. Does the political orientation of governments matter?” International Migration Institute IMI Working Paper Series, 117.
- DeRosa, J. 1995. “The Immigrant Investor Program: Cleaning Up Canada’s Act.” Case Western Reserve Journal of International Law 27: 359–405.
- Dzankic, J. 2012. “The Pros and Cons of Ius Pecuniae: Investor Citizenship in Comparative Perspective.’ 2012/14. EUI Working Papers. Robert Schuman Centre for Advanced Studies, EUDO Citizenship Observatory.
- Dzankic, J. 2018. “Immigrant Investor Programmes in the European Union (EU).” Journal of Contemporary European Studies 26 (1): 64–80.
- Ellerman, A. 2019. “Human Capital Citizenship and the Changing Logic of Immigrant Admissions.” Journal of Ethnic and Migration Studies. doi:10.1080/1369183X.2018.1561062
- Elrick, J., and E. Winter. 2018. “Managing the National Status Group: Immigration Policy in Germany.” International Migration 56 (4): 19–32.
- European Commission. 2019. “Report from the Commission to the European Parliament, the Council, the European Economic and Social Committee and the Committee of Regions: Investor Citizenship and Residence Schemes in the European Union.” {SWD2019)5 final}. Brussels.
- FitzGerald, D., and D. Cook-Martín. 2014. Culling the Masses: The Democratic Origins of Racist Immigration Policy in the Americas. Cambridge, MA: Harvard University Press.
- Friedland, G., and J. Calderon. 2017. EB-5 Project Database: Supplement with Trends and Observations. New York: NYU Stern Center for Real Estate Finance Research.
- Holleran, M. 2019. “Buying Up the Semi-Periphery: Spain’s Economy of ‘Golden Visas’.” Ethnos: Journal of Anthropology, doi:10.1080/00141844.2019.1687548.
- Joppke, C. 2005. Selecting by Origin: Ethnic Migration in the Liberal State. Cambridge, MA: Harvard University Press.
- Kim, J. 2018. “Ethnic Capital, Migration, and Citizenship: A Bourdieusian Perspective.” Ethnic and Racial Studies, doi:10.1080/01419870.2019.1535131.
- Ley, D. 2003. “Seeking Homo Economicus: The Canadian State and the Strange Story of the Business Immigration Program.” Annals of the Association of American Geographers 93 (2): 426–441.
- Ley, D. 2010. Millionaire Migrants: Trans-Pacific Life Lines. Chichester: Wiley-Blackwell.
- Lindeboom, J., and S. Meunier. Forthcoming. “In the Face of the Euro Crisis: Foreign Direct Investment and Investor Programmes in the European Union.” In Citizenship and Residence Sales: Rethinking the Boundaries of Belonging, edited by D. Kochenov and K. Surak. Cambridge: Cambridge University Press.
- Mateos, P., and J. Durand. 2012. “Residence v. Ancestry in Acquisition of Spanish Citizenship: A Netography Approach.” Migraciones Internacionales 6 (4): 9–46.
- Mavelli, L. 2018. “Citizenship for Sale and the Neoliberal Political Economy of Belonging.” International Studies Quarterly 62 (3): 482–493.
- Migration Advisory Committee. 2014. Tier 1 (Investor) Route: Investment Thresholds and Economic Benefits. London: The Migration Advisory Committee. https://www.gov.uk/government/publications/the-investment-limits-and-economic-benefits-of-the-tier-1-investor-route-feb-2014.
- Ong, A. 1999. Flexible Citizenship: The Cultural Logics of Transnationality. Durham: Duke University Press.
- Parker, O. 2017. “Commercializing Citizenship in Crisis EU: The Case of Immigrant Investor Programmes.” Journal of Common Market Studies 55 (2): 332–348.
- Portes, A. 1998. “Social Capital: Its Origins and Application in Modern Sociology.” Annual Review of Sociology 24: 1–24.
- Rogers, D., A. Wong, and J. Nelson. 2017. “Public Perceptions of Foreign and Chinese Real Estate Investment: Intercultural Relations in Global Sydney.” Australian Geographer 48 (4): 437–455.
- Rose, R. 1992. “Fixing the Wheel: A Critical Analysis of the Immigrant Investor Visa.” San Diego Law Review 29: 615–642.
- Scherrer, A., and E. Thirion. 2018. Citizenship by Investment (CBI) and Residency by Investment (RBI) Schemes in the EU: State of Play, Issues and Impacts. Brussels: European Parliament, European Parliamentary Research Service, PE 627.128.
- Shachar, A., and R. Hirschl. 2014. “On Citizenship, States, and Markets.” Journal of Political Philosophy 22 (2): 231–257.
- Spiro, P. 2014. “Cash-for-Passports and the End of Citizenship.” In Debating Transformations of National Citizenship, edited by R. Bauböck, 17–20. Cham: Springer Open.
- Stark, O., C. Helmenstein, and A. Fürnkranz-Prskawetz. 1998. “Human Capital Depletion, Human Capital Forma, and Migration: A Blessing or a ‘Curse’.” Economics Letters 60 (3): 363–367.
- Steier, L. 1992. “Confounding Market Hierarchy in Venture Capital Governance: The Canadian Immigrant Investor Program.” Journal of Management Studies 35 (4): 511–535.
- Sumption, M., and K. Hooper. 2014. Selling Visas and Citizenship: Policy Questions from the Global Boom in Investor Immigration. Washington, DC: Migration Policy Institute.
- Surak, K. 2020a. “Millionaire Mobility and the Sale of Citizenship.” Journal of Ethnic and Migration Studies 47 (1): 166–189.
- Surak, K. 2020b. “Who Wants to Buy a Visa? Comparing the Uptake of Residence by Investment Programs in the European Union.” Journal of Contemporary European Studies. doi:10.1080/14782804.2020.1839742.
- Surak, K. 2020c. “How COVID-19 Will Transform the Market in Investment Migration.” Globalcit. June 3, 2020. https://globalcit.eu/how-covid-19-will-transform-the-market-in-investment-migration/.
- Surak, Kristin. Forthcoming. “Marketizing Sovereign Prerogatives: How to Sell Citizenship.” European Journal of Sociology.
- Veteto, J. 2014. “The Alienability of Allegiance: An International Survey of Economic Citizenship Laws.” The International Lawyer 48 (1): 79–103.
- Viesturs, J., I. Pukite, and I. Nikuradze. 2017. “Limiting the Program of Temporary Residence Permits for Foreigners Based on Real Property Investment in Latvia.” Baltic Journal of Real Estate Economics and Construction Management 5: 248–258.
- Wong, L. 2003. “Chinese Business Migration to Australia, Canada, and the United States: State Policy and the Global Immigration Marketplace.” Asian and Pacific Migration Journal 12 (3): 301–336.
- Xu, Xin, Ahmed El-Ashram, and Judith Gold. 2016. “Too Much of a Good Thing? Prudent Management of Inflows under Economic Citizenship Programs.” Working Paper WP/15/93. International Monetary Fund.