
Abstract
Objective: This study compared the cost-effectiveness of direct-acting antiviral therapies currently recommended for treating genotypes (GT) 1 and 4 chronic hepatitis C (CHC) patients in the US.
Methods: A cost-effectiveness analysis of treatments for CHC from a US payer’s perspective over a lifelong time horizon was performed. A Markov model based on the natural history of CHC was used for a population that included treatment-naïve and -experienced patients. Treatment alternatives considered for GT1 included ombitasvir/paritaprevir/ritonavir + dasabuvir ± ribavirin (3D ± R), sofosbuvir + ledipasvir (SOF/LDV), sofosbuvir + simeprevir (SOF + SMV), simeprevir + pegylated interferon/ribavirin (SMV + PR) and no treatment (NT). For GT4 treatments, ombitasvir/paritaprevir/ritonavir + ribavirin (2D + R), SOF/LDV and NT were compared. Transition probabilities, utilities and costs were obtained from published literature. Outcomes included rates of compensated cirrhosis (CC), decompensated cirrhosis (DCC), hepatocellular carcinoma (HCC) and liver-related death (LrD), total costs, life-years and quality-adjusted life-years (QALYs). Costs and QALYs were used to calculate incremental cost-effectiveness ratios.
Results: In GT1 patients, 3D ± R and SOF-containing regimens have similar long-term outcomes; 3D ± R had the lowest lifetime risks of all liver disease outcomes: CC = 30.2%, DCC = 5.0 %, HCC = 6.8%, LT = 1.9% and LrD = 9.2%. In GT1 patients, 3D ± R had the lowest cost and the highest QALYs. As a result, 3D ± R dominated these treatment options. In GT4 patients, 2D + R had lower rates of liver morbidity and mortality, lower cost and more QALYs than SOF/LDV and NT.
Limitations: While the results are based on input values, which were obtained from a variety of heterogeneous sources—including clinical trials, the findings were robust across a plausible range of input values, as demonstrated in probabilistic sensitivity analyses.
Conclusions: Among currently recommended treatments for GT1 and GT4 in the US, 3D ± R (for GT1) and 2D + R (for GT4) have a favorable cost-effectiveness profile.
Introduction
Hepatitis C virus (HCV) is a blood-borne infection that can lead to cirrhosis, end-stage liver disease, hepatocellular carcinoma (HCC), and liver-related death (LrD)Citation1,Citation2. The prevalence of chronic HCV infection is estimated to be between 2.7–5.2 million peopleCitation3,Citation4, making it the most common blood-borne infection in the US. Genotype 1 (GT1) is the most common HCV genotype in the USCitation5. The prevalence of more advanced liver disease is expected to increase, as well as the total cost associated with chronic HCV infectionCitation6. Chronic hepatitis C (CHC) currently costs the US healthcare system ∼$6.5 billion annually and is expected to reach $9.1 billion by 2024Citation6.
The marker for cure of HCV infection, sustained virologic response (SVR), defined as undetectable viral load at least 12 weeks after completion of therapy, may halt HCV disease progressionCitation7. Numerous trials have reported high SVR rates in novel direct-acting antivirals (DAAs) therapies.
In particular, several sofosbuvir (SOF)-based regimens were approved by the US Food and Drug Administration (FDA) as the first DAA treatments in the past few years. These regimens have demonstrated high efficacy compared to older therapies, such as protease inhibitor-based or peg-interferon-based regimens, and a number of studies have compared the cost-effectiveness of SOF-containing regimens to older therapies. For example, Saab et al.Citation8 found SOF + pegylated interferon/ribavirin (SOF + PR) to be more cost-effective than other therapies in GT1. Hagan et al.Citation9 reported SOF + simeprevir (SOF + SMV) to have lower costs and more quality-adjusted life years (QALYs) compared to SOF + ribavirin (SOF + R) in GT1. In other studies, SOF + ledipasvir (SOF/LDV) has been reported to be an optimal strategy in GT 1 depending on its cost, but not in other genotypesCitation9,Citation10.
Ombitasvir/paritaprevir/ritonavir + dasabuvir ± ribavirin (3D ± R) was approved by the FDA for treating GT1 patients in the US in December 2014 and ombitasvir/paritaprevir/ritonavir + ribavirin (2D + R) for treating genotype 4 (GT4) non-cirrhotic HCV patients in July 2015. Based on the American Association for the Study of Liver Diseases (AASLD) and the Infectious Diseases Society of America (IDSA) guidelinesCitation11, DAAs recommended for treating GT1 patients include 3D ± R, SOF/LDV, SOF + SMV and simeprevir + pegylated interferon/ribavirin (SMV + PR); and 2D + R and SOF/LDV for GT4.
There have been no published data comparing the cost-effectiveness of the currently recommended DAA regimens for treating GT1 or GT4 HCV patients in the US. The purpose of this study is to fill this gap in the literature. Specifically, we sought to compare the lifetime costs, liver outcomes, quality-adjusted life years (QALYs), and overall cost-effectiveness in patients with GT1 or GT4.
Methods
A cost-effectiveness analysis of treatments for CHC from the US healthcare system perspective with a lifetime horizon over annual cycles was performed.
Natural history of HCV
A Markov state-transition model was developed based on the natural history of CHC from Liu et al.Citation12 (). The model characterized different health states associated with the disease based on liver histology and clinical characteristics. Health states included five early stages of CHC based on METAVIR score [no fibrosis (F0), portal fibrosis with no septa (F1), portal fibrosis with few septa (F2), numerous septa without cirrhosis (F3), and compensated cirrhosis (CC, F4)], a spontaneous clearance state (No HCV), three SVR states [recovered-history of mild disease (F0 or F1), recovered-history of moderate disease (F2 or F3), recovered-history of compensated cirrhosis (F4)], decompensated cirrhosis (DCC), HCC, liver transplant (LT), and two absorbing mortality states (LrD and non-liver related death).
Figure 1. Health state transition model. Health states are depicted by ellipses, while arrows represent permissible transitions between health states (hashed arrows depict the possibility of achieving SVR and dotted arrows depict a potential reinfection). Note: Model also includes HCC and liver transplant health states for first and subsequent years in those conditions.
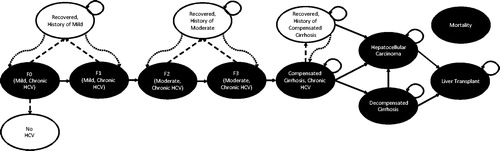
There were two phases of disease progression: (1) progression through fibrosis stages F0–F4, and (2) progression beyond fibrosis stage F4 (i.e. non-fibrosis progression). The transition rates () were based on previously published empirically calibrated models of HCV infection in the USCitation12,Citation13, and a longitudinal study of treated HCV patients with and without SVRCitation14. In the model, fibrosis progression in the absence of SVR depended on age and genderCitation12. Patients with fibrosis stage F0 could experience a spontaneous clearance of the virus and return to the HCV negative state. Patients who achieved SVR transitioned to recovered states stratified by fibrosis severity (mild [F0–F1], moderate [F2–F3], and severe [F4]), which accounted for risks faced by patients with different disease histories. Patients with mild or moderate fibrosis who achieved SVR were assumed not to transition to more severe HCV-related health states.
Table 1. Transition-state probabilities, costs, and health-utilities.
During the non-fibrosis progression phase, patients with cirrhosis faced the risk of transitioning to HCC or DCC. Cirrhotic patients who achieved SVR also faced the risk of progressing to HCCCitation14. Patients with HCC or DCC could receive liver transplants. For all patients who achieved SVR, HCV re-infection was possible. Re-infected patients were assumed to transition back to their respective fibrosis state prior to achieving SVR, and then progress through the most severe health states at the same rate as untreated patients. The model did not include fibrosis stage improvement (i.e. regression) after achieving SVR.
In the absence of SVR, patients remained in their existing health state or progressed to more severe stages of liver disease, as shown in . Patients without SVR were assumed to face the same risks for disease progression as untreated patients. HCC and LT had separate health states for initial and subsequent years (not depicted). This was done to account for different mortality rates and costs in the first year compared to subsequent years. Mortality rates were derived from the US life tablesCitation15.
Study population and treatment comparisons
Guidelines-recommended regimens for HCV differ by genotype. For that reason we conducted separate analyses for populations with GT1 and GT4. For GT1 (any METAVIR score) the treatment regimens included in the analysis were 3D ± R, SOF/LDV, SOF + SMV, SMV + PR, and no treatment (NT). The analyses for the GT4 population were restricted to non-cirrhotic HCV patients (METAVIR stages F0–F3) because efficacy data were not available for 2D + R in the cirrhotic population at the time this analysis was conducted. The treatment regimens compared were 2D + R, SOF/LDV and NT.
Patient baseline characteristics
Patient characteristics for each cohort on entry to the model (start of treatment) were based on pooled data from the SAPPHIRE ICitation16 and IICitation17; PEARL IICitation18, IIICitation19, and IVCitation19; and TURQUOISE IICitation20 clinical trials. The average age was 53.6 years and 62.5% of patients were male in both genotype cohorts. The baseline distributions of patients by treatment history, fibrosis stage, and genotype are shown in .
Table 2. Baseline patient characteristics.
Clinical inputs
The clinical inputs for treatment efficacy, duration, and adverse events were derived from clinical trials of study drugs (). The treatment efficacy measure was SVR rates, which was assessed 12 weeks after treatment was completed. In the GT1 analysis, SVR rates were stratified by sub-genotype (i.e. 1a and 1b), treatment history (treatment-naïve and -experienced), and cirrhosis status (cirrhotic and non-cirrhotic). The data were then combined based on the baseline distribution of patients based on sub-genotype, treatment history, and cirrhosis status. We refer to the combined rate as the overall SVR.
Table 3. Sustained virologic response, adverse events, drug costs, and regimen-related disutilities.Table Footnotea
Incidence rates of treatment-related adverse events (AE), including anemia, rash, depression, grade 3/4 neutropenia, and grade 3/4 thrombocytopenia were obtained from the same clinical trials for each regimen. Outcomes for NT were assumed to be zero (i.e. SVR rates, rates of AE, regimen-related disutility, and cost of treatment).
Health utilities
Utility estimates for each health state are shown in . Health state utilities were based on Liu et al.Citation12. SVRs in patients with mild fibrosis, moderate fibrosis, or compensated cirrhosis were associated with increases in health utility of 0.02, 0.083, and 0.143, respectively, from the untreated health state utility (shown as “recovered” in ). This is based on the evidence that SVR increases long-term health utilityCitation12. All increases after SVR were assumed to occur in the second model cycle.
Treatment-related utility decrements were generally attributed to adverse effects ()Citation21. The decrement in utility was applied for the duration of time that a patient was on therapy. Treatment disutilities for 3D ± R and 2D + R were derived based on EQ-5D utility data from related trials. Due to lack of data availability, regimen-related disutility for SOF + SMV and SOF/LDV was assumed to be equal to the average annualized on-treatment disutility of 3D ± R and 2D + R adjusting for treatment duration. The treatment-related decrements for SMV + PR were taken from a health technology assessmentCitation9.
Costs
Only direct medical costs were considered. These included the costs for the regimen, health-state related costs for medical treatment, and adverse event costs (). All costs in the model were adjusted to 2015 dollars using the consumer price index (medical component) from the US Bureau of Labor StatisticsCitation22.
Drug costs were based wholesale acquisition cost (WAC) obtained from the 2015 RedbookCitation23 and calculated as the sum product of daily WAC for each component of the regimen and the mean duration of treatment (in days). The latter was obtained from the clinical trials previously mentioned for each treatment included in the model.
Health state medical costs were defined as annual HCV-related costs for a patient in a given health state and included inpatient and outpatient visits, diagnostic and laboratory testing, other medications and procedures, and other direct medical costs. Costs of recovered states (after SVR) were assumed to be 50% lower than otherwiseCitation24.
The costs for treating AEs associated with treatment were obtained from the published literature. Total costs or adverse events in the model are calculated as the product of the adverse event rate and the adverse event cost.
Analyses
Costs and outcomes were discounted by 3% annuallyCitation25,Citation26. For each cohort of interest (GT1 and GT4), model outcomes included lifetime costs, life years, quality-adjusted life-years (QALYs), and incremental cost-effectiveness ratios (ICERs) and lifetime risk of CC, DCC, HCC, LT, and LrD.
Probabilistic sensitivity analyses (PSA) were performed to examine the uncertainty surrounding the cost-effectiveness estimates. Variables that were varied in the PSA were baseline patient characteristics, transition probabilities, costs, health utilities, SVR rates, and adverse event rates. SVR and AE rates were assumed to vary ±1.96-times their standard errors (Supplemental Table A1).
Results from the PSA were summarized in the cost-effectiveness acceptability curves (CEACs). For each CEAC, 500 Monte Carlo simulations were conducted using standard assumptions on the parametric distribution for each variable (i.e. dirichlet for fibrosis distribution, gamma distribution for age, beta distribution for probabilities, normal, or gamma distribution for costs).
Deterministic sensitivity analyses (DSA) assessed parameter uncertainty by individually varying the following inputs at low and high values while leaving other inputs at their base case value: SVR rate, AE rate, patient baseline characteristics (including gender, age, and fibrosis distribution), transition probabilities, health-state costs, utilities, and discount rate (Supplemental Table A1). SVR and AE rates were assumed to vary ±1.96-times their standard errors. The results of the DSA were generated using the net monetary benefit (NMB) approach assuming a payer willingness-to-pay of $100,000. The results of the DSA are summarized in tornado diagrams presenting the 20 most influential parameters.
Results
Liver disease outcomes
Percentages of patients who ever experienced CC, DCC, HCC, LT, or LrD over the lifetime are shown in . As expected, patients who were not treated were more likely to experience a liver event. On average, liver-related mortality in patients treated with 3D ± R or SOF-based regimens was at least 74% lower than that in those who were untreated in the GT1 cohort; and liver-related mortality in patients treated with 2D + R was over 80% lower compared to those who were untreated in the GT4 cohort. Compared to NT, the number needed to treat (NNT) with 3D ± R or SOF-based regimens to prevent one LrD was ∼3.6 in the GT1 cohort. In the GT4 cohort, compared to NT, the number needed to treat to avoid one LrD was 4.1 for SOF/LDV and 3.8 for 2D + R.
Table 4. Lifetime liver outcome rates by treatment.
In the GT1 population treated with DAA regimens, 3D ± R was associated with the lowest rates of all lifetime liver disease outcomes, and SMV + PR was associated with the highest rates of liver events (). Rates for SOF + SMV and SOF/LDV were similar to 3D ± R.
In the GT4 cohort, 2D + R was associated with lower risks of liver disease across all outcomes compared with SOF/LDV. 2D + R also produced an 82% lower rate of CC and an 88% lower rate of LrD compared to NT.
Cost-effectiveness
Results for total costs, life-years, QALYs, and cost-effectiveness of treatment options are summarized in , where we present the results for the overall, treatment-naïve, and treatment-experienced patient cohorts separately. NT was associated with the lowest total lifetime cost of $48,264 in the overall GT1 population. Total lifetime cost per patient among DAA treatment options ranged from a low of $100,282 for 3D ± R to a high of $190,682 for SOF + SMV. Among all the treatment options, NT was associated with the lowest QALYs (13.08), and 3D ± R and SOF + SMV with the highest QALYs (16.20). Among all DAA regimens in the GT1 population, 3D ± R had the lowest ICER compared to NT ($16,677 per QALY). 3D ± R was also the least costly regimen that offered the highest QALYs, i.e. it dominated the other DAA treatment options in the overall GT1 cohort (). The cost per SVR was $103,410 for 3D ± R, which was also the lowest among the treatment options. The cost per SVR for SOF/LDV, SMV + PR, and SOF + SMV was $113,358, $161,515, and $198,421, respectively (). Similarly, in treatment-naïve patients, 3D ± R dominated all the DAA treatment options. In treatment-experienced patients, 3D ± R dominated SOF/LDV and SMV + PR. SOF + SMV conferred a higher QALY, but was more costly: its ICER vs 3D ± R was $5,132,925 per QALY, well above the traditional willingness-to-pay per QALY threshold in the US.
Figure 2. Scatter plot of total cost and QALYs for DAA regimens in GT1 cohort. For each treatment the point shown represents the total cost and QALYs produced.
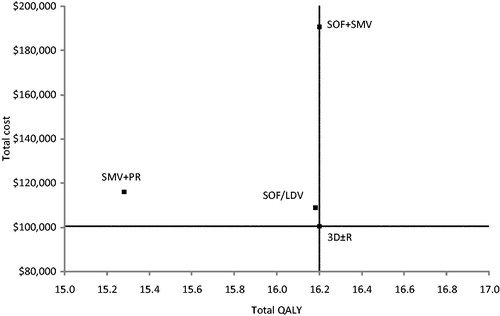
Table 5. Total costs, life-years, QALYs, and cost-effectiveness of treatments.
In GT4 patients, 2D + R dominated SOF/LDV and NT in all patient segments (). Specifically, in the overall patient cohort, NT had the lowest total cost ($36,407) and the lowest life-years (16.01) and QALYs (14.00). 2D + R had a lower cost compared to SOF/LDV ($83,301 vs $102,355) and produced more QALYs (16.83 vs 16.59). The cost per SVR for 2D + R and SOF/LDV was $83,301 and $111,812, respectively.
Sensitivity analysis
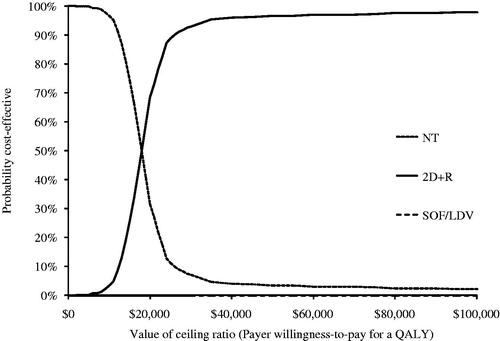
The PSA was conducted to assess the robustness of our results over a plausible range of values of inputs in the model. The PSA results for the GT1 cohort showed that at a willingness-to-pay threshold less than $18,000 per QALY, NT is the preferred option, and at a willingness-to-pay threshold above $18,000, 3D ± R is the preferred option (). None of the other treatment options was preferred at any given willingness-to-pay threshold. The PSA results for the GT4 analysis were similar (). At a willingness-to-pay threshold less than $18,000 per QALY NT is the preferred option, but at a willingness-to-pay threshold above $18,000, 2D + R is the preferred option. For completeness, PSA analyses were conducted in treatment-naïve and -experienced GT1 and non-cirrhotic GT4 cohorts presented in Supplemental Figures A1–A4.
Figure 3. Cost-effectiveness acceptability curves for GT1 analysis. Curves shown represent results from Monte Carlo simulations in probabilistic sensitivity analysis of treatment options compared in the GT1 population. Each line (representing a different treatment option) shows the percentage of simulations that option was the most cost-effective at each willingness-to-pay threshold. Note that only options that were estimated to be most cost-effective in at least one simulation appear in figure.
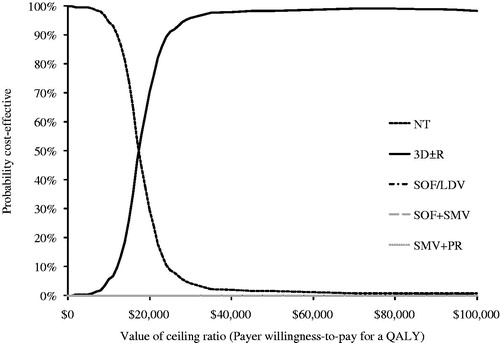
Figure 4. Cost-effectiveness acceptability curves for non-cirrhotic GT4 analysis. Curves shown represent results from Monte Carlo simulations in probabilistic sensitivity analysis of treatment options compared in the GT4 population. Each line (representing a different treatment option) shows the percentage of simulations that option was the most cost-effective at each willingness-to-pay threshold. Note that only options that were estimated to be most cost-effective in at least one simulation appear in figure.
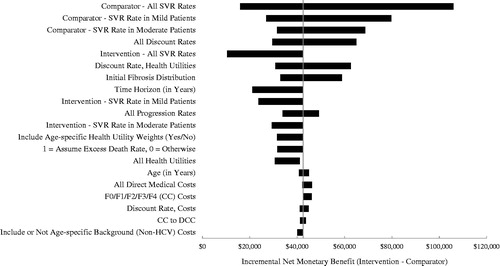
The results of the DSA comparing 3D ± R to SOF/LDV in GT1 and 2D + R to SOF/LDV in non-cirrhotic GT4 are presented for overall, treatment-naïve, and -experienced cohorts. In GT1 patients, SOF/LDV SVR rates have the largest impact on the incremental NMB (INMB) values ranging from −$2421 to $28,196; all other parameters generate positive INMB values (see ; positive values indicate that 3D ± R is more cost-effective, negative values that SOF/LDV is more cost-effective). For the GT4 non-cirrhotic cohort, all 20 scenarios produced positive INMB values in favor of 2D + R, which are contained in the $10,436–$105,982 interval, with SOF/LDV SVR rates having the largest impact (). For completeness, DSA analyses were conducted in treatment-naïve and -experienced GT1 and non-cirrhotic GT4 cohorts presented in Supplemental Figures A5–A8. In GT1 treatment-naïve patients, SOF/LDV SVR rates have the largest impact on the results, with a range of INMB of −$6746 to $19,853 (see Supplemental Figure A5); in four other comparisons, the parameters could affect conclusions. For the GT1 treatment-experienced cohort, all 20 scenarios produced positive INMB values favoring 3D ± R, with the range of INMB values contained in the $9816–$39,658 interval (Supplemental Figure A6). In both non-cirrhotic GT4 treatment-naïve and -experienced cohorts, all 20 scenarios produced positive INMB with respective ranges of $9653–$82,668 and $11,830–$151,032 (Supplemental Figures A7 and A8).
Figure 5. Tornado diagram comparing 3D ± R (Intervention) to SOF/LDV (Comparator) in GT1 patients. The diagram shows the impact of individually varying parameters in the base case expressed in incremental net monetary benefit (INMB) assuming a payer willingness-to-pay of $100,000. Positive INMB values indicate that 3D ± R is cost-effective and negative INMB values indicate that SOF/LDV is cost-effective. The diagram shows the impact of the 20 most influential parameters. The tornado diagram is centered on the base case INMB value for the comparison of 3D ± R to SOF/LDV in GT1 patients, which is $10,435.
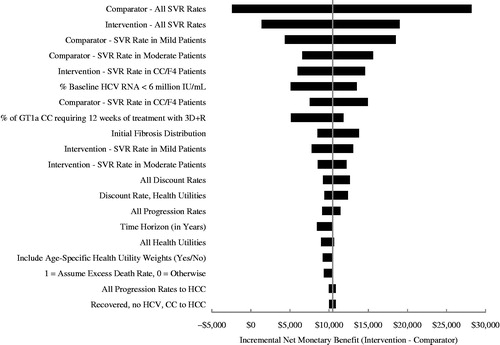
Figure 6. Tornado diagram comparing 2D + R (Intervention) to SOF/LDV (Comparator) in non-cirrhotic GT4 patients. The diagram shows the impact of individually varying parameters in the base case expressed in incremental net monetary benefit (INMB), assuming a payer willingness-to-pay of $100,000. Positive INMB values indicate that 2D + R is cost-effective and negative INMB values indicate that SOF/LDV is cost-effective. The diagram shows the impact of the 20 most influential parameters. The tornado diagram is centered on the base case INMB value for the comparison of 2D + R to SOF/LDV in non-cirrhotic GT4 patients, which is $42,475.
Discussion
Our study results showed that in the US GT1 and GT4 CHC populations, 3D ± R and 2D + R, respectively, are not only associated with the lowest lifetime risks of liver morbidity and mortality, but also are the most cost-effective options compared to NT and other recommended novel DAA regimens.
This is the first study comparing the cost-effectiveness of novel DAA HCV treatments, including 3D ± R and 2D + R, in both GT1 and GT4 CHC populations, and as such should be of importance to payers in the US who are faced with formulary and coverage decisions for CHC. Compared to older regimens the newer DAA therapies have several advantages, including superior effectiveness. Only one published study has included 3D ± R among the treatment options. Zhang et al.Citation27 found that 3D ± R dominated SOF/LDV and other treatments for GT1 in patients without cirrhosis. They also concluded that SOF-based treatments for GT1 were generally not cost-effective due to high costs. In our study, 3D ± R and 2D + R were the optimal treatments for GT1 and GT4, respectively.
Many previous cost-effectiveness studies compared DAAs to older interferon-containing regimens. In addition to the analyses in the overall GT1 and GT4 populations, we also examined the cost-effectiveness of SOF + PR and SOF + R, where efficacy and safety data were only available in the treatment-naïve patients. Compared with 3D ± R, both SOF + PR and SOF + R were more costly and generated fewer QALYs, and were, therefore, dominated in the GT1 treatment-naïve sub-population. Results were similar in the treatment-experienced sub-population, although SOF + SMV was not dominated, having a marginally higher incremental QALY-based n = 21 patients in the COSMOS trialCitation28, but also having incremental costs $100,000 higher than 3D ± R. Similarly, in the GT4 treatment-naïve non-cirrhotic sub-population, 2D + R dominated SOF + PR with lower costs and more QALYs.
According to a recent review of the literature, the cost-effectiveness of novel agents for treatment of CHC is contingent upon a variety of factors, including HCV genotype, presence of liver cirrhosis, treatment history, and willingness-to-pay thresholdsCitation29. In our study, we included GT1 patients with all fibrosis stages, while for GT4 we only included non-cirrhotics, given the trial data availability. These and other characteristics of our model and analyses should be considered when interpreting our results.
Our model is subject to several limitations. First, our model did not consider the potential for patients to regress to a less severe disease state after SVR as in other HCV modelsCitation10. The inclusion of disease regression would further reduce the costs and improve utilities for patients that achieved an SVR. Without counting for additional benefits derived from regression, our modeling approach was conservative.
Second, in our model treatment was only possible during the first cycle of the model and re-treatment was not considered. In actual practice it may be unlikely that a re-infected patient would remain without treatment for life.
Third, many of the input values used in the model were from randomized controlled trials with restricted inclusion criteria and closer monitoring, which may not be transferable to the real world. While long-term liver outcomes were not directly measured in clinical trials, they were extrapolated based on SVR. Despite these limitations, trials are used to make regulatory decisions in the US and are not subject to questions of confounding common to observational studies.
Fourth, cost inputs used in this model were obtained from published sources and may not represent the actual costs faced by payers. For example, payers may negotiate on the prices; the discounts are not usually publicly available, and may vary by payer, and thus were not included in the model. Also, while costs generally fluctuate over time, geographically, and by provider, direct medical costs in our model were assumed to be constant over time. Moreover, this analysis was conducted from the perspective of the third-party payers, and did not include non-medical or indirect costs. Had such costs been included, the economic benefit of treatment would have been greater.
Last, to understand if these and other limitations of our analysis impacted our findings, we conducted DSA and PSA where inputs were varied across a range of plausible values. This analysis confirmed the robustness of our findings. Nevertheless, caution is advised when generalizing these results as they may differ by settings that affect treatment outcomes such as payer type, individual patient comorbidities and characteristics, treatment administration, and adherence. Until then, our analysis offers US payers important insight on the cost-effectiveness of novel treatments in patients GT1 and GT4 HCV.
Conclusion
Among currently recommended treatments for GT1 and GT4 CHC in the US, 3D ± R (for GT1 HCV) and 2D + R (for GT4 HCV) have a favorable cost-effectiveness profile.
Transparency
Declaration of funding
Design, analysis, and financial support of this study were provided by AbbVie.
Declaration of financial/other relationships
SS is employed by the Pfleger Liver Institute at UCLA and is a consultant for AbbVie. He is also a consultant and on the speaker bureau for BMS, Gilead, Merck, and Janssen pharmaceuticals. SJ and SV are employed by Medicus Economics LLC, which received payment from AbbVie to undertake research. HP is a contractor for Medicus Economics LLC. AW, YSG, and SEM are AbbVie employees and may own AbbVie stock. DM is a former AbbVie employee and may own Abbvie stock. AbbVie is the manufacturer of ombitasvir/paritaprevir/ritonavir, dasabuvir (Viekira Pak™).
Supplemental_material
Download PDF (167.9 KB)Acknowledgments
Assistance with manuscript preparation was provided by Glen Schumock, Managing Partner at Second City Outcomes Research, LLC. Funding for the medical writing was provided by AbbVie.
Related Research Data
References
- Liang TJ, Rehermann B, Seeff LB, et al. Pathogenesis, natural history, treatment, and prevention of hepatitis C. Ann Intern Med 2000; 132:296-305
- Seeff LB. Natural history of chronic hepatitis C. Hepatology 2002;36(5 Suppl 1):S35-S46
- Chak E, Talal AH, Sherman KE, et al. Hepatitis C virus infection in USA: an estimate of true prevalence. Liver Int 2011;31:1090-101
- Denniston MM, Jiles RB, Drobeniuc J, et al. Chronic hepatitis C virus infection in the United States, National Health and Nutrition Examination Survey 2003 to 2010. Ann Intern Med 2014;160:293-300
- Manos MM, Shvachko VA, Murphy RC, et al. Distribution of hepatitis C virus genotypes in a diverse US integrated health care population. J Med Virol 2012;84:1744-50
- Razavi H, Elkhoury AC, Elbasha E, et al. Chronic hepatitis C virus (HCV) disease burden and cost in the United States. Hepatology 2013;57:2164-70
- Koh C, Heller T, Haynes-Williams V, et al. Long-term outcome of chronic hepatitis C after sustained virological response to interferon-based therapy. Aliment Pharmacol Ther 2013;37:887-94
- Saab S, Gordon SC, Park H, et al. Cost-effectiveness analysis of sofosbuvir plus peginterferon/ribavirin in the treatment of chronic hepatitis C virus genotype 1 infection. Aliment Pharmacol Ther 2014;40:657-75
- Hagan LM, Sulkowski MS, Schinazi RF. Cost analysis of sofosbuvir/ribavirin versus sofosbuvir/simeprevir for genotype 1 hepatitis C virus in interferon-ineligible/intolerant individuals. Hepatology 2014;60:37-45
- Younossi ZM, Park H, Saab S, Ahmed A, et al. Cost-effectiveness of al-oral ledipasvir/sofosbuvir regimens in patients with chronic hepatitis C virus genotype 1 infection. Aliment Pharmacol Ther 2015;41:544-63
- AASLD-IDSA. Recommendations for testing, managing, and treating hepatitis C. http://www.hcvguidelines.org. Accessed May 30, 2015
- Liu S, Cipriano LE, Holodniy M, et al. New protease inhibitors for the treatment of chronic hepatitis C: a cost-effectiveness analysis. Ann Intern Med 2012;156:279-90
- Salomon JA, Weinstein MC, Hammitt JK, et al. Cost-effectiveness of treatment for chronic hepatitis C infection in an evolving patient population. JAMA 2003;290:228-37
- Cardoso AC, Moucari R, Figueiredo-Mendes C, et al. Impact of peginterferon and ribavirin therapy on hepatocellular carcinoma: incidence and survival in hepatitis C patients with advanced fibrosis. J Hepatol 2010;52:652-7
- Arias E. United States life tables, 2009. Hyattsville, MD; National Center for Health Statistics, 2014
- Feld JJ, Kowdley KV, Coakley E, et al. Treatment of HCV with ABT-450/r-ombitasvir and dasabuvir with ribavirin. N Engl J Med 2014;370:1594-603
- Zeuzem S, Jacobson IM, Baykal T, et al. Retreatment of HCV with ABT-450/r-ombitasvir and dasabuvir with ribavirin. N Engl J Med 2014;370:1604-14
- Andreone P, Colombo MG, Enejosa JV, et al. ABT-450, ritonavir, ombitasvir, and dasabuvir achieves 97% and 100% sustained virologic response with or without ribavirin in treatmentexperienced patients with HCV genotype 1b infection. Gastroenterology 2014;147:359-65.e1
- Ferenci P, Bernstein D, Lalezari J, et al. ABT-450/r-ombitasvir and dasabuvir with or without ribavirin for HCV. N Engl J Med 2014;370:1983-92
- Poordad F, Hezode C, Trinh R, et al. ABT-450/r-ombitasvir and dasabuvir with ribavirin for hepatitis C with cirrhosis. N Engl J Med 2014;370:1973-82
- Vera-Llonch M, Martin M, Aggarwal J, et al. Health-related quality of life in genotype 1 treatment-naive chronic hepatitis C patients receiving telaprevir combination treatment in the ADVANCE study. Aliment Pharmacol Ther 2013;38:124-33
- Mauskopf JA, Mitchell S, Samuel M, et al. Systematic literature review to identify cost estimates of liver disease in those with chronic hepatitis C virus (HCV) in the United States. ISPOR 20th Annual International Meeting Philadelphia, PA; 2015
- RED BOOK Online [database online]. Truven Health Analytics Micromedex Solutions, 2015
- Younossi ZM, Kanwal F, Saab S, et al. The impact of hepatitis C burden: an evidence-based approach. Aliment Pharmacol Ther 2014;39:518-31
- Gold M, Siegel J, Russell L, et al. Cost effectiveness in Health and Medicine: report of the Panel on Cost effectiveness in Health and Medicine. New York: Oxford University Press, 1996
- Weinstein MC, Siegel JE, Gold MR, et al. Recommendations of the Panel on Cost-effectiveness in Health and Medicine. JAMA 1996;276:1253-8
- Zhang S, Bastian ND, Griffin PM. Cost-effectiveness of sofosbuvir-based treatments for chronic hepatitis C in the US. BMC Gastroenterol 2015;15:98
- Lawitz E, Sulkowski MS, Ghalib R, et al. Simeprevir plus sofosbuvir, with or without ribavirin, to treat chronic infection with hepatitis C virus genotype 1 in non-responders to pegylated interferon and ribavirin and treatment-naive patients: the COSMOS randomised study. Lancet 2014;384:1756-65
- Bickerstaff C. The cost-effectiveness of novel direct acting antiviral agent therapies for the treatment of chronic hepatitis C. Expert Rev Pharmacoecon Outcomes Res 2015;15:787-800
- McAdam-Marx C, McGarry LJ, Hane CA, et al. All-cause and incremental per patient per year cost associated with chronic hepatitis C virus and associated liver complications in the United States: a managed care perspective. J Manag Care Pharm 2011;17:531-46
- Gao X, Stephens JM, Carter JA, et al. Impact of adverse events on costs and quality of life in protease inhibitor-based combination therapy for hepatitis C. Expert Rev Pharmacoecon Outcomes Res 2012;12:335-43
- Brogan AJ, Talbird SE, Thompson JR, et al. Cost-effectiveness of Telaprevir combination therapy for chronic hepatitis C. PLoS One 2014;9:e90295
- Poordad F, Theodore D, Sullivan J, et al. Medical resource utilisation and healthcare costs in patients with chronic hepatitis C viral infection and thrombocytopenia. J Med Econ 2011;14:194-206
- Hezode C, Asselah T, Reddy KR, et al. Ombitasvir plus paritaprevir plus ritonavir with or without ribavirin in treatment-naive and treatment-experienced patients with genotype 4 chronic hepatitis C virus infection (PEARL-I): a randomised, open-label trial. Lancet 2015;385:2502-9
- Afdhal N, Zeuzem S, Kwo P, et al. Ledipasvir and sofosbuvir for untreated HCV genotype 1 infection. N Engl J Med 2014;370:1889-98
- Kowdley KV, Gordon SC, Reddy KR, et al. Ledipasvir and sofosbuvir for 8 or 12 weeks for chronic HCV without cirrhosis. N Engl J Med 2014;370:1879-88
- Afdhal N, Reddy KR, Nelson DR, et al. Ledipasvir and sofosbuvir for previously treated HCV genotype 1 infection. N Engl J Med 2014;370:1483-93
- Abergel A, Loustaud-Ratti V, Metivier S, et al. Ledipasvir/Sofosbuvir for the treatment of patients with chronic genotype 4 or 5 HCV infection. The International Liver Conference. Vienna Austria: EASL, 2015
- Jacobson IM, Dore GJ, Foster GR, et al. Simeprevir with pegylated interferon alfa 2a plus ribavirin in treatment-naive patients with chronic hepatitis C virus genotype 1 infection (QUEST-1): a phase 3, randomised, double-blind, placebo-controlled trial. Lancet 2014;384:403-13