
Abstract
Objective: This retrospective study compared the real-world incidence and costs of systemic treatment-related adverse events (AEs) in patients with metastatic breast cancer in a Medicaid population.
Methods: Insurance claims data for adult women who received biologic or chemotherapy (± hormonal therapy) for metastatic breast cancer between 2006–2013 were extracted from the Truven Health MarketScan® Multi-State Medicaid database. Incidence of AEs (per 100 person years) and average monthly AE-related healthcare costs (per-patient-per-month) during each line of therapy (first or later lines) were estimated. The association between AEs and total all-cause healthcare costs was estimated using multivariable regression.
Results: A total of 729 metastatic breast cancer patients were analyzed. Hematological (202.3 per 100 person years) and constitutional AEs (289.6 per 100 person years) were the most common class of AEs reported. Unadjusted per-patient-per-month AE-related expenditure by class were highest for hematological AEs ($1524), followed by gastrointestinal ($839) and constitutional AEs ($795), with anemia ($942), nausea/vomiting ($699), and leukopenia/neutropenia ($550) having incurred the highest total AE-related costs. Adjusted total all-cause monthly costs increased with the number of AEs ($19,701 for >7 AEs, $16,264 for 4 − 6 AEs, and $13,731 for 1 − 3 AEs) compared to no AEs ($5908) (all p < 0.01).
Conclusions: Among metastatic breast cancer patients treated with systemic therapy in a Medicaid population, AEs were associated with significant increases in costs, which increased with the number of AEs experienced. Therapies associated with a lower incidence of AEs may reduce cost burden and improve patient outcomes.
Introduction
Breast cancer is the most frequently diagnosed cancer and second leading cause of cancer-related death in women in the US, with ∼231,840 new cases and 40,290 deaths in 2015Citation1,Citation2. Currently, more than 2.8 million women live with breast cancer in the USCitation1. The median age at diagnosis is 61 years, with half of newly-diagnosed breast cancer occurring in women younger than 61 years of ageCitation1,Citation3.
The treatment plan to manage breast cancer is dependent on multiple factors such as patient demographic characteristics, treatment history, comorbid conditions, tumor characteristics, and toxicity profiles of therapy optionsCitation4. An array of treatment options such as surgery, radiation, chemotherapy, and hormone therapy are currently employed in the management of breast cancerCitation5. Clinical management of breast cancer underwent a discernible shift with the advancements in medical therapy and the availability of new treatment regimensCitation6. The advent of newer chemotherapeutic and biologic drugs has resulted in increased options for metastatic breast cancer treatment, and they have had a profound impact on patient survival and other clinical outcomesCitation7.
Although existing treatments for breast cancer are effective, they are often associated with AEsCitation8. Treatment-related AEs have the potential to impact clinical care by causing treatment delays or dose reductions in therapyCitation9. In addition to the clinical burden, these AEs impose an enormous impact on healthcare expenditures and impair health-related quality-of-life (HRQoL)Citation9–13. In a recent retrospective analysis of metastatic breast cancer patients, chemotherapy-related AEs were associated with an up to 69.5% increase in monthly healthcare expenditureCitation9. In another claims-based study which primarily involved commercially insured metastatic breast cancer patients, presence of any chemotherapy-related AEs increased monthly healthcare costs by $1142–$4437Citation14. However, there are no studies which have evaluated the incidence and costs associated with treatment-related AEs among Medicaid-covered breast cancer patients. Therefore, this retrospective, observational study evaluated the incidence of AEs frequently associated with systemic metastatic breast cancer treatment and quantified the related healthcare costs in Medicaid beneficiaries.
Methods
Study design and data source
This was a longitudinal, retrospective, observational cohort study which used claims data from the Truven Health MarketScan® Multi-State Medicaid database. The Multi-State Medicaid database provides access to comprehensive healthcare data on inpatient medical, outpatient medical, and outpatient prescription drug claims for several million Medicaid beneficiaries annually (∼8.2 million patients in 2013 alone). All study data are de-identified and complied with all aspects of the Health Insurance Portability and Accountability Act of 1996 (HIPAA). As this study used only de-identified patient data, it was exempted from Institutional Review Board approval.
Patient selection
Women, aged 18–64 years, who received biologic or chemotherapy for breast cancer between January 1, 2006 and December 31, 2013 were eligible for inclusion. Patients 65 years and older were not included since they might be dually eligible in Medicaid and Medicare and thereby have missing resource use data in the Medicaid database. Patients were required to have at least one inpatient or two outpatient claims for breast cancer (International Classification of Diseases, Clinical Modification, Ninth Edition [ICD-9-CM] 174.xx) anytime on or before the first date of biologic or chemotherapy administration. The index date was the date of first administration for infused therapy or first prescription for oral therapy. Patients were also required to have continuous enrollment for 6 months pre-index (pre-period) and at least 1 month post-index (post-period) and have no evidence of a primary cancer other than breast cancer during the pre-period (ICD-9-CM diagnosis codes 140.xx–172.xx, 176.xx–184.xx, 188.xx–195.xx, 199.2, 200.xx–209.xx). In addition, patients were required to have either one inpatient or two outpatient claims with metastatic cancer metastasis diagnoses in any position (ICD-9-CM diagnosis codes 196.2x, 196.5x, 196.6x, 196.8x, 196.9x, 197.0x, 197.1x, 197.2x, 197.3x, 197.4x, 197.5x, 197.6x, 197.7x, 197.8x, 198.0x, 198.1x, 198.3x, 198.4x, 198.5x, 198.6x, 198.7x, 198.82, 198.89, 199.0x, 199.1x) within 60 days prior to the breast cancer diagnosis through the end of line of therapy.
Lines of therapy
A line of biologic/chemotherapy corresponded to a period of continuous use of one or more chemotherapeutic and/or biologic agents. A line of therapy began with an index date and ended upon whichever of the following events occurred first: end of continuous enrollment, end of study period (December 31, 2013), inpatient death or the first gap in treatment over 45 consecutive days. Only lines of therapy lasting at least 30 days were included in the analysis. Patients could have had multiple lines of therapy and could also have other treatments such as hormone therapy during their biologic/chemo-line of therapy. The line of therapy was the unit of analysis for all outcomes. The definitions used to create the lines of therapy were based on other published studies and reviewed by an oncologistCitation15–17.
Outcome measures
Within each line of therapy, the occurrence and costs of each AE were measured using the definitions outlined in Supplemental Table S1. The AEs investigated and the definitions implemented were developed based on a combination of published data, package inserts, and clinical opinionCitation8,Citation9,Citation14. The total number of unique AEs experienced and the healthcare expenditures (all-cause and AE-related) were calculated by line of therapy. Baseline evidence of osteoporosis, menopausal symptoms, and cataracts precluded patients being considered at risk for that adverse event during the follow-up period. AEs were identified using the presence of diagnoses or procedure codes and some AEs were also identified with evidence of medications used to treat the condition (anemia, mucositis/stomatitis, insomnia, osteoporosis, menopausal symptoms, and peripheral neuropathy). Selected AEs were required to have an inpatient primary diagnosis (stroke, heart failure, and venous thromboembolism).
Healthcare expenditure data was collected by type of service (e.g. inpatient, outpatient, pharmaceutical, and total healthcare). Claims including diagnosis codes for AEs and, when appropriate, claims for AE-related medications or procedures were included in the calculation of AE-related healthcare costs. AE-related healthcare costs in the inpatient and outpatient settings were identified using diagnoses in the primary or secondary position. Healthcare costs were based on paid amounts of adjudicated claims, including Medicaid payments, as well as patient cost-sharing in the form of copayments, deductibles, and co-insurance. Healthcare costs, including AE costs, that were incurred during the 45-day gap defining the end of a line of therapy were also included.
Covariates
Demographic characteristics were measured on the index date and included age (continuous age), race (Black, White, and Other which included American Indian, Alaska Native, Hispanic, Native Hawaiian, Pacific Islander, other not specified), insurance plan type (Comprehensive, Health Maintenance Organization (HMO), and Other, which included Point of Service with capitation and other not specified), index year, and population density (rural, urban). Clinical characteristics were assessed during the pre-index period and included the NCI modification of the Charlson Comorbidity Index (NCCI)Citation18 (continuous score), prior breast cancer surgery (yes, no), sites of metastasis (lung, brain, liver, lymph nodes, bone, other, not specified), total healthcare expenditures (continuous dollar amount), prior use of systemic breast cancer therapy (none, chemotherapy only, biologic therapy only, both biologic and chemotherapy), comorbid conditions (yes, no for each condition—hypertension, anxiety/depression, diabetes, cardiac arrhythmia), and prior evidence of AEs (yes, no for each AE class).
Statistical analysis
Outcomes were assessed during the post-index period for all metastatic breast cancer patients meeting the study eligibility criteria. All study variables, including demographic, clinical, and treatment characteristics were analyzed descriptively. Since lines of therapy had variable length of follow-up, incidence rates of AEs were calculated by dividing the number of lines of therapy with an AE by the total time at risk for the AE. Time at risk was defined as the days from index date to the first AE event date or the duration of the line of therapy under evaluation for those lines of therapy without AEs. The incidence (per 100 person years) were reported by the class of AEs (cardiovascular, constitutional, gastrointestinal, hematological, menopausal, musculoskeletal, and other AEs) and by specific AEs.
Average per-patient per-month for each line of therapy (PPPM) expenditures were calculated from the index date through the end of the follow-up period. Mean healthcare costs were calculated over all lines of therapy. AE-specific healthcare costs were reported by the class of AEs and for specific AEs that occurred in at least 10% of the patient population and incurred $100 or more in PPPM costs. All costs were adjusted for inflation using the Consumer Price Index (CPI) and standardized to 2013 US dollars. Mean, median, SD, and IQR for unadjusted costs are reported in Supplemental Table S2.
Multivariable regression analyses were conducted to examine the association between total all-cause healthcare costs during the post-index period and the number of AEs that a patient experienced, adjusting for patient demographic and clinical characteristics listed in Supplemental Table S3. The models were estimated using generalized estimating equations that account for within-patient correlation and used a gamma distributed error and log link. Adjusted costs were estimated by the method of recycled predictions. Confidence intervals for incremental adjusted cost were calculated by estimating the standard error of incremental adjusted cost using bootstrapping, a re-sampling method that was implemented by random sampling of the study data with replacement followed by recalculation of incremental adjusted cost from the sample then repeating this procedure 1000 times to approximate the sampling distribution of incremental adjusted cost. A p-value of <0.05 was considered statistically significant.
Results
In total 686 patients met the study selection criteria and had 729 lines of biologic or chemotherapy.
shows the demographics, clinical, and treatment characteristics of the metastatic breast cancer patients over all lines of therapy in the study. On average, the mean age was 49 years, with residence in metropolitan area (73.3%), and comprehensive (59.4%), or HMO (31.6%) healthcare plan coverage. Bone, liver, and lung were the top three most frequent sites of metastasis reported. Overall, 12.1% had a breast cancer-related surgery in the pre-period. Hypertension, anxiety/depression, and diabetes were the most prevalent comorbid conditions measured. The mean all-cause PPPM pre-period healthcare expenditures was $7266. Approximately 37% of the lines of therapy had no record of prior biologic or chemotherapy in their claims history. The mean duration of a line of therapy was 216 days (median = 152 days) and treatment discontinuation was the primary reason for the end of line of therapy (50.1%), followed by end of continuous enrollment (28.5%) and inpatient death (14.7%), with the remainder ending due to the end of the study period (6.7%).
Table 1. Demographic, clinical, and treatment characteristics of patients with metastatic breast cancer.
describes the incidence of AEs among metastatic breast cancer patients. Only 4.5% of the lines of therapy did not have an AE and over 51% reported four or more AEs. The overall incidence rate was 1499.0 per 100 person years for any AEs. Constitutional and hematological AEs were the most common AEs experienced in metastatic patients (constitutional: 289.6 per 100 person years; hematological: 202.3 per 100 person years). The most common AEs in each class were dyspnea, anemia, nausea/vomiting, osteoporosis, and rash.
Table 2. Occurrence and incidenceTable Footnotea of AEs during lines of therapy.
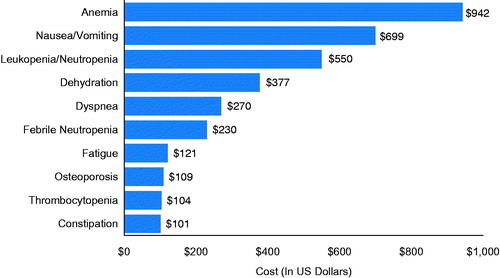
The unadjusted mean (SD) PPPM all-cause healthcare cost was $15,649 ($16,503), with a mean of $8657 ($16,307) for inpatient costs, $5485 ($4331) for outpatient costs (outpatient office visits, emergency room visits, and other outpatient healthcare medical costs), and $1507 ($2347) for outpatient pharmacy costs. Mean PPPM AE-specific expenditures totaled $3621 ($7490), which was approximately over one-fifth of the total all-cause healthcare expenditure. By class, hematological AEs ($1524) incurred the highest PPPM costs followed by gastrointestinal ($839) and constitutional AEs ($795). In addition, cardiovascular, musculoskeletal, and all other class AEs incurred $448, $177, and $131, respectively. shows the mean PPPM AE-specific expenditures for AEs that occurred in at least 10% of total population and had at least $100 PPPM. Anemia ($942), nausea/vomiting ($699), and leukopenia/neutropenia ($550) incurred highest mean total PPPM costs. (Supplementary Table S2 reports mean, SD, median, and IQR for unadjusted costs)
Figure 1. Unadjusted mean PPPM AE-specific expenditures during all lines of therapy. AE, adverse event; PPPM, per-patient-per-month.
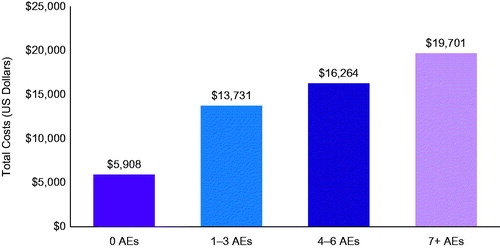
Adjusted total all-cause monthly healthcare costs were significantly higher in those who experienced AEs compared to those without AEs and increased with the number of AEs (). Among metastatic breast cancer patients treated with biologics or chemotherapy, adjusted PPPM total healthcare costs increased by 3.3-fold for >7 AEs ($19,701), 2.8-fold for 4 − 6 AEs ($16,264), and 2.3-fold for 1 − 3 AEs ($13,731) compared to no AEs ($5908) (all p < 0.01) ( and Supplementary Table S3). This translates to incremental costs of $13,792 (95% CI = $10,381–$17,564) for >7 AEs, $10,356 (95% CI = $7944–$12,826) for 4–6 AEs and $7822 (95% CI = $5572–$10,064) for 1–3 AEs compared to no AEs.
Figure 2. Adjusted mean PPPM total all-cause healthcare costs by number of AEs. AE, adverse event; PPPM, per-patient-per-month. Adjusted for all variables included in Supplemental Table S2.
Discussion
Biologic and chemotherapy-related AEs impose an impact on healthcare resource use and costs in patients with metastatic breast cancer. Through this analysis, we determined the incidence of AEs and estimated the AE-related economic burden among breast cancer patients with Medicaid coverage. Results of this study demonstrated that the vast majority of the lines of therapy had at least one AE. Constitutional and hematological AEs were the most frequently diagnosed AEs in this study. Furthermore, we found that these AEs considerably increased all-cause monthly healthcare expenditure in the study cohort, with incremental costs rising directly as the number of AEs increased.
Understanding the patterns of treatment-related AEs and the magnitude of the cost burden due to these AEs may provide useful insights to consider when selecting optimal treatment regimens for metastatic breast cancer patients. Constitutional and hematological AEs were common during chemotherapy/biologic therapy. This is in alignment with previous studies which reported anemia as the most common treatment-related AEs among commercially insured metastatic breast cancer patients treated with first line taxane or capecitabine (Hansen et al.Citation14 13–21%, and Hurvitz et al.Citation9 24–48%, depending on which first line chemotherapy was used). The current study found that more than 90% of the lines of therapy among metastatic breast cancer patients experienced at least one AE. Consistent with our study, a recent claims-based retrospective study by Hurvitz et al.Citation9 in patients with metastatic breast cancer found more than 90% of taxane-treated patients had an AE during first- and second-line treatments. Some of the differences seen in AE rates could be due to the fact that one of these studies examined fewer AEs and different types of AEs compared to our studyCitation14. Another study utilized electronic health records and examined AEs among metastatic breast cancer patients undergoing first line treatment, and also reported that anemia was one of the most common AEs (38%) experience by these patientsCitation8. Two of these studies focused on two specific treatments (taxane and capecitabine), which may account for some of the differences seenCitation9,Citation14. All three of the studies utilized commercially insured populations and only reported the proportion of the patients experiencing AEsCitation8,Citation9,Citation14. We can only directly compare these proportions and, since we had variable follow-up periods, we calculated incidence over the follow-up period for each patient to account for differential follow-up among patients; hence, we can not compare the incidence rates we calculated since these studies did not use this methodology and this could also account for differences seen in AE ratesCitation17.
The unadjusted monthly average all-cause per-patient monthly costs of care for metastatic breast cancer reported in our study ($16,286) are higher than those reported in previous studiesCitation9,Citation14. These prior studies examined only taxane and capecitabine lines of therapy and we analyzed all forms of biologic and chemotherapy which may account for some of these differences. In addition, the prior studies analyzed data from commercial payers where payment structures are known to be different from Medicaid. Also, the underlying patient characteristics in Medicaid populations are known to vary from those covered by commercial payers, which may also account for some of the differences seen in costs. For example, Medicaid populations often have more advanced cancer by the time they enroll in Medicaid, and this may lead to higher costsCitation18.
Analysis of the AE-specific expenditures revealed that hematological AEs contributed to the highest average monthly costs followed by gastrointestinal and constitutional AEs. The increased healthcare expenditures in the hematological class was primarily due to anemia as it was the most common hematologic complications observed in the present study. Similar results were noted by Lyman et al.Citation20, which analyzed administrative claims data among all types of cancer patients receiving chemotherapy and reported that anemia contributed substantially to direct medical costs compared to non-anemic counterparts. Also, as commonly reported with most chemotherapy, nausea and vomiting were also frequent in our study, which could have resulted in an increased economic burden in managing these AEs. This finding is in alignment to a retrospective cohort study that examined hospitalizations for chemotherapy-induced nausea and vomiting among patients with all types of cancer diagnoses and reported higher chemotherapy-induced nausea and vomiting associated costs in cancer patients treated with highly or moderately emetogenic chemotherapyCitation20. A systematic review also highlighted that hematological AEs were associated with increased healthcare costs in cancer patients receiving chemotherapyCitation21.
The multivariable results showed that the adjusted all-cause monthly healthcare costs among lines of therapy with AEs exceeded costs among lines of therapy without an AE. Furthermore, we observed that the incremental costs increased as the number of AEs increased. Incremental costs in our study were mainly driven by an increase in the number of AEs. These findings are consistent with those of previously published studies in metastatic breast cancer which demonstrated that healthcare costs were higher in metastatic breast cancer treated patients with taxane or capecitabine experiencing more AEs patientsCitation9,Citation14. Differences seen in the cost of AEs between other studies and the current analyses may be due to dissimilar reimbursement rates and sociodemographic characteristics of enrolled populations, as commercial and Medicaid health plans enrol populations that differ on these characteristicsCitation22.
Our study has several potential limitations. As with any retrospective analysis using healthcare claims databases, Medicaid data rely on administrative claims data for clinical detail and are subject to data coding limitations and data entry error, potentially introducing measurement error. It is possible that some patients may have received metastatic diagnoses or treatment prior to enrolling in Medicaid which may not be accounted for in this analysis. Although this study identified AEs that are potentially related to treatment, it is not possible to systematically assign causality for the reported AEs. Another limitation is that we could not analyze incidence of AEs by specific biologic or chemotherapy agents due to small numbers of AEs within each medication. Finally, this study comprised only those individuals with Medicaid coverage; therefore, results of this analysis may not be generalizable to metastatic breast cancer patients with other types of insurance or without health insurance coverage.
Conclusions
The findings of this analysis indicate that AEs among metastatic breast cancer patients treated with systemic therapy in a Medicaid population were associated with substantial economic burden, with incremental costs rising directly as the number of AEs increased. Considering the impact of AEs on the healthcare costs, effective therapies with favorable AE profiles should be encouraged in order to reduce costs and improve clinical outcomes among patients with breast cancer. Further, future studies are warranted to characterize the clinical and economic burden of treatment-related AEs in breast cancer patients.
Transparency
Declaration of funding
This study was funded by Genentech Inc. and conducted by Truven Health Analytics, USA.
Declaration of financial/other relationships
DEI and SJ are employees of Truven Health Analytics. Truven Health Analytics received compensation from Genentech Inc for the overall conduct of the study and preparation of this manuscript. AM and BB are employees of Genentech Inc. JME peer reviewers on this manuscript have no relevant financial or other relationships to disclose.
Supplemental_Tables.docx
Download MS Word (20.9 KB)Acknowledgments
Editorial/writing assistance for this manuscript was provided by Santosh Tiwari, who was compensated by Truven Health Analytics. This data was presented for publication only at the 2015 American Society of Clinical Oncology.
Related Research Data
References
- American Cancer Society. Cancer Facts & Figures 2015. Atlanta, GA: American Cancer Society, 2015. http://www.cancer.org/acs/groups/content/@editorial/documents/document/acspc-044552.pdf. Accessed April 21, 2015
- National Cancer Institute. Surveillance Epidemiology and End Results Program. 2012. http://seer.cancer.gov/archive/csr/1975_2012/browse_csr.php?sectionSEL=1&pageSEL=sect_01_table.29.html Accessed June 1, 2016
- Howlader N, Noone AM, Krapcho M, et al., eds. SEER Cancer Statistics Review, 1975-2010. Bethesda, MD: National Cancer Institute, 2013. http://seer.cancer.gov/csr/1975_2010/, based on November 2012 SEER data submission. Accessed April 21, 2015
- National Cancer Institute. Breast Cancer Treatment Health Professional Version. http://www.cancer.gov/types/breast/hp/breast-treatment-pdq Accessed June 1, 2016
- Blowers E, Foy S. Breast cancer overview: current treatments. Practice Nursing 2009;20:282–6. http://libpublic3.library.isu.edu/login?url=http://search.ebscohost.com/login.aspx?direct=true&db=c8h&AN=2010314794&site=ehost-live. Accessed April 21, 2015
- Ferrario C, Batist G. Advances in the approach to novel drug clinical development for breast cancer. Expert Opin Drug Discov 2014;9:647-68
- Tinoco G, Warsch S, Glück S, et al. Treating breast cancer in the 21st century: emerging biological therapies. J Cancer 2013;4:117-32
- Rashid N, Koh HA, Baca HC, et al. Clinical impact of chemotherapy-related adverse events in patients with metastatic breast cancer in an integrated health care system. JMCP 2015;21:863-71
- Hurvitz S, Guerin A, Brammer M, et al. Investigation of adverse-event-related costs for patients with metastatic breast cancer in a real-world setting. Oncologist 2014;19:901-8
- Crown J, Diéras V, Kaufmann M, et al. Chemotherapy for metastatic breast cancer-report of a European expert panel. Lancet Oncol 2002;3:719-27
- Du XL, Osborne C, Goodwin JS. Population-based assessment of hospitalizations for toxicity from chemotherapy in older women with breast cancer. J Clin Oncol 2002;20:4636-42
- Hassett MJ, O’Malley AJ, Pakes JR, et al. Frequency and cost of chemotherapy-related serious adverse effects in a population sample of women with breast cancer. J Natl Cancer Inst 2006;98:1108-17
- Goyal RK, Wheeler SB, Kohler RE, et al. Health care utilization from chemotherapy-related adverse events among low-income breast cancer patients: effect of enrollment in a medical home program. N C Med J 2014;75:231-8
- Hansen RN, Ramsey SD, Lalla D, et al. Identification and cost of adverse events in metastatic breast cancer in taxane and capecitabine based regimens. Springerplus 2014;3:259
- Ray S, Bonthapally V, McMorrow D, et al. Patterns of treatment, healthcare utilization and costs by lines of therapy in metastatic breast cancer in a large insured US population. Comp Eff Res 2013;2:195-206
- Hao Y, Meyer N, Song X, et al. Treatment patterns and survival in metastatic breast cancer patients by tumor characteristics. Curr Med Res Opin 2015;31:275-88
- Donato BM, Willey BL, Cohenuram M, et al. Treatment patterns in patients with advanced breast cancer who were exposed to an anthracycline, a taxane and capecitabine: a descriptive report. Clin Ther 2010;32:546-54
- Bradly CJ, Gardiner J, Given CW, et al. Cancer, Medicaid enrollment and survival disparities. Cancer 2005;103:1712-18
- National Cancer Institute. SEER-Medicare Calculation of Comorbidity Weights. March 2015. http://healthcaredelivery.cancer.gov/seermedicare/program/comorbidity.html Accessed June 1, 2016
- Lyman GH, Berndt ER, Kallich JD, et al. The economic burden of anemia in cancer patients receiving chemotherapy. Value Health 2005;8:149-56
- Burke TA, Wisniewski T, Ernst FR. Resource utilization and costs associated with chemotherapy-induced nausea and vomiting (CINV) following highly or moderately emetogenic chemotherapy administered in the US outpatient hospital setting. Support Care Cancer 2011;19:131-40
- Liou SY, Stephens JM, Carpiuc KT, et al. Economic burden of haematological adverse effects in cancer patients: a systematic review. Clin Drug Invest 2007;27:381-96