
Abstract
Aims: The primary aim of this study was to perform a mapping of the EORTC-QLQ-C30 scores to EQ-5D-3L for the SIRFLOX study; a large dataset of patients with previously untreated liver-only or liver-dominant metastatic colorectal cancer (mCRC). A secondary aim was to compare the predictive validity of existing mappings from EORTC-QLQ-C30 to EQ-5D-3L conducted in other cancers.
Methods and materials: Questionnaires (completed within 529 patients) were used in a linear mixed regression to model EQ-5D-3L utility values (scored using the UK tariff) as a function of the five function scores, nine symptom scores, and the global score from the EORTC-QLQ-C30 questionnaire. A Tobit regression was also performed. The mean EQ-5D-3L values for the SIRFLOX trial were calculated and compared with predicted EQ-5D-3L values derived using published mapping algorithms.
Results: The linear mixed regression model provided a satisfactory mapping between the EORTC-QLQ-C30 and the EQ-5D-3L, whilst the Tobit model did not perform as well. When utilities from the SIRFLOX data were calculated with previously published mapping studies, three out of five studies performed well (< 10% mean difference).
Limitations: The main limitation of the study was the lack of meaningful observations post-progression (67 paired observations). For this reason, this study was unable to test whether the mapping holds by disease stage. Additionally, although the study adds to the literature of mappings to the EQ-5D-3L, it is not known how results would differ using the EQ-5D-5L.
Conclusion: This study is the first of its kind in liver-only or liver-dominant mCRC, and mCRC in general. The mapping constructed showed a good fit to the data and provides practitioners with an additional mapping between EORTC-QLQ-C30 to EQ-5D-3L using a large dataset (529 patients, 707 paired observations). The study also confirmed the generalizability of mappings published by Proskorovsky, Kontodimopoulos, and Longworth to liver-only or liver-dominant mCRC.
Introduction
Cost-utility analysis is practiced by many healthcare authorities, such as the National Institute for Health and Care Excellence (NICE) and the Scottish Medicines Consortium (SMC) in the UK and the Tandvårds- & läkemedelsförmånsverket (TLV) in Sweden, and is one of the most commonly used forms of economic evaluationCitation1,Citation2. This approach takes into account the cost, the quality, and the length of life, which are combined as a cost per quality-adjusted life year. For this, quality-of-life is measured by a utility value—health states are located on this scale based on individuals’ preferences, which are elicited by techniques such as time trade off, visual analogue scale, or standard gamble.
Although many instruments can be used to measure quality-of-life, it is not always possible to generate utilities from the resultsCitation2. Generic preference-based instruments, such as the EQ-5D-3L, are typically used to measure quality-of-life in diseaseCitation3. For many of these instruments, the responses can be transformed into utilities using available population tariffs based on these preferences. The use of condition-specific instruments in clinical trials is also widespread to gain insight on how an intervention affects particular symptoms of a disease. Such instruments are believed to be more sensitive to changes in disease symptoms and they may allow label claims by the US Food and Drug Administration regarding patient-reported outcomes. However, population preferences are generally not available for these metrics, and those that are available seldom have the level of research that has been performed on generic instrumentsCitation2. Owing to the lack of population preference data, it is typically not possible to generate utilities—a solution for this is to map onto generic measures, such as the EQ-5D-3L, by establishing a relationship between the two instruments using regression techniquesCitation3.
The EORTC-QLQ-C30 is one such condition-specific measure, being specific to cancer. As well as more general symptoms, such as pain, it also covers symptoms that are more typically associated with cancers such as fatigue, gastrointestinal symptoms, and financial concerns. Using the Oxford mapping databaseCitation4, we identified nine mappings between the EORTC-QLQ-C30 and the EQ-5D-3L performed across a range of cancers. Of these, five used EQ-5D-3L with the UK tariff. Similarly, Doble and LorgellyCitation5 performed a systematic review, identifying the same nine studies, and one additional study, and applied them to a large Australian dataset (3560 observations) to assess predictive accuracy and external validity across a range of cancers. Two of the 10 studies in the work by Doble and LorgellyCitation5 showed particularly good external validity: those by Longworth et al.Citation3 (which used the UK EQ-5D-3L tariff) and Versteegh et al.Citation6 (which used the Dutch EQ-5D-3L tariff). In addition to the mappings to the EQ-5D-3L, a set of population preferences of 674 multiple myeloma patients, the EORTC-8D, has been developed by Rowen et al.Citation7. However, none of the published studies that used the UK tariff were conducted in, or included, patients with mCRC. The lack of existing mapping algorithms in this patient population means that mappings from alternative cancers must be used to derive utility values from EORTC-QLQ-C30 in mCRC. This may lead to a potential bias of unknown magnitude and direction, as it is possible that the symptoms of different cancers may have different affects.
Therefore, the objectives of this study were to perform a mapping of the EORTC-QLQ-C30 scores to EQ-5D-3L in patients with liver-only or liver-dominant mCRC and to compare the predictive validity of existing methods of utility generation from the EORTC-QLQ-C30 score in this patient population.
Methods
Instruments
The EQ-5D-3L is a generic quality-of-life instrument that is widely used in economic evaluationCitation1. The instrument consists of five items (mobility, self-care, usual activities, pain, and anxiety and depression), each of which has three levels; this results in 243 possible health states in which a patient can reside.
The EORTC-QLQ-C30 is a cancer-specific quality-of-life instrument. It consists of 30 items from which five function scores, nine symptom scores, and a global score can be derived based on the individual responsesCitation8. These instruments are standardized questionnaires with translations that are tested for linguistic and content validity.
Data and software
SIRFLOX was a randomized, multi-center trial designed to assess the efficacy and safety of adding selective internal radiation therapy (SIRT) using yttrium-90 resin microspheres to standard chemotherapy in patients with previously untreated mCRCCitation9. Chemotherapy-naïve patients with liver metastases with or without limited extra-hepatic metastases were randomized to receive either mFOLFOX6 (control arm) or mFOLFOX6 plus SIRT with or without bevacizumab (SIRT arm). Between October 2006 and April 2013, 530 patients were randomized to treatment (control: 263; SIRT: 267).
In the trial, EQ-5D-3L was completed at baseline, 3 months, 6 months, 12 months, and then yearly. EORTC-QLQ-C30 was collected at baseline, 1 month, and 12 months. There was also a small proportion of patients that completed the EORTC-QLQ-C30 at 3 months. Patients were recruited from 87 centers in Australia, Europe, Israel, New Zealand, and the USCitation9.
All analyses were performed in the statistical software R (version 3.2.2), using the packages MASS, nlme, and VGAM.
Mapping analyses
The methods published in the MAPs statementCitation10 and the work by Longworth et al.Citation3 were followed to guide selecting the appropriate model and conducting the analyses.
A linear mixed regression was used to model EQ-5D-3L utility values as a function of the five function scores, nine symptom scores, and the global score from the EORTC-QLQ-C30 questionnaire. A linear mixed regression model consists of both fixed effects and random effects and was used to allow for multiple observations per individual, which are likely to be correlated.
A Tobit regression was also performed. This model, also known as a censored regression model, estimates linear relationships between variables where there is either left or right censoringCitation11. Values that are at or above a threshold take on the value of that threshold. This model was explored as it takes into account that the EQ-5D-3L utility values cannot be greater than one and it is also an approach that has been used in previous mapping algorithmsCitation3,Citation12,Citation13. As with the linear mixed regression, EQ-5D-3L utility values were modeled as a function of the 15 scores available from the EORTC-QLQ-C30 questionnaire.
For use in the regression analysis, observations measured from the same patient within the same visit were paired. Measurements without a corresponding data point in the alternative instrument were dropped from the analysis—as a result, no observations were used from the EQ-5D-3L questionnaires collected at 6 months or post 12 months, and only a fraction of those collected at 3 months were used. The EORTC-QLQ-C30 observations collected at 1 month were dropped from the analysis for the same reason.
The minimum difference considered to be clinically important for this analysis was 0.08Citation14.
For validation of previously published algorithms, we used the sample of matching observations to calculate the mean of the EQ-5D-3L utility values at baseline, pre-progression, and post-progression, using all eligible mapping algorithms. Where more than one algorithm was available, the author’s preferred algorithm was used. Only studies where the UK EQ-5D-3L tariff had been used were included (five studies) to allow a comparison of results. EORTC-8D values were also derived from the EORTC-QLQ-C30, using the mapping algorithm reported by Rowen et al.Citation7.
Performance of mapping algorithms
We used statistical measures to assess the goodness of fit of the models, including the mean absolute error (MAE), root mean squared error (RMSE), and adjusted R2. These performance measures are used to assess goodness of fit in the majority of mapping studies and so using these allows for an easy comparison to existing models. We also plotted the fitted values against the observed values as quantile–quantile plots to visually assess fit, as well as testing the fit of the model in each quartile of results.
Results
Our analysis included 529 patients who completed a total of 1740 EQ-5D-3L observations (1100 pre-progression, 108 post-progression, and 456 where progression status is unreported) and 1241 EORTC-QLQ-C30 observations (789 pre-progression, 108 post-progression, and 344 where progression status is unreported)Citation9. This is shown in . The intra-class correlation coefficient as a measure of the correlation within patients of the utility score was 0.386.
Table 1. Summary of the number of observations over time.
Following the matching of observations, 707 pairs of observations were included in the analysis. Of these, 455 were pre-progression, 64 were post-progression, and 188 observations had an unreported progression status. The patient demographics of this sample are described in . The mean EQ-5D-3L utility from these paired observations was, on the control arm, 0.80 at baseline, 0.81 pre-progression, and 0.72 post-progression, and, on the SIRT arm, 0.78 at baseline, 0.78 pre-progression, and 0.84 post-progression ().
Table 2. Patient demographics of the sample.
Table 3. Mean EQ-5D-3L utilities directly in the SIRFLOX trial.
The regression results for the linear mixed regression model are shown in . Four of the five function scores were positive and statistically significant (p < .01), with social functioning being the only exception. The global score was also positive and statistically significant (p < .05). As would be expected, the pain symptom score had a negative impact on EQ-5D-3L utility (p < .00001), as did financial problems (p < .01). The algorithm is a simple additive model. To get the utility value it can be applied to a data set by multiplying all the coefficients (reported in ) by the corresponding EORTC-QLQ-C30 scores and adding the sum of these to the constant.
Table 4. Regression results for mapping algorithms.
The results for the Tobit model were similar to those from the linear mixed regression model (); the global score and all function scores, except for social functioning, were positive and associated with improved quality-of-life (p < .01). Coefficients for pain (p < .00001), financial problems (p < .005), and appetite loss (p < .05) also reached statistical significance in this model.
Predictive performance
The MAE for the linear mixed regression model was 0.127, and the RMSE was 0.092. These values were lower than those for the Tobit model (MAE = 0.164, RMSE = 0.121), suggesting that the linear mixed regression model fits the data better. The adjusted R2 for the linear mixed regression model was 0.646, indicating that a relatively large proportion of the variation was explained by the model. The adjusted R2 for the Tobit regression was 0.506, showing the regression to be a relatively good predictor of EQ-5D-3L utility based on EORTC-QLQ-C30 score (but, again, worse than the linear mixed regression model). The residuals from the linear mixed regression model ranged from −0.6 to 0.4, with the majority at 0. This was much smaller than the Tobit model where residuals ranged from −2 to 6. Data were ordered by utility values, from highest to lowest, and divided into quartiles. shows the fit to the data for each quartile. The results show that both models slightly under-estimate utility in the less severe states and slightly over-estimate utility in the more severe states. This is to be expected considering the nature of the EQ-5D measure. The model shows a good fit to the middle 50% of the data. The fit was also tested for when the observed utility is equal to 1 and <0.5. Where observed EQ-5D utility values equal 1, both the linear mixed effects and the Tobit model under predicted utility (linear mixed effects: mean = 0.90, MAE = 0.10, RMSE = 0.12, adjusted R2 = .49; Tobit: mean = 0.91, MAE = 0.09, RMSE = 0.12, adjusted R2 = .49). The mean observed EQ-5D was 0.22 for the 56 observed utilities that were less than 0.5. Both the linear mixed effects and Tobit models over-predicted these more severe health states (linear mixed effects: mean = 0.55, MAE = 0.32, RMSE = 0.35, adjusted R2 = .48; Tobit: mean = 0.54, MAE = 0.32, RMSE = 0.35, adjusted R2 = .48).
Table 5. Goodness of fit statistics for quartiles and all data.
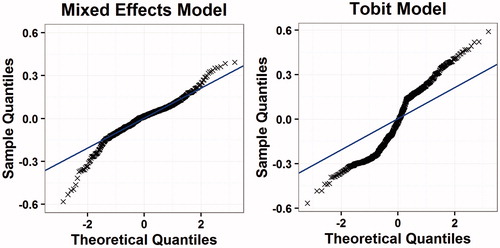
shows a comparison between the fitted EQ-5D-3L estimates and the observed data for both models. The solid line shows the line of perfect correlation. These plots show a relatively good fit to the data in the linear mixed regression model, although there may be a tendency to over-estimate utility in more severe states, with similar results seen in the Tobit model. The quantile-quantile plots () show relatively good fits over the whole spectrum of severity, but with some departures from the predicted fit at the upper and lower ends of the distribution. The solid line in the figure shows the line of perfect correlation. We selected the linear mixed regression model as the preferred model because it was a better fit to the data across all measures of goodness of fit.
Figure 1. Fitted vs actual EQ-5D-3L values.
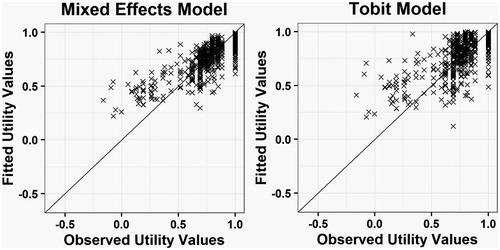
Figure 2. Quantile–quantile plots for mapping algorithms.
Comparison to other mapping studies and EORTC-8D
lists the relevant papers identified in Oxford databaseCitation4, and in the paper by Doble and LorgellyCitation5, and shows the results for the analyses that we conducted using the five published algorithms between the EORTC-QLQ-C30 and EQ-5D-3L, which were scored using the UK value set. Mapping analyses were not performed for all studies identified, only those using the UK tariff. The estimated mean utility for three of the five published mappings closely matched the observed EQ-5D-3L utility (mean utility within 10%)Citation3,Citation15,Citation16, while for two of the mappings the mean utility did not match wellCitation17,Citation18. Of those that did not fit well, the study by Crott and BriggsCitation17 (conducted in 448 patients) gave a predicted utility of 0.49 using the SIRFLOX data—dramatically lower than the observed 0.79 mean utility (a 38% under prediction). McKenzie and Van der PolCitation18 (conducted in 199 patients) also did not provide a good fit (0.70, a 14% under prediction).
Table 6. Studies identified and comparison of predicted utility from the mapping studies using UK tariff to the observed EQ-5D-3L values.
Of the algorithms that did match the data well (despite being from different disease areas), two under-estimatedCitation3,Citation16, and one over-estimatedCitation15 the EQ-5D-3L utility. The two that under-estimated EQ-5D-3L were used for patients with multiple myeloma. The study by Kontodimopoulos et al.Citation15 was used for patients with gastric cancer, a disease with symptoms similar to those seen in mCRC.
The utilities derived from the EORTC-8D are shown in and show a similar pattern to the EQ-5D-3L values from the SIRFLOX study for all arms (see ), although most values are ∼0.05 higher than the equivalent EQ-5D-3L utility value.
Table 7. Mean EORTC-8D values.
Discussion
The aim of this study was to map EORTC-QLQ-C30 values to EQ-5D-3L in patients with liver-only or liver-dominant mCRC, based on data collected in the SIRFLOX clinical trial. Both the mixed effects and Tobit models showed a good fit to the data. Owing to the nature of the Tobit model, where censoring limited the utility values to fall within the bound of the EQ5D-3L (−0.59 to 1.00), it would be expected that the Tobit model has the better fit to the data. The results showed that the Tobit model provides a reasonable fit to the data, as demonstrated by a low RMSE and MAE and a high adjusted R2. However, the linear mixed regression model performed better in all measures of goodness of fit, and thus it is our preferred model.
When comparing results obtained with the SIRFLOX data using algorithms from other mapping studies, three studies performed well and two provided poor estimates of observed utility. The reasons for these discrepancies are unclear, but they may be related to the disease areas used, the severity of patients varying between studies, or simply chance. The review paper by Doble and LorgellyCitation5 recommended the Longworth et al.Citation3 algorithm as providing a good fit to external data, and it also showed a good fit to our data (it predicted a utility of 0.75 compared to an observed utility of 0.79). The other algorithm recommended by Doble and LorgellyCitation5 (Versteegh et al.Citation6) was not included in our analysis as it was not based on the UK EQ-5D-3L tariff.
Although we only have data from a single stage of disease, we did find support for the three algorithms that fit our data. The mapping that provided the closest fit to the observed data (Kontodimopoulos et al.Citation15; 0.80 vs 0.79) was conducted in gastric cancer, which we would expect to have symptoms more similar to liver-only or liver-dominant mCRC than other conditions used in the mappings. It should be researched further whether this was by chance or due to a systemic relationship between the instruments based on disease area.
Our results are consistent with those that have been previously reported, where mapping from different mappings from EORTC-QLQ-C30 to EQ5D-3L can result in varied predicted utilitiesCitation22. Additionally, our studies further show that mapping EORTC-QLQ-C30 to EQ5D-3L tends to over-estimate EQ-5D-3L utility values in the more severe health statesCitation22. Further research is required into alternative regression methods, which more accurately predict EQ-5D-3L utility from EORTC-QLQ-C30, particularly towards the edges of the distribution.
The main limitation of the study was the lack of meaningful observations post-progression (67 paired observations). For this reason, we are unable to test whether the mapping holds at the next (or previous) stage of the disease. Although we would not expect the relationship between the instruments to change, due to the lack of protocol-driven visits at the same time points, we are not able to confirm this is the case. A second limitation is that the study was conducted using the EQ-5D-3L rather than the EQ5D-5L, which is now available and contains five levels per item rather than three. It is expected that this version is more sensitive to changes in quality-of-life, and may soon replace the three level version. A further limitation is that patients in the study were drawn from numerous countries and spoke multiple languages, and it is possible that this may have impacted on the results.
In conclusion, this study is the first of its kind in liver-only or liver-dominant mCRC and in mCRC as a condition. The mapping constructed shows a good fit to the data and provides practitioners with an additional mapping between EORTC-QLQ-C30 and EQ-5D-3L using a large dataset in a previously unstudied disease area. Further research into the link between EORTC-QLQ-C30 and EQ-5D-3L in different datasets is needed. This should include a range of cancers, both in type and severity, to further assess the predictive accuracy of mappings and whether a generic mapping function is likely to be valid, irrespective of the site of disease, or whether different mappings are needed for different cancers.
Transparency
Declaration of funding
This manuscript was funded by Sirtex Europe.
Declaration of financial/other relationships
ERM and AJH are employees of BresMed, which received funding from Sirtex (the manufacturers of SIR-Spheres microspheres) to conduct the study. GVH has received honoraria from Amgen, Boehringer Ingelheim, Lilly, Merck, Roche, Sanofi, and Sirtex for consultancy and participation in advisory boards and presentations. GVH’s institution has received study grants from Amgen, Boehringer Ingelheim, Lilly, Merck, Roche, Sanofi, and Sirtex, and GVH has also received travel funds from Sirtex. PG has received honoraria from Sirtex, Amgen, Roche, Bayer, and Merck for participation in advisory boards. PG’s institution has received research support from Roche, Amgen, and Pfizer. JME peer reviewers on this manuscript have no relevant financial or other relationships to disclose.
Acknowledgments
The authors of the study would like to thank Suki Shergill, who is employed by Sirtex, for her input to the design of the study and facilitation of access to data.
References
- National Institute of Clinical Excellence. Guide to the methods of technology appraisal; 2013. https://www.nice.org.uk/article/pmg9/chapter/foreword. Accessed January 2016
- Brazier J, Rowen D, Mavranezouli I, et al. Developing and testing methods for deriving preference-based measures of health from condition-specific measures (and other patient-based measures of outcome). Health Tech Assess 2012;16:1–114
- Longworth L, Yang Y, Young T, et al. Use of generic and condition-specific measures of health-related quality of life in NICE decision-making: a systematic review, statistical modelling and survey. Health Tech Assess 2014;18:1–224
- Dakin H. Review of studies mapping from quality of life or clinical measures to EQ5D: an online database. Health Qual Life Outcomes 2013;11:151
- Doble B, Lorgelly P. Mapping the EORTC QLQ-C30 onto the EQ-5D-3L: assessing the external validity of existing mapping algorithms. Qual Life Res 2015:891-911
- Versteegh MM, Leunis A, Luime JJ, et al. Mapping QLQ-C30, HAQ, and MSIS-29 on EQ-5D. Med Decision Making 2012;32:554–68
- Rowen D, Young T, Brazier J, et al. Comparison of generic, condition-specific, and mapped health state utility values for multiple myeloma cancer. Value Health 2012;15:1059–68
- EORTC at a Glance. (2015) The European Organisation for Research and Treatment of Cancer. Available from: http://www.eortc.org/. Accessed January 2016
- van Hazel GA, Heinemann V, Sharma NK, et al. SIRFLOX: Randomized phase III trial comparing first-line mFOLFOX6 (plus or minus bevacizumab) versus mFOLFOX6 (plus or minus bevacizumab) plus selective internal radiation therapy in patients with metastatic colorectal cancer. J Clin Oncol 2016;34:1723–31
- Petrou S, Rivero-Arias O, Dakin H, et al. Preferred reporting items for studies mapping onto preference-based outcome measures: the maps statement. Int J Technol Assess Health Care 2015;31:230–5
- Austin P, Escobar M, Kopec J. The use of the Tobit model for analyzing measures of health status. Qual Life Res 2000;9:901-10
- Brennan DS, Spencer AJ. Mapping oral health related quality of life to generic health state values. BMC Health Serv Res 2006;6:96
- Sullivan PW, Ghushchyan V. Mapping the EQ-5D index from the SF-12: US general population preferences in a nationally representative sample. Med Decision Making 2006;26:401–9
- Pickard AS, Neary MP, Cella D. Estimation of minimally important differences in EQ-5D utility and VAS scores in cancer. Health Qual Life Outcomes 2007;5:70
- Kontodimopoulos N, Aletras VH, Paliouras D, et al. Mapping the cancer-specific EORTC QLQ-C30 to the preference-based EQ-5D, SF-6D, and 15D instruments. Value Health 2009;12:1151–7
- Proskorovsky I, Lewis P, Williams CD, et al. Mapping EORTC-QLQ-C30 and QLQ-MY20 to EQ-5D in patients with multiple myeloma. Health Qual Life Outcomes 2014;12:35
- Crott R, Briggs A. Mapping the QLQ-C30 quality of life cancer questionnaire to EQ-5D patient preferences. Eur J Health Econ HEPAC 2010;11:427–34
- McKenzie L, van der Pol M. Mapping the EORTC QLQ C-30 onto the EQ-5D instrument: the potential to estimate QALYs without generic preference data. Value Health 2009;12:167–71
- Jang RW, Isogai PK, Mittman N, Bradbury PA, Shepherd FA, Feld R, Leighl NB. Derivation of Utility Values from European Organization for Research and Treatment of Cancer Quality of Life-Core 30 Questionnaire Values in Lung Cancer. J Thorac Oncol. 2010;5:1953-7
- Kim EJ, Ko SK, Kang HY. Mapping the cancer-specific EORTC QLQ-C30 and EORTC QLQ-BR23 to the generic EQ-5D in metastatic breast cancer patients. Quality of life research : an international journal of quality of life aspects of treatment, care and rehabilitation. 2012;21:1193-203
- Kim SH, Jo M, Kim H, Ahn J. Mapping EORTC QLQ-C30 onto EQ-5D for the assessment of cancer patients. Health and Quality of Life Outcomes. 2012;10
- Crott R. Mapping algorithms from QLQ-C30 to EQ-5D utilities: no firm ground to stand on yet. Expert Rev Pharmacoecon Outcomes Res 2014;14:569–76