
Abstract
Aims: To determine the cost-effectiveness of treatment sequences of biologic disease-modifying anti-rheumatic drugs or Janus kinase/STAT pathway inhibitors (collectively referred to as bDMARDs) vs conventional DMARDs (cDMARDs) from the US societal perspective for treatment of patients with moderately to severely active rheumatoid arthritis (RA) with inadequate responses to cDMARDs.
Materials and methods: An individual patient simulation model was developed that assesses the impact of treatments on disease based on clinical trial data and real-world evidence. Treatment strategies included sequences starting with etanercept, adalimumab, certolizumab, or abatacept. Each of these treatment strategies was compared with cDMARDs. Incremental cost, incremental quality-adjusted life-years (QALYs), and incremental cost-effectiveness ratios (ICERs) were calculated for each treatment sequence relative to cDMARDs. The cost-effectiveness of each strategy was determined using a US willingness-to-pay (WTP) threshold of $150,000/QALY.
Results: For the base-case scenario, bDMARD treatment sequences were associated with greater treatment benefit (i.e. more QALYs), lower lost productivity costs, and greater treatment-related costs than cDMARDs. The expected ICERs for bDMARD sequences ranged from ∼$126,000 to $140,000 per QALY gained, which is below the US-specific WTP. Alternative scenarios examining the effects of homogeneous patients, dose increases, increased costs of hospitalization for severely physically impaired patients, and a lower baseline Health Assessment Questionnaire (HAQ) Disability Index score resulted in similar ICERs.
Conclusions: bDMARD treatment sequences are cost-effective from a US societal perspective.
Introduction
Rheumatoid arthritis (RA), a common life-long autoimmune diseaseCitation1, negatively affects physical health and patient functioning by causing pain, swelling, stiffness, and progressive joint damage that leads to physical impairment and long-term disability if not properly controlledCitation2–4. This debilitating disease affects 0.6 to 1.0% of adults in the USCitation1,Citation5–7. RA is associated with a significant burden to society, with annual costs of $48 billion (2016 US dollarsCitation8), including direct healthcare costs and indirect costs in terms of productivity losses and intangible family and employer costsCitation9–17. Patients with RA leave the workforce at a rate of 44% within 13 years of disease onset, with many considered disabledCitation18.
The treatment and prognosis of moderately to severely active RA has been transformed by the advent of biologic disease-modifying anti-rheumatic drugs (bDMARDs), due to the reduction in the burden of quality-of-life impairments, disability, inability to work, and progression of joint damageCitation19–21. The current treatment paradigm for patients with RA begins with conventional DMARDs (cDMARDs) such as methotrexate (MTX). However, most patients do not achieve the treatment target of remission or low disease activity because of inadequate response or intolerance to treatmentCitation22. A recent claims analysis found that 50% of patients with RA initiating MTX discontinue within a year, illustrating the challenges of maintaining MTX therapyCitation23. Patients advance to bDMARDs and Janus kinase/signal transducers and activators of transcription (JAK/STAT) inhibitors (hereafter collectively referred to as bDMARDs) upon failure or intolerance of cDMARDs.
bDMARDs target multiple immunologic mechanisms to treat RA: tumor necrosis factor (TNF), interleukin-6, CD20, cytotoxic T-lymphocyte-associated protein-4, and JAK/STAT signaling pathwaysCitation24. Despite the fact that discontinuation rates up to 27% have been observed with bDMARDs at 1 yearCitation25, these agents are generally more effective at improving symptoms of RA and reducing progression of joint damage compared with cDMARDsCitation3,Citation25. Whereas economic models have demonstrated the benefit of bDMARDs in the US, such models are old, used differing methodologies, and represented only a few of the currently available biologicsCitation26–28. As there is increased scrutiny of the prices of these therapiesCitation29, there is growing interest in assessing the value of sequential treatment with bDMARDs in patients with RA.
Methods
Decision problem
The aim of this study was to estimate the cost-effectiveness of sequenced bDMARD therapy compared with cDMARD therapy for treatment of patients with moderately to severely active RA and inadequate response to cDMARDs who are naive to bDMARDs. (Please note that our objective was not to compare the cost-effectiveness of different bDMARDs.) This analysis was performed from the US societal perspective, using an individual patient simulation model over a lifetime.
Intervention strategies evaluated in this study are consistent with commonly used bDMARD sequences from clinical practice initiating with TNF inhibitors (TNFi; etanercept, adalimumab, certolizumab), a non-TNFi biologic (abatacept, tocilizumab, or rituximab) or a JAK/STAT inhibitor small molecule (tofacitinib) combined with MTX. At the end of each sequence, we followed Stevenson et al.Citation30, and assumed that patients moved to a non-biologic, which is a selection of therapies that do not reduce the rate of disease progression. Each of these treatment sequences (listed below) was compared with cDMARDs, followed by a non-biologic therapy.
etanercept + MTX → adalimumab + MTX → abatacept subcutaneous (SC) + MTX → tocilizumab + MTX → tofacitinib citrate + MTX → rituximab + MTX → non-biologic
adalimumab + MTX → etanercept + MTX → abatacept SC + MTX → tocilizumab + MTX → tofacitinib citrate + MTX → rituximab + MTX → non-biologic
abatacept SC + MTX → etanercept + MTX → adalimumab + MTX → tocilizumab + MTX → tofacitinib citrate + MTX → rituximab + MTX → non-biologic
abatacept SC + MTX → adalimumab + MTX → etanercept + MTX → tocilizumab + MTX → tofacitinib citrate + MTX → rituximab + MTX → non-biologic
etanercept + MTX → certolizumab pegol + MTX → abatacept SC + MTX → tocilizumab + MTX → tofacitinib citrate + MTX → rituximab + MTX → non-biologic
adalimumab + MTX → certolizumab pegol + MTX → abatacept SC + MTX → tocilizumab + MTX → tofacitinib citrate + MTX → rituximab + MTX → non-biologic
certolizumab pegol + MTX → etanercept + MTX → tocilizumab + MTX → abatacept SC + MTX → tofacitinib citrate + MTX → rituximab + MTX → non-biologic
certolizumab pegol + MTX → adalimumab + MTX → tocilizumab + MTX → abatacept SC + MTX → tofacitinib citrate + MTX → rituximab + MTX → non-biologic
certolizumab pegol + MTX → golimumab + MTX → tofacitinib citrate + MTX → tocilizumab + MTX → abatacept SC + MTX → rituximab + MTX → non-biologic
Total cost and quality-adjusted life-years (QALYs) were estimated for each treatment strategy. Cost-effectiveness was evaluated by calculating the net monetary benefit (NMB) and incremental cost-effectiveness ratio (ICER) for each treatment sequence compared with cDMARDs. NMB was defined as the QALYs gained multiplied by willingness to pay (WTP) minus incremental costs. We used a WTP of US $150,000, which is consistent with studies estimating the value of a life-year in the USCitation31–33. This threshold is also consistent with the suggestion from the World Health OrganizationCitation34 Macroeconomic Commission on Health of three times the per capita annual income.
Model structure
The model used in our analysis is available onlineCitation35. The model simulates individual patient outcomes based on a cycle length of 6 months, and was written in C++ and R, similar to the recent UK National Institute for Health and Care Excellence (NICE) assessmentCitation30,Citation36.
At the start of the model, each patient is assigned a baseline Health Assessment Questionnaire (HAQ) Disability Index score. Subsequently, the impact of the disease measured by the HAQ trajectory over time is modeled as a function of sequenced treatments (). In the absence of treatment, HAQ scores deteriorate over time at a certain rate, which varies by age.
Figure 1. Model structure showing development of HAQ scores with sequential biologic treatment. HAQ: Health Assessment Questionnaire. Adapted from Tosh et al.Citation66 and Wailoo et al.Citation62.
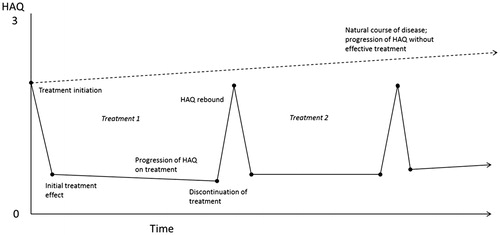
Treatment was characterized by an initial phase of up to 6 months, consistent with data reported from randomized controlled trials, and a maintenance phase thereafter until discontinuation. Patients with inadequate responses at the end of the initial 6-month period on a given treatment switched to the next treatment in the sequence, whereas those with adequate responses continued the same treatment as a maintenance regimen until response was lost or treatment was discontinued for other reasons. Initial response to treatment at 6 months was based on evidence from randomized controlled trials. Although American College of Rheumatology 20%, 50%, and 70% response criteria (ACR20/50/70) are most commonly used as outcomes in randomized controlled trials, decisions in routine clinical practice are typically based on the European League Against Rheumatism (EULAR) response criteria (which uses the Disease Activity Score including 28-joint count [DAS28]) or Simple or Clinical Disease Activity indices. In the model, ACR20/50/70 responses were transformed into EULAR responses based on the categories of “good response”, “moderate response”, and “no response”. Patients with good or moderate EULAR responses continued maintenance treatment, whereas those without any response switched to the next bDMARD. Duration of maintenance phase or time to discontinuation of maintenance treatment was determined according to parametric time-to-event distributions conditional upon EULAR response (technical details provided in the Online Supplement). Patients with good response at the end of the initial 6-month period on a given treatment were more likely to have a longer duration of response from the same maintenance treatment than those with moderate response.
Good or moderate EULAR response determined the improvement (i.e. reduction) in HAQ scores relative to that score 6 months earlier. Absence of a EULAR response did not result in any improvement in HAQ scores. Patients who continued maintenance therapy experienced a treatment-specific HAQ trajectory of improvement informed by long-term real-world evidence (described below). On discontinuation of treatment, HAQ scores deteriorated (i.e. increased) by the same amount as the improvement at the end of the initial 6-month period with that treatment, similar to the assumption made by Stevenson et al.Citation30. Note that, with a more favorable HAQ score progression rate with maintenance treatment than without, the absolute HAQ score after rebound was lower than if no treatment was received.
For each patient, the occurrence of a serious infection associated with a specific treatment was simulated assuming a constant event rate over time. If the sampled time to serious infection based on the exponential distribution was less than the sampled time of treatment discontinuation, the patient experienced an adverse event. If the sampled time of infection was greater than the time of treatment discontinuation, the patient did not experience an infection.
Individual HAQ scores at a particular time point in combination with age were used to estimate corresponding EQ-5D utility scores (0–1 range), which in turn were used to calculate cumulative QALYs over time. Utility was reduced for the month during which a serious infection was experienced.
Baseline and changes from baseline in HAQ scores over time also determined the increase in mortality every 6 months relative to age-/sex-specific mortality rates for the general US population (assumed to have an HAQ score of 0). As a result, treatment had an indirect effect on mortality via HAQ scores. Individual HAQ scores over time also determined annual hospitalization days and productivity losses.
Direct costs considered in the model were related to drug acquisition and administration, adverse events, general management of RA, and hospitalization. Indirect costs considered were limited to productivity losses. Future costs and outcomes were discounted at a rate of 3% per year.
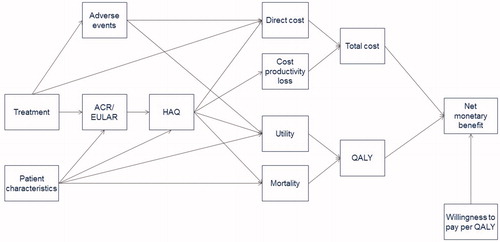
The influence diagram in summarizes the assumed structural relationships among the different parameters. Each arrow represents the direct effect of one parameter on another. The average outcomes over many simulated individuals provided estimates of expected outcomes of interest, given the set of model input parameters used. Additional technical details of the model are provided in the Online Supplement.
Figure 2. Influence diagram outlining structural relationships among different model parameters. ACR: American College of Rheumatology; EULAR: European League Against Rheumatism; HAQ: Health Assessment Questionnaire; QALY: quality-adjusted life-year.
Source data
HAQ progression in the absence of treatment with bDMARD
Wolfe and MichaudCitation37 studied changes in HAQ scores over time at 6-month intervals for up to 11 years among 3,829 RA patients who switched from cDMARD to bDMARD treatment in the National Data Bank for Rheumatic Diseases (NDB) longitudinal study of RA outcomes. The observed annual increase in HAQ score prior to biologic therapy was 0.031 (95% CI = 0.026–0.036), and was assumed to reflect the course of progression of HAQ scores in the absence of bDMARD treatment among patients with moderately-to-severely active RA and inadequate response to cDMARDs.
Michaud et al.Citation38 reported overall and age-specific HAQ progression rates among all RA patients participating in the NDB. We calculated the differences between the overall annual HAQ progression rates and age-specific rates (<40, 40–64, ≥65 years) and applied these to the aforementioned progression rate of 0.031 to obtain age-specific progression rates applicable to our target patient population of interest. Hence, the calculated HAQ progression rates were 0.011, 0.023, and 0.048 for patients <40, 40–64, and ≥65 years of age, respectively.
ACR and EULAR response and HAQ improvement at 6 months with bDMARD
American College of Rheumatology 20/50/70 response estimates at the end of the initial 6-month period on a given treatment among bDMARD-naive patients were obtained from a Bayesian network meta-analysis of published randomized controlled trial evidence; full methods can be found in the Online Supplement. Treatment effects in terms of ACR response for bDMARD-experienced patients were obtained by applying a percentage reduction to the mean of the reference treatment (cDMARDs) and the ACR20/50/70 cut-points from the network meta-analysis so that an ACR response of 60/40/20 would approximately be reduced to 50/30/10Citation39,Citation40 ().
Table 1. Model input parameters: treatment effects with bDMARDs in terms of ACR response, EULAR response, and HAQ at 6 months.
In the cost-effectiveness model, EULAR response categories were used to determine treatment continuation and duration. ACR responses based on the network meta-analysis were translated into probabilities of EULAR responses based on evidence of their relationship obtained from the US Veterans Affairs Rheumatoid Arthritis registry (Supplemental Table 5)Citation30. A moderate EULAR response was associated with a 0.317 (95% CI = 0.223–0.411) reduction, and a good EULAR response was associated with a 0.672 (95% CI = 0.452–0.892) reduction in HAQ scores. For non-responders, we assumed no change in HAQ score. The expected reduction in HAQ by treatment given their ACR and EULAR responses is provided in .
HAQ trajectory with bDMARD maintenance treatment
Based on the NDB, Wolfe and MichaudCitation37 estimated an overall annual HAQ score progression rate of –0.001 (95% CI = −0.004–0.002) among RA patients who switched to biologic therapies. This is a statistically significant improvement over an HAQ score progression rate of 0.031 prior to biologic use, as reported above. In a separate analysis, also based on NDB, Michaud et al.Citation38 reported an annual overall HAQ score progression rate of –0.001 after adjustment for baseline HAQ score, age, sex, education, smoking, body mass index, comorbidity, and year of RA onset. The consistency of these data instills confidence that HAQ progression rates for TNF inhibitors reported by Michaud et al.Citation38 () can be compared with the annual progression rate of 0.031 with cDMARD therapy reported by Wolfe and MichaudCitation37. An overall rate of progression of –0.001 was used for all bDMARD treatments evaluated in our model, including those not evaluated in Wolfe and MichaudCitation37.
Table 2. Model input parameters: development of HAQ per year beyond 6 months by treatment and age.
Duration of maintenance treatment
Stevenson et al.Citation30 reported a survival analysis of time to discontinuation of biologic treatment stratified by EULAR responses based on the British Society for Rheumatology Biologics Registers (BSRBR) database. Given concerns regarding the transferability of these findings to the US population, we used results from the Consortium of Rheumatology Researchers of North America (Corrona) databaseCitation41. However, no information stratified by EULAR response status was available. To obtain US-relevant estimates of time to treatment discontinuation based on EULAR response rates, we performed the following analyses. First, the reported BSRBR survival curves were transformed into hazard rate functions over time. Subsequently, an average was taken and weighted, based on the distribution of moderate and good responses to the treatments used in our model. Next, the reported Corrona survival curve was transformed into a hazard function. At each time point, the ratio of Corrona and BSRBR hazard ratios was calculated. For years beyond the maximum Corrona follow-up, we assumed a ratio equal to that of the last available time point in Corrona. Finally, these hazard ratios were applied to the EULAR-specific BSRBR hazard functions and subsequently transformed back into survival functions, from which individual time to treatment discontinuation times were sampled (Online Supplement).
Serious infections
In accordance with Stevenson et al.Citation30, we assumed a rate of 0.035 infections per person-year with no significant differences in rates among the different bDMARDs evaluated in the model. The rate of serious infections with cDMARDs was assumed to be 0.026Citation42.
Utility
To convert HAQ scores over time to utility estimates over time, we used the model by Hernández Alava et al.Citation43–45 (2012 − 2014), which was developed using a sample of more than 100,000 patients. This sophisticated non-linear mixture model relates EQ-5D utility scores to HAQ scores, pain, and age, and it significantly outperforms existing algorithms that relate utility to HAQ scores only. The advantage of the mixture model is that it properly accounts for the utility distribution, which is typically highly skewed and peaked at 1 (perfect health). We simulated this mixture model for every patient to estimate the distribution of health utilities over time. Because pain was not explicitly captured in our cost-effectiveness model, an individual’s pain score was first sampled based on that individual’s HAQ score and the stochastic relationship between pain and HAQ score (Online Supplement). Disutility due to serious infections was assumed to be 0.156 for the duration of the month of infectionCitation46.
Mortality
We modeled mortality as a function of age-/sex-specific mortality from US lifetablesCitation47 baseline HAQ, and changes in HAQ from baseline. Wolfe et al.Citation48 provided odds ratios of mortality by baseline HAQ score, which were applied to the absolute mortality rates of the general population (HAQ score of 0). This defined the baseline mortality of the RA patients. To capture the effect of treatment on mortality, we assumed that, for every 0.25-unit increase in HAQ score, subsequent 6-month mortality increased according to Michaud et al.Citation49 ().
Table 3. Model input parameters: mortality and resource use.
Costs
An overview of wholesale drug acquisition and associated administration costs (WAC) for treatments used in the model is presented in . WACs were discounted by 30% to account for discounts and rebatesCitation50. Other direct costs included physician visits, chest radiographs, tuberculosis test for some interventions, and inpatient hospital days (). The number of hospital days per year was dependent on HAQ scores according to Carlson et al.Citation51. The cost of any serious infection was assumed to be equal to the cost of pneumonia hospitalization, $5,873 based on Medicare reimbursementCitation52. Wolfe et al.Citation53 provided an estimate of annual income loss in relation to HAQ scores: $4,372 (95% CI = $2,078–$6,607; 2002 US dollars) change per unit HAQ change, which was inflated 34% to reflect 2016 costsCitation53.
Table 4. Model input parameters: total drug acquisition and administration cost.
Simulation-based estimation of model outcomes
Model outcomes of interest by intervention strategy included development of HAQ scores over time, QALYs, total drug acquisition and administration costs, adverse event costs, monitoring costs, hospitalization costs, total direct costs, costs due to lost productivity, total costs, and NMB. For a given set of model input parameter values, the expected values of these outcomes of interest were calculated by repeatedly simulating 5,000 individual patients and subsequently taking the average of the simulated results (first-order Monte Carlo simulation).
By means of 250 second-order Monte Carlo simulations, the uncertainty in model input parameters was propagated to quantify the uncertainty in the model outcomes. More specifically, for every input parameter, a value was sampled from a distribution representing the uncertainty in that parameter for which the expected model outcome was calculated (based on repeated simulation of the 5,000 individuals). As a result, a total of 250 × 5,000 simulation runs were performed. An overview of the model input distributions is provided in Supplemental Table 6.
Next, the incremental cost, incremental QALYs, and ICER (incremental costs/incremental QALYs) were calculated. The probability of cost-effectiveness was expressed with cost-effectiveness acceptability curves, calculated as the proportion of iterations for which the NMB was greater for a given intervention strategy than for the cDMARDs strategy.
Scenarios
Base-case scenario
In the base-case scenario, we simulated a heterogeneous patient cohort that was 79% female. Age was drawn from a truncated normal distribution, with a mean of 55, standard deviation of 13, a minimum age of 18, and a maximum age of 85. Likewise, the baseline HAQ score was drawn from a truncated normal distribution constrained to lie between 0–3 with a mean of 1.5 and a standard deviation of 0.7Citation54. Male weight was 89 kg, and female weight was 75 kgCitation55. The remaining parameter estimates were set as previously described. The posterior distributions of all parameters from the simulation are reported in Supplemental Table 6.
Alternative scenarios
We also considered four alternative scenarios to test the sensitivity of our results to certain modeling decisions. In our first scenario, we simulated a homogeneous cohort of patients. The proportion who were female and the gender-specific weight of each patient was the same as in the base-case scenario. However, there was no variation in patient age (55) or baseline HAQ score (1.5).
Our second scenario accounted for potential dose escalation. In particular, we allowed dosing after the initial 6-month treatment period to increase, as reported in Moots et al.Citation56. We calculated the expected dose increase by multiplying the probability of dose escalation by the mean dose increase among dose escalators. Dose increases among bDMARDs not examined by Moots et al. were assumed equal to those of the bDMARD, with the lowest reported dose increase.
In the third scenario, hospitalization costs were increased for severely physically impaired patients. In particular, yearly costs for patients with HAQ scores greater than 2.0 were assumed to equal the cost of a major surgery. We estimated the cost of a major surgery as $31,861 (standard error = $5,439), which is the weighted average cost of knee and hip replacement surgeries across geographic regions in the USCitation57. This scenario was based on evidence demonstrating a correlation between increased disease activity and the long-term risk of orthopedic surgeryCitation59.
In the fourth scenario, we assumed that patients were healthier at baseline, with a mean HAQ score of 1.0 instead of 1.5.
Results
Base-case scenario
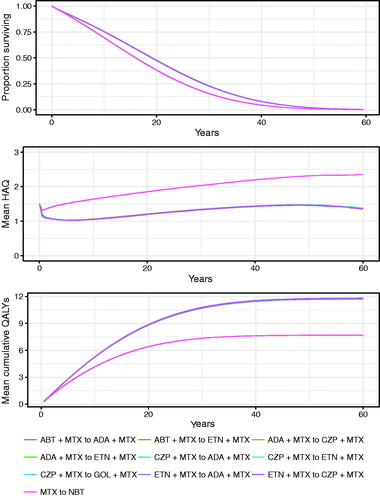
The modeled development of HAQ over time among living patients for the evaluated intervention strategies is presented in , along with the expected survival and cumulative QALYs over time. The different bDMARD sequences resulted in comparable HAQ trajectories that reflect a significantly lower deterioration in physical function over time than expected in the absence of bDMARD treatment. Given the increased mortality associated with increased HAQ scores, bDMARD treatment sequences resulted in greater survival and QALYs than treatment sequences that did not include bDMARDs.
Figure 3. Results of model analysis: expected survival, development of HAQ over time among living patients, and cumulative QALYs over time. HAQ: Health Assessment Questionnaire; QALY: quality-adjusted life-year.
The expected outcomes and costs are presented in . Compared with the cDMARD sequence, bDMARD treatment sequences were associated with greater treatment-related direct costs and lower lost productivity costs. The ICERs for the bDMARD sequences compared with cDMARDs ranged from ∼$126,000/QALY gain to $140,000/QALY gain, below the $150,000/QALY US threshold for cost-effectivenessCitation60 (, Supplemental Figures 3 and 4).
Table 5. Results of model analysis: expected outcomes and costs by bDMARD sequence over a lifetime horizon.
Table 6. Results of model analysis: cost-effectiveness results of different bDMARD sequences relative to conventional DMARD only under base-case scenario.
Alternative scenarios
Simulating a homogeneous patient population resulted in ICERs ranging from ∼$122,000/QALY gain to $135,000/QALY gain, which is similar to the results of the base-case analysis. Our dose escalation scenario also yielded ICERs very similar to the base-case ICERs. Increasing the hospitalization costs for severely physically impaired patients (HAQ ≥2.0) had a slightly larger effect as ICERs declined in all treatment sequences, ranging from a ∼$98,000/QALY gain to a $113,000/QALY gain. ICERs slightly increased in our fourth alternative scenario, modeling patients with a lower baseline HAQ score, ranging from ∼$140,000/QALY gain to $155,000/QALY gain. An overview of incremental costs, QALYs, and ICERs estimated for the alternative scenarios is presented in Supplemental Table 7.
Discussion
The introduction of bDMARDs has revolutionized RA treatment over the past 20 yearsCitation61. Using an individual patient simulation model, the current study aimed to assess the cost-effectiveness of routine clinical practice with bDMARDs in patients with moderately to severely active RA who were non-responsive or intolerant to cDMARD treatment. Taking into account the number of bDMARDs available and possible treatment sequences, we limited our analyses to bDMARD sequences commonly used in clinical practice. Sequenced bDMARD treatment was found to be cost-effective, with calculated ICERs being comparable among the different sequences and below the applied US$150,000/QALY WTP in the US setting. The results of the alternative scenarios were also consistent with the base-case analysis: the results were similar when simulating a homogeneous patient population, allowing for dose increases, increasing the costs of hospitalization for severely physically impaired patients, and lowering the baseline HAQ score.
Of note, we did not seek to determine which bDMARD treatment sequence is the most cost-effective. The reason to include several bDMARD sequences in the current analysis was to operationalize treatment practice in the era of bDMARDs. Infliximab was not considered part of evaluated treatment sequences because of the belief that it is no longer frequently used in RA. However, model input parameters for infliximab are provided in the Online Supplement to allow readers to evaluate infliximab-based treatment sequences.
A major strength of our model is that the patient-level simulation affords considerably more flexibility to capture the complexity of RA treatment response and disease progression than more commonly used models based on cohort simulation. A particular benefit of individual patient simulation models is the straightforward ability to model future outcomes conditional on past events. As a result, our model more accurately represents currently available clinical trial and real-world evidence for bDMARDs. First, we can model treatment duration with time-varying baseline hazards and as a function of treatment (EULAR) response at 6 months, consistent with observations of routine clinical practiceCitation30. Second, we can incorporate differences in HAQ progression rates over time among different DMARDs evaluated in sequential patterns. Third, and also consistent with real-world evidence, mortality depends on changes in HAQ over time in our modelCitation37,Citation38. Fourth, given the importance of the relationship between HAQ and utility, we used a recently published algorithm based on a mixture model that has better predictive accuracy than existing algorithms (e.g. Wailoo 2008) used in previous modelsCitation43–45,Citation62.
Our model is clinically realistic. For example, we used EULAR response rather than ACR response as our primary treatment effect measure for discontinuation. EULAR response is more reflective of criteria used in clinical practice to guide treatment decisionsCitation30. In addition, we assumed lower efficacy following bDMARD failure, which is consistent with clinical experience, and differs from other models that assume the same efficacy, regardless of prior treatment failureCitation30.
The flexibility of our modeling approach allows us to demonstrate the value of bDMARDs. Patients who experienced treatment failure with cDMARDs and have no access to bDMARDs are expected to experience increasing levels of disability exhibited by HAQ over timeCitation38. The benefits associated with sequential bDMARD therapy as captured in our model can be summarized as follows. Treatment with bDMARDs not only results in an improved HAQ score within 6 months of treatment, but is also associated with a lower HAQ deterioration rate over the long-term. Accordingly, patients treated with bDMARDs are less likely to experience progression of disease to HAQ levels associated with severely impaired physical function and structural joint damage requiring orthopedic surgery, as observed in the era prior to availability of bDMARDsCitation63–65. The reduced mortality associated with a reduced deterioration rate in HAQ scores results in greater life expectancy, underscoring the value of bDMARDs for RA patients.
The limitations of the current analysis are primarily a result of only having access to published summary data of the relevant evidence. This makes it challenging to statistically adjust the input parameter estimates for any difference between the population of that specific study and the target population of interest simulated in our model. For example, relative treatment effects with bDMARDs included in the model were based on a network meta-analysis of published trial data. Relevant estimates require that there are no differences in effect modifiers between the trial populations and the patients simulated in our model. For the initial treatment of patients with inadequate response to cDMARDs, this can be defended, but, for patients with inadequate response to bDMARDs, this becomes more challenging. The trials in patients with inadequate response to bDMARDs differ regarding the distribution of bDMARD treatment history, and the limited number of studies does not allow statistical adjustment of the reported estimates to match the patients simulated in our model, characterized by an increasingly complex history of bDMARDs received as the model progresses. As an alternative, we estimated the treatment effects among patients with inadequate response to cDMARDs based on the findings for such patients reduced by a factor as experienced in routine practice.
It is also important to note that the rate of infection, while low, was considered to be constant among all bDMARDs; as such, any difference in the rate of infection among the bDMARDs was not analyzed in this model. However, a potential impact on the findings is expected to be limited, given the low rate of infection.
Conclusion
Our individual patient simulation model allows us to capture the complex dynamics of treatment of patients with RA and progression based on available evidence. Sequential bDMARDs for treatment of patients with moderately to severely active RA and inadequate response to cDMARDs can be considered cost-effective from the US societal perspective.
Transparency
Declaration of funding
This study was funded by Amgen Inc.
Declaration of financial/other relationships
JPJ, DI, DP, and JPM are employees of Precision Health Economics, which was funded by Amgen Inc for this study. AM, BS, PK, and MG are employees of, and hold stock options in, Amgen Inc. VS has acted as a consultant/advisor for AbbVie, Amgen Inc, Bristol-Myers-Squibb, Boehringer Ingelheim, Celltrion, Corrona, Crescendo/Myriad Genetics, EMD Serono, Genentech/Roche, GSK, Janssen, Lilly, Merck, Novartis, Pfizer, Regeneron, Samsung, Sandoz, Sanofi, and UCB. Peer reviewers on this manuscript have received an honorarium from JME for their review work, but have no other relevant financial relationships to disclose.
Supplemental_Material.pdf
Download PDF (467.9 KB)Acknowledgments
The network meta-analysis was completed by Vanita Tongbram (Icon plc). Medical writing support was provided by Amy Foreman-Wykert, PhD, CMPP (Amgen Inc.) and Miranda Tradewell, PhD, and Rick Davis, MS (Complete Healthcare Communications, LLC, a CHC Group company).
References
- Helmick CG, Felson DT, Lawrence RC, et al. Estimates of the prevalence of arthritis and other rheumatic conditions in the United States. Part I. Arthritis Rheum 2008;58:15-25
- Pincus T, Callahan LF, Sale WG, et al. Severe functional declines, work disability, and increased mortality in seventy-five rheumatoid arthritis patients studied over nine years. Arthritis Rheum 1984;27:864-72
- Singh JA, Saag KG, Bridges SL Jr, et al. 2015 American College of Rheumatology guideline for the treatment of rheumatoid arthritis. Arthritis Rheum 2016;68:1-26
- Huizinga TW, Pincus T. In the clinic. Rheumatoid arthritis. Ann Intern Med 2010;153:ITC1-1-ITC1-15; quiz ITC1-16
- Gibofsky A. Overview of epidemiology, pathophysiology, and diagnosis of rheumatoid arthritis. Am J Manag Care 2012;18:S295-S302
- Lawrence RC, Felson DT, Helmick CG, et al. Estimates of the prevalence of arthritis and other rheumatic conditions in the United States: part II. Arthritis Rheum 2008;58:26-35
- Lawrence RC, Helmick CG, Arnett FC, et al. Estimates of the prevalence of arthritis and selected musculoskeletal disorders in the United States. Arthritis Rheum 1998;41:778-99
- US Department of Labor Bureau of Labor Statistics. Consumer Price Index-All Urban Consumers. Washington, DC: US Department of Labor Bureau of Labor Statistics 2016. http://data.bls.gov/cgi-bin/surveymost?cu. Accessed February 28, 2017
- Birnbaum H, Pike C, Kaufman R, et al. Societal cost of rheumatoid arthritis patients in the US. Curr Med Res Opin 2010;26:77-90
- Lundkvist J, Kastang F, Kobelt G. The burden of rheumatoid arthritis and access to treatment: health burden and costs. Eur J Health Econ 2008;8(suppl 2):S49-S60
- Yazdany J, Dudley RA, Chen R, et al. Coverage for high-cost specialty drugs for rheumatoid arthritis in Medicare Part D. Arthritis Rheum 2015;67:1474-80
- Gunnarsson C, Chen J, Rizzo JA, et al. The employee absenteeism costs of rheumatoid arthritis: evidence from US national survey data. J Occup Environ Med 2015;57:635-42
- Eriksson JK, Johansson K, Askling J, et al. Costs for hospital care, drugs and lost work days in incident and prevalent rheumatoid arthritis: how large, and how are they distributed? Ann Rheum Dis 2015;74:648-54
- Ohinmaa AE, Thanh NX, Barnabe C, et al. Canadian estimates of health care utilization costs for rheumatoid arthritis patients with and without therapy with biologic agents. Arthritis Care Res (Hoboken) 2014;66:1319-27
- Ma VY, Chan L, Carruthers KJ. Incidence, prevalence, costs, and impact on disability of common conditions requiring rehabilitation in the United States: stroke, spinal cord injury, traumatic brain injury, multiple sclerosis, osteoarthritis, rheumatoid arthritis, limb loss, and back pain. Arch Phys Med Rehabil 2014;95:986-95
- Curtis JR, Schabert VF, Harrison DJ, et al. Estimating effectiveness and cost of biologics for rheumatoid arthritis: application of a validated algorithm to commercial insurance claims. Clin Ther 2014;36:996-1004
- Chevreul K, Haour G, Lucier S, et al. Evolution of direct costs in the first years of rheumatoid arthritis: impact of early versus late biologic initiation–an economic analysis based on the ESPOIR cohort. PLoS One 2014;9:e97077
- Wolfe F, Allaire S, Michaud K. The prevalence and incidence of work disability in rheumatoid arthritis, and the effect of anti-tumor necrosis factor on work disability. J Rheumatol 2007;34:2211-7
- van Nies JA, de Jong Z, van der Helm-van Mil AH, et al. Improved treatment strategies reduce the increased mortality risk in early RA patients. Rheumatology (Oxford) 2010;49:2210-6
- Strand V, Greenberg JD, Griffith J, et al. Impact of treatment with biologic agents on the use of mechanical devices among rheumatoid arthritis patients in a large US patient registry. Arthritis Care Res (Hoboken) 2016;68:914-21
- Smolen JS, Han C, van der Heijde D, et al. Infliximab treatment maintains employability in patients with early rheumatoid arthritis. Arthritis Rheum 2006;54:716-22
- van Vollenhoven RF, Ernestam S, Geborek P, et al. Addition of infliximab compared with addition of sulfasalazine and hydroxychloroquine to methotrexate in patients with early rheumatoid arthritis (Swefot trial): 1-year results of a randomised trial. Lancet 2009;374:459-66
- Curtis JR, Zhang J, Xie F, et al. Use of oral and subcutaneous methotrexate in rheumatoid arthritis patients in the United States. Arthritis Care Res (Hoboken) 2014;66:1604-11
- Bays AM, Gardner G. Pharmacologic therapies for rheumatologic and autoimmune conditions. Med Clin North Am 2016;100:719-31
- Souto A, Maneiro JR, Gomez-Reino JJ. Rate of discontinuation and drug survival of biologic therapies in rheumatoid arthritis: a systematic review and meta-analysis of drug registries and health care databases. Rheumatology (Oxford) 2016;55:523-34
- Vera-Llonch M, Massarotti E, Wolfe F, et al. Cost-effectiveness of abatacept in patients with moderately to severely active rheumatoid arthritis and inadequate response to methotrexate. Rheumatology (Oxford) 2008;47:535-41
- Yuan Y, Trivedi D, Maclean R, et al. Indirect cost-effectiveness analyses of abatacept and rituximab in patients with moderate-to-severe rheumatoid arthritis in the United States. J Med Econ 2010;13:33-41
- Wong JB, Singh G, Kavanaugh A. Estimating the cost-effectiveness of 54 weeks of infliximab for rheumatoid arthritis. Am J Med 2002;113:400-8
- Rubenfire A. Rheumatoid arthritis drug prices on the rise; Chicago, IL: Modern Healthcare 2016. http://www.modernhealthcare.com/article/20160401/NEWS/160409993. Accessed January 13, 2017
- Stevenson M, Archer R, Tosh J, et al. Adalimumab, etanercept, infliximab, certolizumab pegol, golimumab, tocilizumab and abatacept for the treatment of rheumatoid arthritis not previously treated with disease-modifying antirheumatic drugs and after the failure of conventional disease-modifying antirheumatic drugs only: systematic review and economic evaluation. Health Technol Assess 2016;20:1-610
- Braithwaite RS, Meltzer DO, King JT, Jr., et al. What does the value of modern medicine say about the $50,000 per quality-adjusted life-year decision rule? Med Care 2008;46:349-56
- Weinstein MC. How much are Americans willing to pay for a quality-adjusted life year? Med Care 2008;46:343-5
- Neumann PJ, Cohen JT, Weinstein MC. Updating cost-effectiveness—the curious resilience of the $50,000-per-QALY threshold. N Engl J Med 2014;371:796-7
- World Health Organization. Report of the Commission on Macroeconomics and Health: Macroeconomics and Health: Investing in health for economic development. Geneva, Switzerland: WHO; 2001. http://apps.who.int/iris/bitstream/10665/42435/1/924154550X.pdf. Accessed February 10, 2017
- Amgen Inc., Precision Health Economics. RA Microsimulation: Cost-effectiveness of sequenced treatment of rheumatoid arthritis with targeted immune modulators. Thousand Oaks, CA: Amgen Inc. 2017. http://www.economicmodelforra.com. Accessed March 8, 2017
- R Core Team. R: A language and environment for statistical computing. Vienna, Austria: R Foundation for Statistical Computing, 2016. https://www.r-project.org/. Accessed January 13, 2017
- Wolfe F, Michaud K. The loss of health status in rheumatoid arthritis and the effect of biologic therapy: a longitudinal observational study. Arthritis Res Ther 2010;12:R35
- Michaud K, Wallenstein G, Wolfe F. Treatment and nontreatment predictors of health assessment questionnaire disability progression in rheumatoid arthritis: a longitudinal study of 18,485 patients. Arthritis Care Res (Hoboken) 2011;63:366-72
- West S. Rheumatology secrets, 3rd ed. Philadelphia, PA: Mosby, 2014
- Smolen JS, Aletaha D. Rheumatoid arthritis therapy reappraisal: strategies, opportunities and challenges. Nat Rev Rheumatol 2015;11:276-89
- Strand V, Williams S, Miller PSJ, et al. OP0064 discontinuation of biologic therapy in rheumatoid arthritis (RA): analysis from the Consortium of Rheumatology Researchers of North America (CORRONA) database. Ann Rheum Dis 2013;72:A71-A72
- Singh JA, Wells GA, Christensen R, et al. SAT0461 adverse effects of biologics: a network meta-analysis and cochrane overview. Ann Rheum Dis 2013;71:628
- Hernández Alava M, Wailoo AJ, Ara R. Tails from the peak district: adjusted limited dependent variable mixture models of EQ-5D questionnaire health state utility values. Value Health 2012;15:550-61
- Hernández Alava M, Wailoo A, Wolfe F, et al. The relationship between EQ-5D, HAQ and pain in patients with rheumatoid arthritis. Rheumatology (Oxford) 2013;52:944-50
- Hernández Alava M, Wailoo A, Wolfe F, et al. A comparison of direct and indirect methods for the estimation of health utilities from clinical outcomes. Med Decis Making 2014;34:919-30
- Oppong R, Kaambwa B, Nuttall J, et al. The impact of using different tariffs to value EQ-5D health state descriptions: an example from a study of acute cough/lower respiratory tract infections in seven countries. Eur J Health Econ 2013;14:197-209
- Arias E. United States life tables, 2011. National Vital Statistics Reports. Hyattsville, MD: National Center for Health Statistics; 2015
- Wolfe F, Michaud K, Gefeller O, et al. Predicting mortality in patients with rheumatoid arthritis. Arthritis Rheum 2003;48:1530-42
- Michaud K, Vera-Llonch M, Oster G. Mortality risk by functional status and health-related quality of life in patients with rheumatoid arthritis. J Rheumatol 2012;39:54-9
- SSRHealth. US Brand Rx Net Price. Access-restricted document, Stamford, CT: SSRHealth 2016
- Carlson JJ, Ogale S, Dejonckheere F, et al. Economic evaluation of tocilizumab monotherapy compared to adalimumab monotherapy in the treatment of severe active rheumatoid arthritis. Value Health 2015;18:173-9
- Centers for Medicare & Medicaid Services. FY 2016 Final Rule, Correction Notice and Consolidated Appropriations Act of 2016 Tables, Baltimore, MD: Centers for Medicare & Medicaid Services 2016. https://www.cms.gov/Medicare/Medicare-Fee-for-Service-Payment/AcuteInpatientPPS/FY2016-IPPS-Final-Rule-Home-Page-Items/FY2016-IPPS-Final-Rule-Tables.html?DLPage=1&DLEntries=10&DLSort=0&DLSortDir=ascending. Accessed February 15, 2017
- Wolfe F, Michaud K, Choi HK, et al. Household income and earnings losses among 6,396 persons with rheumatoid arthritis. J Rheumatol 2005;32:1875-83
- Curtis JR, Jain A, Askling J, et al. A comparison of patient characteristics and outcomes in selected European and US rheumatoid arthritis registries. Semin Arthritis Rheum 2010;40:2-14. e1
- National Center for Health Statistics, Centers for Disease Control and Prevention. Body Measurements, Atlanta, GA: Centers for Disease Control and Prevention 2016. https://www.cdc.gov/nchs/fastats/body-measurements.htm. Accessed February 2, 2017
- Moots R, Haraoui B, Matucci-Cerinic M, et al. Differences in biologic dose-escalation, non-biologic and steroid intensification among three anti-TNF agents: evidence from clinical practice. Clin Exp Rheumatol 2010;29:26-34
- BlueCross BlueShield. A study of cost variations for knee and hip replacement surgeries in the U.S., Chicago, IL and Washington, DC: BlueCross Blue Shield 2015. https://www.bcbs.com/about-us/capabilities-initiatives/health-america/health-of-america-report/study-cost-variations. Accessed February 7, 2017
- Claxton L, Jenks M, Taylor M, et al. An economic evaluation of tofacitinib treatment in rheumatoid arthritis: modeling of the cost of treatment strategies in the United States. J Manag Care Spec Pharm 2016;22:1088-102
- Nikiphorou E, Norton S, Young A, et al. Association between rheumatoid arthritis disease activity, progression of functional limitation and long-term risk of orthopaedic surgery: combined analysis of two prospective cohorts supports EULAR treat to target DAS thresholds. Ann Rheum Dis 2016;75:2080-6
- Dubois RW. Cost-effectiveness thresholds in the USA: are they coming? Are they already here? J Comp Eff Res 2016;5:9-11
- Kahlenberg JM, Fox DA. Advances in the medical treatment of rheumatoid arthritis. Hand Clin 2011;27:11-20
- Wailoo AJ, Bansback N, Brennan A, et al. Biologic drugs for rheumatoid arthritis in the Medicare program: a cost-effectiveness analysis. Arthritis Rheum 2008;58:939-46
- Carpenter L, Nikiphorou E, Sharpe R, et al. Have radiographic progression rates in early rheumatoid arthritis changed? A systematic review and meta-analysis of long-term cohorts. Rheumatology (Oxford) 2016; [Epub ahead of print]
- Shourt CA, Crowson CS, Gabriel SE, et al. Orthopedic surgery among patients with rheumatoid arthritis 1980–2007: a population-based study focused on surgery rates, sex, and mortality. J Rheumatol 2012;39:481-5
- Wolfe F, Zwillich SH. The long-term outcomes of rheumatoid arthritis: a 23-year prospective, longitudinal study of total joint replacement and its predictors in 1,600 patients with rheumatoid arthritis. Arthritis Rheum 1998;41:1072-82
- Tosh J, Brennan A, Wailoo A, et al. The Sheffield rheumatoid arthritis health economic model. Rheumatology (Oxford) 2011;50(Suppl 4):iv26-31