
Abstract
Aims: Patient no-show is a recurrent problem in medical centers and, in conjunction with cancellation of appointments, often results in loss of productivity and excessive patient time to appointment. The purpose of this study was to develop a dynamic procedure for scheduling patients within an outpatient clinic where patients are expected to have multiple appointments, such as physical therapy, occupational therapy, primary care, and dentistry.
Methods: This retrospective study involved the year 2014 de-identified patient records from an outpatient clinic affiliated with a large university hospital. A number of patient characteristics, appointment data, and historical attendance records were examined to determine whether they significantly impacted patients who missed scheduled appointments (no-shows). Patient attendance behaviors over multiple appointments were examined to determine whether their no-show and cancellation patterns differed from one appointment to the next. Decision tree analysis was applied to those predictors that significantly correlated with patient attendance behavior to assess the likelihood of a patient no-show. A sample dynamic appointment scheduling procedure that utilized different overbooking strategies for different appointment numbers was then developed. Computer simulation was used to assess the effectiveness of the dynamic procedure versus two other methods consisting of randomly assigned and uniformly assigned appointments.
Results: The dynamic scheduling procedure resulted in increased scheduling efficiency through overbooking but with less than 5% risk of appointment conflicts (i.e. two patients showing at the same time), equating to approximately 0.16 conflicts per clinician per day. It also increased clinic utilization by about 6.7%. It consistently outperformed the other two methods with respect to the percentage of appointment conflicts.
Limitations: The study is limited with respect to potential clinician cost increase resulting from possible appointment conflicts. A second limitation is that patients experiencing appointment conflicts might not wait for treatment, resulting in potential loss of revenue. A third limitation is that the model does not take into account patient satisfaction, nor the ethics of overbooking patients.
Conclusions: A dynamic appointment scheduling procedure was developed using actual patient characteristics. The procedure resulted in creation of more efficient appointment schedules thereby increasing the clinic utilization.
Introduction
Faced with an environment of increasing costs, limited capacity, and growing demand, many hospitals are emphasizing shorter lengths of stay and referral to specialty outpatient clinicsCitation1. In the context of decreasing reimbursement for healthcare services, effective management of a clinic’s productivity can make the difference between financial viability and clinic closure. Two important and related factors affecting clinics’ productivity are patients’ lower rates of failure to attend (no-show) and/or cancellation of scheduled appointments and scheduling efficiencyCitation2. Patients’ high rates of no-show and/or cancellation result in wasted timeslots and reduced revenues. Scheduling efficiency pertains to the ability of clinic staff to schedule every available timeslot when a clinic is open.
Patients’ no-show is a recurrent problem in medical centers and is quite disruptive to service deliveryCitation3–6. This problem, in conjunction with cancellation of scheduled appointments, often results in loss of productivity, loss of revenue, excessive patients’ time to appointment, and complexities in arriving at optimal staffing levels. Further, they undermine the clinician–patient relationshipCitation7. Maintaining the productivity of highly paid healthcare providers helps to offset their relatively high salary cost, and an effective scheduling process provides the best mechanism to accomplish the task. More efficient and consistent patient scheduling keeps providers from fluctuating between standing around with little or nothing to do and having multiple patients needing their services simultaneously. We examine factors relating to patients’ attendance and associated scheduling procedure within an outpatient clinic where patients are expected to have multiple appointments. Examples of such a clinic include physical therapy, chiropractic, occupational therapy, primary care, and dentistry.
Related literature
A number of extant studies have investigated factors that contribute to a patient’s no-show. Deyo and InuiCitation8, in a comprehensive survey of the literature, summarized factors that may affect no-shows including demographics, social and environmental influences, access considerations, provider facility, and therapist’s features as reasons to group patients into specific categories. They reported that forgetting, misunderstanding, or not realizing that they had an appointment were the most frequent qualitative reasons cited in the literature by patients as reasons for no-show appointments. Other reasons cited included a lack of money or transportation, or a sick relative at home. Emotional issues may also impact missed appointments, particularly in patients with behavioral problemsCitation9,Citation10. Lead time or days until appointment has been reported as a significant factor affecting no-show as wellCitation3,Citation11. Herrick et al.Citation12, in a study of 536 patients seeking care at a periodontal clinic, examined the qualitative factors that influence patients’ no-show behaviors. They found “forgetting” about the appointment was the most common reason voiced by patients who missed their scheduled time. They also found that other factors such as having a phone or owning a vehicle were significant in determining whether patients missed their appointment. Similarly, patients seeking care at an urban family practice setting cited perceived disrespect, their emotional state, and a lack of understanding of the system used to schedule them as primary reasons for missing an appointmentCitation9.
Statistical techniques have been used to study the quantitative factors that influence patient no-shows. Dove and SchneiderCitation13 used a decision tree model to study 756 West Haven VA Medical Center patients where the dependent variable was the patient’s last appointment record. The results showed that age, appointment interval, travel distance, and previous missed appointment record were significantly related to the likelihood of a patient no-showing. Lee et al.Citation14 completed a study with 22,864 patients receiving care at Tan Tock Seng Hospital in Singapore from 2000 to 2004. Their objective was to determine what factors would correlate with a patient’s likelihood to no-show for a scheduled appointment. Using multiple logistic regression analysis, they found that significant predictors of no-show included age, race, lead time, previous failed appointments, cell phone ownership, and distance from the hospital. Dreiher et al.Citation15 used a logistic regression model to study over 8800 obstetrics and gynecology patients and found that factors such as age, population sector, and waiting time for an appointment significantly impacted no-show rates. Norris et al.Citation7 used binary and multinomial logistic regression models to study the attendance records of 88,345 patients associated with the Indiana University Medical Group Primary Care clinics. They concluded that for their patient population the four most predictive factors impacting patients attendance consisted of lead time, a patient’s prior attendance history, patient’s age, and financial payer.
Qualitative and quantitative factors that contribute to patients’ excessive no-show rates can be used to develop methods that would reduce no-show and cancellation rates, thereby mitigating their negative impacts. Two primary approaches to reducing patients’ no-shows include reminder intervention and use of more advanced appointment scheduling techniques. The efficacy of reminder interventions has been studied extensively. In an excellent review of the literature, Stubbs et al.Citation6 examined 109 published articles between 1999 and 2009, focusing on various reminder strategies such as telephone calls, sending letters/postcards, text messaging, and open access scheduling. Forty-two of the articles were selected for further analysis according to a set of inclusion criteria such as presence of quantitative measures of efficacy and control groups. Their analysis revealed that all four reminder strategies resulted in lowered no-show rates. The weighted average no-show reduction ranged from about 16% for open access scheduling to about 7.6% for letters/postcards. The results of some of the reported improvements, however, were not statistically significant. Although usage of a reminder strategy might result in a reduction of no-show rates, it still does not address the challenge of significant cancelation rates. Gurol-Urganci et al.Citation16 reviewed extant studies involving possible effects of mobile phone messaging on attendance behavior. Eight randomized controlled trials involving 6615 patients were reviewed by two review authors independently. They found moderate quality evidence that mobile reminders improved the healthcare appointments show rate. They also concluded that the effects of text messaging were similar to those of telephone messaging with respect to show rate, but cost less.
McLean et al.Citation17 conducted a comprehensive review study, investigating the differential effects of reminder systems and possible improvements in attendance, cancellation, and rescheduling for different segment of the population. Their study involved three inter-related reviews of quantitative and qualitative evidence, including conceptual frameworks of reminder systems and adherence behaviors, reminder effectiveness literature, and realist principles to describe the contexts and mechanisms that inform reminder effectiveness. A total of 466 papers relating to 463 studies were identified for the latter two reviews. They found that reminder systems are consistently effective at reducing no-show appointments, regardless of health-care setting or patient subgroups. Their study also discovered strong evidence that the timing of reminders, between 1 and 7 days prior to the appointment, had no effect on attendance. Other findings included: a substantial numbers of patients do not receive their reminder; reminders promote cancellation of appointments; inadequate structural factors prevent patients from cancelling appointments; and few studies investigated factors that influence the effectiveness of reminder systems for population subgroups.
Research on appointment scheduling dates back to the 1950s with the work of BaileyCitation18, utilizing queuing models. More recent approaches include “open access” schedulingCitation19–24 where patients make their appointments on the day of, or just a few days before, the desired visit. This approach has proven most effective in reducing no-show rates in an environment of low patient load. Sequential schedulingCitation25 and its extensionCitation26 schedule patients sequentially according to their no-show probabilities. Overbooking approaches attempt to reduce the number of wasted time slots by scheduling two or more patients into the same slot. Sharp and HamiltonCitation27 recognized that ad hoc overbooking may increase waiting times for patients showing for their appointments. Some researchers have proposed focusing on patients who are prone to no-showCitation28; identifying patients at greatest risk of non-complianceCitation29; and placing habitual no-show offenders on probationary statusCitation30. Overlapping appointment schedulingCitation31 is a form of overbooking that schedules an appointment start time earlier than the previous appointment’s expected end time. When a patient arrives late or the healthcare provider completes the treatment of the previous patient early, the method reduces the provider’s idle time. This approach is most suitable for patient populations with very high no-show rates; and lengthy and highly variable treatment times.
Some of the more advanced overbooking methodsCitation24,Citation32,Citation33 generally select the patients to be overbooked according to their no-show probability, determined by using a statistical technique. Rohleder and KlassenCitation34 used a simulation study to investigate the effects of six different scheduling rules using overloading (i.e. double booking and using overtime) in general family practice clinics. Their work assumed variable service times and exponential call inter-arrival times. Lotfi and TorresCitation35 used classification and regression tree (CART) to develop a predictive model for scheduling patients in an urban outpatient clinic. Patients’ characteristics were used to determine whether they significantly impacted the patients’ no-shows. An interesting aspect of this study was a comparative analysis of four different CART models as well as Bayesian networks and neural networks modeling. However, their study was limited to the patients’ last appointments only. LaGanga and LawrenceCitation36 also conducted a simulation study of overbooking patients within a community mental health center. They developed a utility function that captured the tradeoffs between increased patients’ waiting time and providers’ overtime. This work was not based upon patients’ characteristics. As with sequential approaches, the above overbooking methods assume that the patients’ attendance behavior does not change over multiple appointments and use a static no-show probability.
Compared to prior research, a major contribution of our study is the examination of patients’ attendance behavior in an environment of multiple appointments and development of overbooking techniques while assessing the risk of appointment conflicts. We also examine several additional independent variables such as appointment month, appointment day of the month, appointment day, appointment time, and days until cancellation of the last appointment. We use actual patients’ characteristic and utilize a relatively large dataset, spanning entire year of patients’ appointments. We then demonstrate the effectiveness of our method by analyzing its impact on the clinic’s scheduling efficiency as well as clinicians’ productivity.
Methods
The dataset in our study was obtained from a clinic operated by a major university health system, in a city of approximately 120,000 people. The clinic offers a wide range of outpatient specialty care and medical services. The clinic’s hours are from 7:00 a.m. to 7:00 p.m. on Monday through Thursday, and 7:00 a.m. to 6:00 p.m. on Friday. There are no weekend hours offered at the clinic. The clinic primarily serves the residents in the county where it is located, and Medicare, Blue Cross/Blue Shields, and other third party plans are all represented in the payer mix of the patients seen at the clinic. Appointments are made by directly contacting the receptionist at the front office, and the clinic utilizes a commercial software package for all scheduling and data management needs.
The focus of this research was on the physical therapy services provided at the clinic. These services were delivered to patients with a multitude of different neuromuscular and musculoskeletal conditions; however, the clinic is specifically known as a center of excellence in the provision of back care. Manual therapy, exercise, and therapeutic modalities are all included in the plans of care for patients receiving treatment, and patient visits are scheduled every 45 minutes.
During the period of study, the clinic employed 22 fulltime equivalent (FTE) therapists with a range of various skills. Some therapists had specific board certifications in specialties such as orthopedics while others were considered generalists. On average, fulltime therapists were expected to spend one hour, out of an eight-hour shift, completing paperwork. The remaining seven hours of their time was intended to be spent in direct patient care activities, and the clinic operated according to a patient care model which emphasized direct one-on-one therapist-to-patient interaction. Physical therapy aides were utilized in non-patient care activities such as cleaning, restocking linens, and preparing treatment rooms.
The clinic has experienced significant numbers of cancellations and no-shows for some time, resulting in relatively long wait-lists for patients to secure their next appointment, and significant loss of revenue. The clinic operates on a fee for service basis and cannot bill the payer when a patient does not show for his/her appointment. There is no financial penalty assessed to a patient who misses his/her appointment. Patients with three consecutive no-shows are dropped from the practice; however, there is no penalty for cancelling appointments. Because the full time clinicians are salaried employees, patients’ cancellations and no-shows negatively affect productivity and profitability. In order to mitigate the effects of appointment cancellation, when a patient cancels his/her appointment, the receptionist calls patients on the wait-list to inquire whether they would be willing to take the cancelled timeslot. However, the clinic has no control over the timing of the cancellations and they might occur the night before the appointment or within a short time, rendering it difficult to fill. Also, in recent years, the clinic has adopted “phone call” reminders two nights before the appointment. While appointment reminders can improve the show rate, they have had no impact on the relatively large percentage of cancellations. Hence, a reliable procedure is needed to schedule patients more efficiently, including dynamically overbooking patients based on their appointment number and probability of show to minimize appointment conflicts. This will minimize the expected number of unused timeslots due to cancellation and no-shows, thereby increasing the overall utilization of the clinic.
The data set
The dataset consisted of 30,670 appointment records, pertaining to 4240 individual patients covering the period 2 January 2014 to 31 December 2014. Each record consisted of observations on 18 variables (). The variables expanded upon those included in some of the prior quantitative studies by including appointment date, appointment time, and days until cancelation. Six of the variables (age, gender, race, ethnicity, marital status, and employment status) reflected data which is routinely collected for each new physical therapy patient. Values for the remaining variables were determined from the patient’s attendance history. Appointment date was used to determine appointment month, appointment day of the month, and appointment day of week. Distance to clinic was calculated by using the patient’s home address. The “appointment status” (AppStat) is the dependent variable with values: show, no-show and cancel.
Table 1. List of variables.
Results
Patients’ attendance over time
Our dataset had 633 patients with exactly one scheduled appointment and 3607 patients with two or more appointments, with an average of 7.2 appointments per patient. Of the 3607 patients with two or more appointments, 1210 patients had one or more appointments during the prior year(s) and 2397 patients had their first appointments in 2014. Because the focus of this research was to investigate the attendance behavior of the patients with multiple appointments, the 633 patients with exactly one appointment were excluded from the analysis. Further, for this phase of the analysis we excluded patients who had their first appointment prior to 2014.
We examined the attendance behavior of patients with two or more appointments (those with multiple appointments) and their first appointments in 2014 to determine whether their show rates would change significantly over time. presents the show, no-show and cancel rates of the first through seventh appointments. We focused on the first seven appointments because analyzing these appointments provided sufficient evidence of the change in the patients’ show rates over time. Further, the number of patients with eight or more appointments dropped off significantly after the seventh appointment.
Figure 1. Patients’ attendance over time.
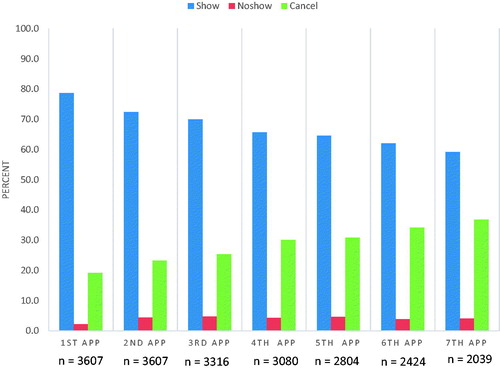
The 1ST APP data points reflect the percentages of first appointments show, no-show and cancel rates for patients with two or more appointments. Similarly, the 2ND APP data points reflect the percentages of second appointments show, no-show and cancel for those with three or more appointments, and so on. clearly reveals a precipitous drop in the show rate between first appointments and second appointments (82% versus 75%), between second appointments and third appointments (75% versus 71%) and so on. The show rate for the seventh appointments for those with two or more appointments was about 59%. The differences in the seven show rates were all statistically significant. Similarly, there were steady increases in the cancel rates from the first appointments (16%) to the seventh appointments (37%). The no-show rates increased from 2% for the first appointments to 5% for the third through fifth appointments. It was approximately 4% for the sixth and seventh appointments. We also examined no-show rate for the last appointments (not shown in the graph) which was about 6.0%.
The above results delineate that patients’ attendance behavior changes over time and a scheduling policy that assumes a constant attendance rate may not produce optimum results. For our patient population, the show rate for the seventh appointments was approximately 23 percentage points lower than the show rate for the first appointments. There is a need for developing a scheduling procedure that changes its overbooking policy when scheduling a patient’s next appointment. That is, the scheduling procedure should incorporate the patient’s attendance record in a dynamic fashion and use overbooking only when there is evidence of low probability of show for the next appointment.
Chi-square test
We first conducted chi-squared tests to determine possible relationships between the independent variables (predictors) and the dependent variables. The appointment dataset containing the patients with their first visits in 2014 was divided into seven separate subsets, containing records associated with each of the first through seventh appointments. The dependent variable was the appointment status and the independent variables were the same as the original dataset.
and present the results of the chi-squared tests. We excluded the appointment cancellation date from the analysis because this predictor had many missing values. Five variables, day of the month (DOM), appointment month (MONTH), appointment time (TIME), day of the week (DOW), and distance to clinic (DIST) were not significantly related to appointment status for any of the seven appointments. Employment status (ES) and patients’ age (AGE) were only significant for the first and third appointments, respectively but not significant for the remaining six appointments. Marital status (MS) was significant for all but the seventh appointments. Patients’ gender (GEN) was significant for the second, third, and seventh appointments. Patients’ race (RACE) was significant for the first, second, fourth, and seventh appointments. Patients’ ethnicity (ETH) was significant for the sixth and seventh appointments. Days to appointment (DTA) was significant for the first six appointments at the 0.05 level, and for the seventh appointments at the 0.1 level.
Table 2. Results of chi-squared tests.
Table 3. Chi-squared tests – likelihood ratios.
Interestingly, number of prior appointments – show (NPS), number of prior appointments – no-show (NPNS), and number of prior appointments – cancel (NPC) were highly significant (at the 0.0001 level) starting with third appointments and remained significant for the rest of the appointments.
Decision tree analysis
We used classification and regression tree (C&RT), also referred to as “decision trees” to develop predictive models for each of the seven appointments separately. The decision trees established whether the predictors for one appointment would differ significantly from those for another appointment. They will also enable us to build a dynamic scheduling procedure as future appointments are being made for a given patient.
As shown in , the no-show rates are significantly smaller than those of the cancel rates for all appointments. Our ultimate goal was to develop a scheduling procedure that incorporated overbooking when appropriate to increase scheduling and clinic efficiencies. In this context, the practical consequences of a cancelled appointment and a no-show appointment were the same. Hence, we recoded the appointment status by combining the cancel and no-show values into the same value, resulting in a binary dependent variable with values Show and NS-Can for all seven appointments.
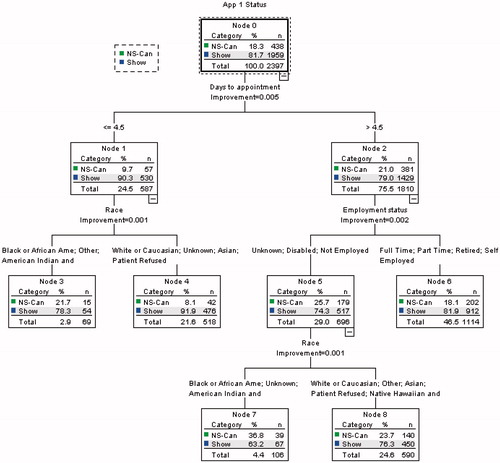
We used the classification and regression tree (CRT) option of decision tree procedures within SPSS 22. Based upon the results of the chi-squared tests, we excluded five predictors (day of the month [DOM], appointment month [MONTH], appointment time [TIME], day of the week [DOW], and distance to clinic [DIST]) from the analysis. The following parameters were utilized in creating the decision trees: maximum tree level was set at 5; minimum number of cases per parent node set at 100; and minimum number of cases per child node set at 50. presents the decision tree for the first appointments dataset. The tree represents 2397 appointments with 81.7% shows and 18.3% no-shows/cancels. It contains three levels with nine nodes including five terminal nodes. Days to appointment (DTA) is the first predictor that is split with values of 4.5 days or less and greater than 4.5. It should be noted that the CRT procedure might optimally split a predictor at a non-integer level even though that predictor only takes on integer values. The tree’s second level predictors are race (RACE) and employment status (ES.) The first level of the decision tree reveals that for appointments with days to appointment (DTA) of four days or less, the probability of show is 90.3%, whereas for patients with five or greater days to their appointments, the show rate drops to about 79%. This simple finding can be used to improve the show rate by up to 10% if we could schedule the first appointments within four days. It should be noted that a clinic’s capacity may not allow for this stipulation in every case.
Figure 2. Decision tree for first appointments.
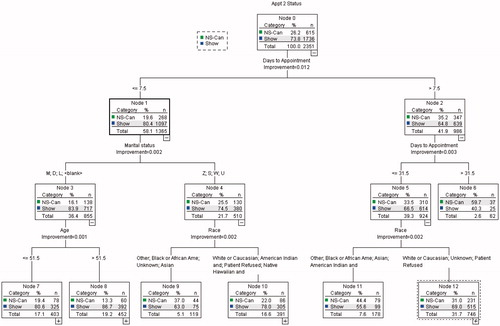
shows the first three levels of the decision tree for second appointments. This tree represents 2351 appointments with 73.8% shows and 26.2% no-show/cancels. It has five levels with 23 nodes including 12 terminal nodes. Similar to the tree for first appointments, the first significant predictor is days to appointment (DTA) with split at 7.5 days or less with 80.5% show and greater than 7.5 days with 64.8% show. One might use the information from this tree to improve the show rate by scheduling the second appointments within seven days of the date that the appointment is being made.
Figure 3. Decision tree for the second appointments, top three levels.
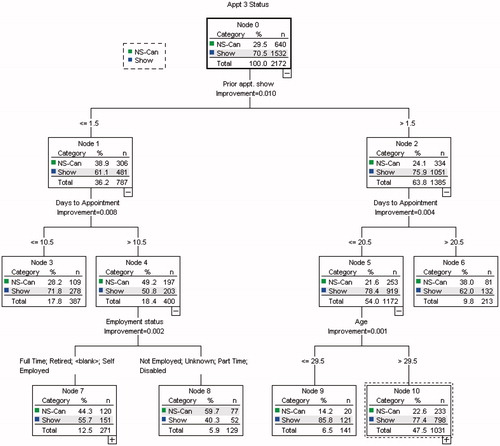
The decision tree associated with the third appointments () represents 2172 records with 70.5% show and 29.5% no-show and cancel rates. Unlike the first two decision trees, the first splitting predictor for this tree is the number of prior appointments – show (NPS) with a split at 1.5 or fewer shows and greater than 1.5. Those with one or fewer prior shows have 61.1% show rate and those with two shows have a 75.9% show rate. Closer examination of the tree reveals that the node (subset of the population) with the lowest show rate at 40.3% corresponds to patients with NPS equal to one or fewer, days to appointment (DTA) greater than or equal to 11, and employment status (ES) not employed, disabled, part-time employed or unknown. Developing an effective scheduling procedure with overbooking for the third appointments will require using multiple rules, based upon information derived from several terminal nodes at lower levels of the tree.
Figure 4. Decision tree for the third appointments, top three levels.
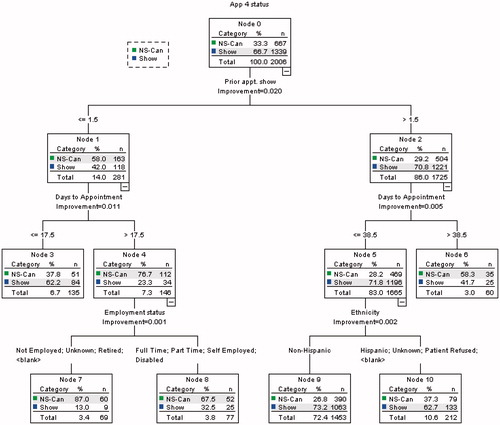
The fourth appointments decision tree () consisted of 2006 appointments, with 66.7% show and 33.3% no-show/cancel rates. Similar to the third appointments tree, the first splitting predictor was the number of prior visits – show (NPS) with a split at 1.5 or fewer shows having 42% show rates and those with greater than 1.5 shows having 71% show rates. The tree had five levels with 17 nodes including nine terminal nodes. The second level splits were associated with days to appointment (DTA). The node with the lowest percentage show at 23% corresponded to patients with one or zero number of prior visits – show value and days to appointment greater than 17 days.
Figure 5. Decision tree for the fourth appointments, top three levels.
presents a summary of the decision tree results for the first seven appointments. As the appointment number increases, and patients have greater prior attendance history, the decision trees contain sub-populations with more distinctive probabilities of show and no-show/cancel. Consider for instance the decision tree associated with the sixth appointments (). This tree has five levels consisting of 19 nodes including 10 terminal nodes. It represents 1547 appointments with 63% show and 37% no-show/cancel rates. Node 7, which corresponds to patients with number of prior visits – show (NPS) value of three or more and days to appointment (DTA) of three days or less, had a show rate 92.3%, the highest of all nodes (patients’ sub-populations). Similarly, node 4 corresponds to patients with number of prior shows value of two or fewer and days to appointment of 17 days or longer, and had a show rate 16.9%, the lowest of all nodes. These characteristics allow us to design scheduling schemes that incorporate overbooking while controlling the risk of appointment conflicts, having two overbooked patients showing at the same time.
Figure 6. Decision tree for the sixth appointments, top three levels.
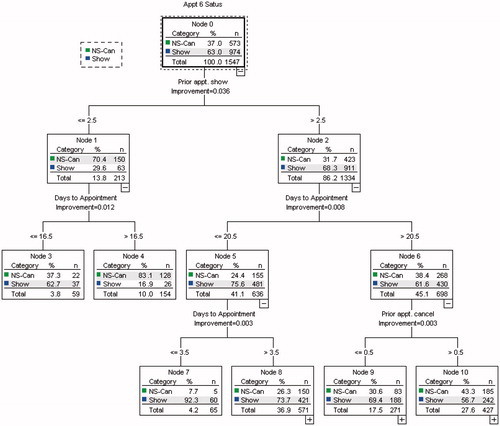
Table 4. Summary of decision tree analysis.
Scheduling procedure
The above decision tree analysis clearly establishes the varying attendance behavior over time of patients with multiple appointments. Consequently, a scheduling procedure that relies on patients’ characteristics and attendance records to overbook patients must take into account this phenomenon. We propose a dynamic approach to developing scheduling procedures using overbooking for patients’ with multiple appointments. The method facilitates utilization of information associated with different predictors and/or predictor values for different appointments. We now provide an example of such an approach based upon the results of .
For simplicity of demonstration we will only use the first level predictors in creating overbooking rules. This approach is also quite useful if the scheduling is done manually by a staff operator rather than a computer program. reveals that the first two appointments have relatively high percentages of show, hence they are not conducive to overbooking. We can use the number of prior visits – show (NPS) split for the third appointments to overbook those with a NPS value of less than or equal to 1. However, the percentage of show for this sub-population of patients remains at over 61% and is still relatively high. The following is a sample scheduling procedure with overbooking applied to appointments four and later. We call this scheduling scheme the CL method.
Assign appointments 1, 2 and 3 to new timeslots,
Overbook appointments 4 and 5 if NPS ≤1, otherwise assign to new timeslots,
Overbook appointment 6 if NPS ≤2, otherwise assign to a new timeslot,
Overbook appointment 7 if NPS ≤4, otherwise assign to a new timeslot.
To illustrate the practical use of our method and its potentials for improving a clinic’s scheduling efficiency, we conducted a computer simulation, testing three variations of the CL method as follows:
CL-1: use the CL method but do not overbook appointments 8 and subsequent appointments
CL-2: use the CL method and continue to overbook appointment 8 and subsequent appointments using the criterion NPS ≤4
CL-3: overbook second appointments and higher ones if the number of shows until the current appointment is less than 50% of scheduled appointments (does not overbook the first appointments)
The minimum of 50% threshold for show rate to avoid overbooking an appointment in CL-3 was based upon the results of the decision tree analyses for appointments three through seven. In each case, NPS was the most discriminating predictor with split levels of approximately 50%. Compared to CL-2, CL-3 has the potential to overbook more appointments.
As with Huang and HanauerCitation33 we compared the results of our methods with those of two other overbooking approaches, randomly distributed (RND) and uniformly (UNF) distributed. The RND procedures were fine-tuned to overbook approximately as many appointments as necessary to have the same number as those of each of the three CL procedures. For the RND procedures we used five replications. The RND procedures were as follows:
RND-1: same as CL-1 but overbook appointments 4 through 7 at random
RND-2: same as CL-2 but overbook all other appointments at random
RND-3: do not overbook first appointments; overbook subsequent appointments at random
The UNF procedures were similar to the RND procedures except that the overbooked appointments were distributed uniformly throughout the planning period as follows:
UNF-1: same as Cl-1 but overbook appointments 4 through 7 uniformly
UNF-2: same as CL-2 but overbook all other appointments uniformly
UNF-3: do not overbook first appointments; overbook subsequent appointments uniformly
The above scheduling procedures were programmed in Visual Basic within the Excel environment. The performance measures were the number of overbooked appointments and the number of overbooked appointments with conflicts (i.e. two or more overbooked patients showing at the same time). The number of overbooked appointments is a proxy measure for the number of timeslots that can be saved thereby increasing scheduling efficiency and clinic utilization. In consultations with the clinic’s management, it was decided that overbooking a timeslot with more than two appointments was not desirable. Therefore, we limited the simulation study to just double booking a timeslot eligible for overbooking. If we were to overbook a timeslot with more than two appointments, we would gain even greater scheduling efficiencies.
The simulation study involved two datasets: Population I – using the dataset containing the patients having their first appointments in 2014 (19,476 appointments); and Population II – using the original dataset of patients including those with their first appointments before 1 January 2014 but excluding those with just one appointment (30,037 appointments). The second dataset was included in the simulation study because it contained the patients’ number of prior appointments (show, no-show and cancel) which were used in the scheduling procedures. This larger population allows us to verify the consistency of our scheduling rules as we compare them to RND and UNF procedures.
presents the results of the computer simulations. The CL-1 method overbooked 1306 eligible appointments of Population I (P-I), about 6.7% of the total appointments and 1638 of Population II (P-II) appointments, about 5.5% of total appointments. The method resulted in 246 appointment conflicts (both patients showing for their appointments at the same date/time) for P-I and 314 conflicts for Pop-II, or about 1.3% and 1.0% of the total appointments, respectively. The CL-1 method only overbooked appointments four through seven for patients that satisfied the overbooking criteria, hence the relatively smaller number of overbooked appointments. It is also important to note that the total number of appointments four through seven was 6661.
Table 5. Results of simulation runs.
CL-2 overbooked fourth appointments and higher that satisfied the overbooking criteria. The method overbooked 2060 of eligible P-I appointments and 2912 of P-II appointments, 10.6% and 9.7% of the total appointments, respectively. The method resulted in 374 appointment conflicts for P-I and 554 conflicts for Pop-II, approximately 1.9% and 1.8% of the total appointments, respectively. CL-3 overbooked second appointments and higher ones with a history of less than 50% show. The method overbooked 3584 of eligible P-I appointments and 5752 P-II appointments, approximately 18.4% and 19.1%, of the total appointments, respectively. The method resulted in 866 appointment conflicts for P-I and 1382 conflicts for Pop-II, approximately 4.4% and 4.6% of the total appointments, respectively.
Comparison with RND and UNF methods
The RND and UNF methods consistently underperformed the CL methods on both datasets. For instance, when compared with CL-1, RND-1 had more than twice the percentage of appointment conflicts for the same percentage of overbooked appointments for both P-I and P-II. UNF-1 was also outperformed by CL-1 and performed slightly worse than the RND-1 method on both datasets. RND-2 and UNF-2 underperformed CL-2 on P-I and P-II as well. The percentages of appointment conflicts for RND-2 and UNF-2 were twice that of CL-2 for about the same percentage of overbooked appointments. Performances of RND-3 and UNF-3 followed the same pattern.
Impact on clinic’s productivity
The CL scheduling methods can be used to increase the clinic’s scheduling efficiency and clinicians’ productivity. Overbooking appointments naturally requires relatively fewer days to schedule the same number of appointments. Recall that the total number of scheduled appointments during 2014 was 30,670, averaging about 30,670/254 = 120.7 or approximately 121 appointments per day. Using the CL-3 method we can double book 5752 appointments, requiring 5752/2 = 2876 fewer timeslots, or 2876/121 = 23.8 fewer days thereby increasing the clinic’s scheduling efficiency. Using fewer appointment days will result in relatively lower waiting time for a patient’s next appointment. The method also results in increasing the clinicians’ productivity. The number of shows during 2014 was 19,961, resulting in clinician’s utilization of 100 × 19,961/30,670 = 65.1%. Using the CL-3 method the number of scheduled timeslots reduces to 30,670 - 2876 = 27,794. The clinician’s utilization will be 100 × 19,961/27,794 = 71.8%, or an increase of about 6.7%. It should be noted that in practice there are mitigating circumstances that prevent a clinic from operating at 100% efficiency or even getting close to it. For instance, patients generally prefer certain days of the week and certain hours of the day, preventing the clinic from scheduling them uniformly across all operating hours unless the patients’ satisfaction is to be completely ignored. This in turn results in the clinicians’ productivity being constrained.
The risk associated with double booking and increased clinician productivity is potential for patients’ appointment conflicts. The clinic under study was open 254 days during in 2014 and employed 22 fulltime equivalent (FTE) clinicians. Each clinician was allowed to spend one hour per day completing paperwork. Hence, the total number of clinician-hours per day was 7 × 22 = 154 hours. Each therapy session was assumed to be 45 minutes, resulting in 1/0.75 = 1.33 therapy sessions per hour or 1.33 × 154 = 205 possible sessions per day. The actual number of completed treatments (shows) per day was 19,961/254 = 78.6 patients per day. The CL-3 method’s percentage of double booked appointment is 4.6 (), resulting in 78.6 × 0.046 = 3.6 conflicts per day or 0.16 conflict per clinician per day. This level of risk is quite manageable particularly since the actual number of conflicted patients that have to wait is one-half of the above amount or 0.08 patient per clinician per day because we overbook two patients in one timeslot.
Discussion
This study involved extensive analyses of actual data pertaining to patients’ attendance at an outpatient university affiliated clinic. Patients’ characteristics and historical attendance records were examined to determine their potential impact on their no-show and cancellation rates. The patients’ dataset was disaggregated to examine the patients’ attendance rates across multiple appointments. Statistical analyses were then used to determine the patients’ characteristics that significantly correlated with each of the patients’ first seven appointment statuses. As anticipated, some predictors correlated with early appointments but lost their significance in subsequent appointments. Some predictors did not correlate with any of the seven appointments and some gained significance during the later appointments. Predictors that did not correlate with any of the seven appointment statuses were removed from further analysis. Decision tree analysis was then used to establish which of the remaining predictors had the most significant relationship with each of the seven appointment status. The trees were used to build a sample dynamic scheduling procedure which included overbooking, incorporating different criteria for different appointment numbers when scheduling multiple appointments. A simulation study was conducted that clearly delineated the superior performance of the dynamic procedure when compared with two other overbooking approaches.
A major contribution of this study to the patient attendance literature pertains to the discovery that the patients with multiple appointments have no-show and cancel rates that vary significantly from one appointment to the next. Hence, scheduling schemes that assume a constant show rate may not produce optimum results. Further, our proposed dynamic scheduling procedure resulted in improving the clinic’s scheduling efficiency and clinicians’ productivity while controlling the risk of overbooked patients’ with appointment conflicts.
The study is limited with respect to potential clinicians’ cost increase, resulting from possible appointment conflicts and the need to incur clinicians’ overtime pay. A second limitation is that patients experiencing appointment conflicts might not wait for treatment, resulting in potential loss of revenue. This limitation can be partly addressed by having other clinicians not treating patients be asked to treat an overbooked patient with a conflict. A third limitation is that the model does not take into account patients’ satisfaction, nor the ethics of overbooking patients. This limitation might be overcome by posting signs within the clinic, alerting patients to a possible delay in treatment.
Transparency
Declaration of funding
This research did not receive any specific grants from funding agencies in the public, commercial, or not-for-profit sectors.
Declaration of financial/other relationships
J.C. and V.L. have disclosed that they have no significant relationships with or financial interests in any commercial companies related to this study or article.
JME peer reviewers on this manuscript have no relevant financial or other relationships to disclose.
Acknowledgements
The authors wish to thank the associate editor and the two anonymous reviewers for their valuable comments and suggestions during the review process.
References
- Laik N, Khataniar S, Wu D, Ng SSY. Predictive analytics for outpatient appointments, International Conference on Information Science & Applications (ICISA). IEEE 2014;1-4
- Weinger K, McMurrich SJ, Yi JP, et al. Psychological characteristics of frequent short-notice cancellers of diabetes medical and education appointments. Diabetes Care 2005;28:1791-3
- Chung JWY, Wong TKS, Yeung ACP. Non-attendance at an orthopaedic and trauma specialist outpatient department of a regional hospital. J Nurs Manag 2004;12:362-7
- Hamilton W, Round A, Sharp D. Effect on hospital attendance rates of giving patients a copy of their referral letter: randomised controlled trial. BMJ (Clin Res Ed) 1999;318:1392-5
- Neal RD, Hussain-Gambles M, Allgar VL, et al. Reasons for and consequences of missed appointments in general practice in the UK: questionnaire survey and prospective review of medical records. BMC Fam Pract 2005;6:47
- Stubbs ND, Geraci SA, Stephenson PL, et al. Methods to reduce outpatient non-attendance. Am J Med Sci 2012;344:211-19
- Norris JB, Kumar C, Chand S, et al. An empirical investigation into factors affecting patient cancellations and no-shows at outpatient clinics. Decision Support Systems 2014;57:428-43
- Deyo RA, Inui TS. Dropouts and broken appointments – a literature review and agenda for future research. Med Care 1980;18:1146-57
- Lacy NL, Paulman A, Reuter MD, Lovejoy B. Why we don’t come: patient perceptions on no-shows. Ann Fam Med 2004;2:541-5
- Wolfgang F, Kasten E. No-shows in outpatient medical institutions in Germany – a pilot study about explanations of patients why they missed their appointment. Sci J Publ Health 2014;2:238-42
- Lowes R. How to handle no-shows. Med Econ 2005;82:62-5
- Herrick J, Gilhooly ML, Geddes DA. Non-attendance at periodontal clinics: forgetting and administrative failure. J Dentistry 1994;22:307-9
- Dove HG, Schneider KC. The usefulness of patients’ individual characteristics in predicting no-shows in outpatient clinics. Med Care 1981;19:734-40
- Lee JC, Truong PT, Kader HA, et al. Postmastectomy radiotherapy reduces locoregional recurrence in elderly women with high-risk breast cancer. Clin Oncol 2005;17:623-9
- Dreiher J, Froimovici M, Bibi Y, et al. Nonattendance in obstetrics and gynecology patients. Gynecol Obstet Investig 2008;66:40-3
- Gurol-Urganci I, de Jongh T, Vodopivec-Jamsek V, et al. Mobile phone messaging reminders for attendance at healthcare appointments. Cochrane Database Syst Rev 2013;12: doi: 10.1002/14651858.CD007458
- McLean S, Gee M, Booth A, et al. Targeting the Use of Reminders and Notifications for Uptake by Populations (TURNUP): a systematic review and evidence synthesis. Health Serv Deliv Res 2014;2:1-184
- Bailey NTJ. A study of queues and appointment systems in hospital outpatient departments, with special reference to waiting-times. J Roy Stat Soc B 1952;14:185-99
- Al-Aomar R, Awad M. Dynamic process modeling of patients’ no-show rates and overbooking strategies in healthcare clinics. Int J Manag Econ 2012;3:3-21
- Cayirli T, Yang KK, Quek SA. A universal appointment rule in the presence of no-shows and walk-ins. Prod Oper Manag 2011;21:682-97
- Chakraborty S, Muthuraman K, Lawley M. Sequential clinical scheduling with patient no-show: the impact of pre-defined slot structures. Socio Economic Planning Sciences 2012;47:205-19
- Erdogan SA, Denton B. Dynamic appointment scheduling of a stochastic server with uncertain demand. J Computing 2013;25:116-32
- Tang J, Yan C, Cao P. Appointment scheduling algorithm considering routine and urgent patients. Expert Systems Applications 2014;41:4529-41
- Zacharias C, Pinedo M. Appointment scheduling with no-shows and overbooking. Prod Oper Manag 2014;23:788-801
- Muthuraman K, Lawley M. A stochastic overbooking model for outpatient clinical scheduling with no-shows. IEEE Transactions 2008;40:820-37
- Zeng B, Turkcan A, Lin J, Lawley M. Clinic scheduling models with overbooking for patients with heterogeneous no-show probabilities. Ann Oper Res 2010;178:121-44
- Sharp DJ, Hamilton W. Non-attendance at general practices and outpatient clinics. BMJ (Clin Res Ed) 2001;323:1081-2
- Shonick W, Klein BW. An approach to reducing the adverse effects of broken appointments in primary care systems: development of a decision rule based on estimated conditional probabilities. Med Care 1977;15:419-29
- Miller NH, Hill M, Kottke T, Ockene IS. The multilevel compliance challenge: recommendations for a call to action. A statement for healthcare professionals. Circulation 1997;95:1085-90
- Izard T. Improving patient care: managing the habitual no-show patient. Fam Pract Manag 2005;12:65-6
- Anderson K, Zheng B, Yoon SW, Khasawneh MT. An analysis of overlapping appointment scheduling model in an outpatient clinic. Oper Res Health Care 2015;4:5-14
- Huang Y, Zuniga PJ. Dynamic overbooking scheduling system to improve patient access. J Oper Res Soc 2011;63:810-20
- Huang Y, Hanauer DA. Patient no-show predictive model development using multiple data sources for an effective overbooking approach. Appl Clin Informat 2014;5:836-60
- Rohleder T, Klassen K. Rolling horizon appointment scheduling: a simulation study. Health Care Manag Sci 2002;5:201-9
- Lotfi V, Torres E. Improving an outpatient clinic utilization using decision analysis based patient scheduling. Socio Economic Planning Sciences 2014;48:115-26
- LaGanga L, Lawrence S. Clinic overbooking to improve patient access and increase provider productivity. Decision Sciences 2007;38:251-76