
Peculiarity of Balkan region
Extending to the south from central Europe into the Mediterranean Sea, the region of the Balkans includes the countries of Albania, Bosnia and Herzegovina, Bulgaria, Croatia, Greece, Romania, Serbia, Slovenia, The Former Yugoslav Republic of Macedonia (FYR Macedonia), Montenegro, and the geographical/political region of European TurkeyCitation1. Most Balkan states are middle-income countries, with the exception of Greece, Croatia, and Slovenia, which are all high-income countriesCitation2. In addition, some of these countries are Member States of the European Union (EU): Greece since 1981, Slovenia since 2004, Bulgaria and Romania since 2007 and Croatia since 2013Citation3. All other Balkan countries are EU candidate countries, with the exception of Bosnia and Herzegovina, which is a potential candidate for EU membershipCitation3. There are also differences in the performance of health systems among themCitation4. All countries in the past 20 years have been faced with different problems in financing healthcare and trying to implement different reforms in order to assure a sustainable and efficient healthcare systemCitation5,Citation6. During two and a half decades of health reform processes, the formerly massive hospital-centered system of the Post-Semashko countries (Albania, Bulgaria, Romania) and former Yugoslavia republics (Bosnia and Herzegovina, Croatia, Montenegro, Serbia, Slovenia and FYR Macedonia) have clearly been reshaped towards more preventive and efficient primary care, whereas, among the prior-free-market countries (Greece, Turkey) physician density increased the mostCitation4. Among all Western Balkan countries, Bosnia and Herzegovina, consisting of the Federation of Bosnia and Herzegovina with its 10 cantons, Republic of Srpska and Brcko District, has the most complicated organization of health system financing and medicines reimbursementCitation6, leading to inequity in access to medicines among different administrative regions, which are covered by 12 different health insurance fundsCitation7. Total health expenditure expressed as a percentage of gross domestic product and total expenditure on health per capita in terms of current purchase power parity in international $ showed an obvious increase in most of the Balkan countries during 1995–2012Citation8.
Expenditure on pharmaceuticals in the Balkan countries
In recent years, a lot of attention has been devoted to pharmaceuticals, which have become one of the largest and fastest growing components of health spendingCitation9. Although pharmaceutical expenditure is a standard indicator, for some low- and middle-income countries no recent internationally comparable data is availableCitation10,Citation11. In order to elucidate the trend of pharmaceutical expenditure in the Balkan countries, as the majority of them are middle-income countries, we must refer to the National Health Accounts (NHA) data published as an annex to “The World Medicines Situation Report 2011” by the World Health Organization (WHO), which contains the most comprehensive up-to-date internationally comparable publicly available data on pharmaceutical expenditure for the majority of countries in the world, but only until 2005 and 2006Citation10,Citation12,Citation13.
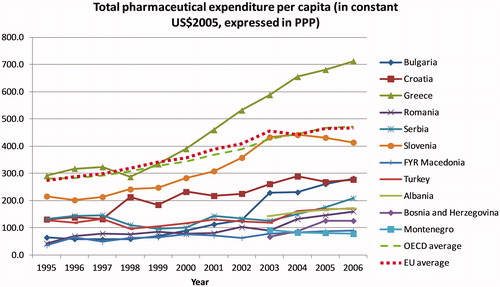
shows dynamics of total pharmaceutical expenditure per capita in terms of purchase power parity (PPP) in constant US$2005 during the 1995–2006 time span for Balkan countries, along with the OECD (Organization for Economic Co-operation and Development) and EU average values. We can notice that Greece, Slovenia, and Croatia form the top tier, with the largest pharmaceutical spending with mostly increasing tendency, along with Greece being the only Balkan country which had a higher level of pharmaceutical expenditure than the OECD and EU average. This comes as no surprise, as these countries belong to the high-income countries group. All other Balkan countries had a similar level of total pharmaceutical expenditure, with a slight increase since 2002, which was particularly prominent in Bulgaria, where total pharmaceutical expenditure reached the level of Croatia.
Figure 1. Total pharmaceutical expenditure per capita in terms of purchase power parity (PPP) in constant US$2005 in the Balkan countries in 1995–2006. Source: WHO13. OECD and EU average are calculated based on a list of countries with active membership in each given year.
The financial crisis, which manifested in late 2007, resulted in a Europe-wide economic crisis by 2009Citation14. The economic recession has had mixed effects on pharmaceutical consumption, expenditure, and prices, with substantial variability in the response to recession among different countriesCitation15,Citation16. Internationally comparable publicly available data on total pharmaceutical expenditure after 2006 are unavailable for the majority of Balkan countries, but some journal articles and national reports may shed light on what happened with pharmaceutical expenditure after this year on a national level.
During 2007–2012, pharmaceutical expenditure in per capita terms recorded 25% growth in Serbia, whereas a marginal decrease (0.4%) was noticed in GreeceCitation17. Greece recorded much more intense recession effects in the pharmaceutical sector: in 2007 the pharmaceutical expenditure per capita in Greece was 2.22-times the pharmaceutical expenditure per capita in Serbia, whereas in 2012 it reduced to 1.76-timesCitation17. The Greek government enacted a number of fiscal policies in order to deal with the dramatic economic fluctuations caused by the global financial crisis, including the lowering of pharmaceutical prices, as well as setting the budget for pharmaceuticals to a fixed share of the gross domestic productCitation18. It was projected that these restrictions would result in a considerable share (35–47%) of the outcome of pharmaceutical spending cutback becoming counterbalanced by the yielded loss in public revenuesCitation18. An increase of pharmaceutical spending in Serbia coincided with the increasing trend in public debt which doubled during 2004–2012, and shortages of pharmaceuticals occurred more frequently compared to the period before 2008, due to substantial public debt towards pharmaceutical companies supplying the Eastern European marketCitation17,Citation19. Healthcare authorities in Serbia were trying to contain growing pharmaceutical expenditure by cutting prices of medicines—in May 2015, the Ministry of Health announced that the prices of ∼930 drugs were set to become up to 30% cheaperCitation6.
According to the national reports of agencies for medicines and medical devices, expenditure on pharmaceuticals expressed in absolute terms in national currency increased in: Bosnia and Herzegovina from BAM 467 million in 2009 to BAM 597 million in 2015Citation20,Citation21, Croatia from HRK 3.9 billion in 2007 to HRK 5.3 billion in 2015Citation22,Citation23, and Montenegro from EUR 53.6 million in 2009 to EUR 66.2 million in 2015Citation24,Citation25. In fact, Montenegro is considered to be the smallest pharmaceutical market in the Balkans, with an increasing trend in total pharmaceutical expenditure, despite government recommendations on cost savingsCitation6.
In Slovenia, pharmaceutical spending slowed down in 2010 and fell by ∼1% in real terms in 2011, before rising again by 2.6% in 2012Citation26. A series of measures were taken in 2009 in order to control growth on spending on pharmaceuticals, which included a revision of the reimbursement list of the national health insurance fund and agreements with the pharmaceutical industry for discounts on drug pricesCitation26,Citation27. All these led to a fall in the share devoted by the Health Insurance Institute of Slovenia to pharmaceuticals from 18.2% in 2006 to 14.4% in 2014Citation27. A similar occurrence was noted in Croatia, where the share of expenditure of the Croatian Health Insurance Fund (CHIF) on prescription drugs had fallen from 17.08% in 2007 to 14.61% in 2012, but still represented the second largest proportion of CHIF’s expenditure after inpatient careCitation28. Croatia introduced a number of reforms in 2013 in order to reduce debt levels, add new medicines to the reimbursement list, and improve quality of careCitation29. These reforms included changes in the reference pricing system, including order of reference price countries, lowering the prices of successive generics, and strict control of pharmaceutical company activitiesCitation29.
Turkey experienced a substantial rise in total pharmaceutical sales from USD 2.5 billion in 2002 to USD 8.0 billion in 2012, as a result of improved access to healthcare after implementation of the Turkish Health Transformation Program, which began in 2003Citation30. If the pricing mechanism of pharmaceuticals had not been changed during the implementation of the Health Transformation Program, expenditure on pharmaceuticals would be even largerCitation30. In Albania, annual expenditures on reimbursed drugs increased from ALL 3.5 billion in 2007 to ALL 8.4 billion in 2013, due to a variety of reasons: expansion of the health insurance scheme, reimbursement of innovative drugs, the tendency of the physicians to prescribe expensive therapies, lack of rules and regulations controlling this sector, and lack of significant policy for using generic drugs as substitutes for expensive products with the same active substancesCitation31. Pharmaceutical expenditure is a significant area of the health sector in Albania, which demands better regulation in order to assure that expenditure growth stays within the limits of the budgetCitation31.
The Bulgarian pharmaceutical market has been growing since 1999, with a continuing trend, despite the economic crisis, and in 2009 the value of the total pharmaceutical market reached BGN 1,553 million (∼EUR 800 million), which represented an increase of 27% compared to 2004Citation32. Total pharmaceutical expenditure of the National Health Insurance Fund (NHIF) of Bulgaria was EUR 268 million in 2011, which continued to increase in the subsequent years due to the expansion of the NHIF’s coverageCitation33. This prompted Bulgarian authorities to adopt a new policy framework regarding drug pricing and reimbursement, which seemed successful at first in 2012 and 2013, but deficit spending was a problem again in 2014Citation33. The NHIF was experiencing a budget deficit, which was expected to be ∼26.6% in 2014: EUR 488 million was projected to be spent on drug therapies, although initially EUR 386 million was allocatedCitation33. In Romania, pharmaceutical expenditure increased from EUR 1.287 billion in 2012 to EUR 1.380 billion in 2013Citation34. Despite the increasing value of the pharmaceutical market and public pharmaceutical expenditure, there have been calls for increasing the public budget for pharmaceuticalsCitation34. There are concerns regarding under-utilization of generics, and health authorities continue to try to improve price-setting procedures, drug reimbursement, and the use of health technology assessment to get better value for moneyCitation34.
Concluding remarks
It seems that the majority of Balkan countries exhibit a trend of increasing pharmaceutical expenditure which they try to contain more or less successfully by introducing new policy measures. Unfortunately, cross-country comparison of pharmaceutical expenditure in the Balkan countries after 2006 is infeasible due to the lack of internationally comparable data. Evolution of pharmaceutical expenditure has been better characterized for most high-income and few middle-income countries due to the launch of major repositories of data: OECD Health Data and Eurostat Health database for member countries of OECD and the EUCitation10. Despite clear definitions and sound methodologiesCitation11, even these repositories have gaps in time series and missing data for some of the countriesCitation35,Citation36. The European Health for all database (HFA-DB) also contains some data on pharmaceutical expenditure, but again with inconsistent time periods and unavailable data for the majority of Balkan countriesCitation37. For many low- and middle-income countries no comprehensive data on retail sales and executed budget on pharmaceuticals are usually available beyond what the Ministry of Health or other interested agencies can collectCitation12. That is why the annex to “The World Medicines Situation Report 2011” following a WHO study is still considered to be the most comprehensive source of data on pharmaceutical expenditure worldwideCitation10,Citation12,Citation13. Investment in improvement of quantity and quality of internationally comparable data on pharmaceutical expenditure would provide the basis for analyzing the impact of different policies in various settings, which is particularly needed in low- and middle-income countries with scarce financial resources.
Of course, analyzing pharmaceutical expenditure provides only one part of the perspective of the overall drug utilization—the economic one. Pharmaceutical expenditure is essentially influenced by both prices of drugs and volumesCitation10. Therefore, expenditure data is sensitive to changes in ex-factory, wholesale, or retail prices, as well as variations in utilizations and the product mix of drugsCitation10. Capturing these changes would further clarify underlying drivers of pharmaceutical expenditure. Comprehensive databases may be used to analyze changes in pharmaceutical expenditure by separating it into three components: relative price of drugs, quantity, and a residual (a measure of impact of changes in drug treatment patterns on pharmaceutical expenditure which if bigger (smaller) than 1 indicates that there is higher usage of more expensive (cheaper) drugs)Citation38,Citation39. For example, Lambrelli and O'DonnelCitation40 used this methodology to decompose pharmaceutical expenditure data from the largest social insurance fund in Greece for 1991-2006, and showed that the dramatic increase in expenditure during this period was mostly attributable to a switch to more innovative and more expensive pharmaceuticals. The increase in the volume of prescribed drugs also contributed to the increase in pharmaceutical expenditure of the fund, but to a lesser extentCitation40. Other aspects of pharmaceutical utilization, such as rational prescribing and generic utilization, cannot be evaluated when only expenditure is observed. Rational prescribing and rational use of drugs, regarded as an appropriate way of utilization of limited available public resources, could affect pharmaceutical expenditure without reductions of the rights of insured persons for medical productsCitation41. In parallel with generic drug competition, opening the market to biosimilar competition could also lead to significant savings for healthcare systemsCitation42. It should be noted that evolution of pharmaceutical spending is influenced by a vast range of drivers which affect both the supply and demand for pharmaceuticals, as well as demographic factorsCitation43. The inevitable demographic change caused by population ageing will certainly be shaping growing needs for pharmaceuticals and the landscape of their consumption in the years to comeCitation44–46.
Ana V. Pejcic Faculty of Medical Sciences University of Kragujevac, Kragujevac, Serbia [email protected] Mihajlo Jakovljevic Health Economics and Pharmacoeconomics Faculty of Medical Sciences, University of Kragujevac Kragujevac, Serbia
Transparency
Declaration of funding
This work was supported by the Ministry of Education, Science and Technological Development of the Republic of Serbia through Grant No. 175014. AP is awarded with the Scholarship of the Ministry of Education, Science and Technological Development of the Republic of Serbia for PhD students. Publication of results was not contingent to the Ministry’s censorship or approval.
Declaration of financial/other relationships
The authors have no relevant affiliations or financial involvement with any organization or entity with a financial interest in or financial conflict with the subject matter or materials discussed in the manuscript, apart from those disclosed. JME peer reviewers on this manuscript have no relevant financial or other relationships to disclose
References
- Balkans States Map and Information Page [Internet]; 2016. http://www.worldatlas.com/webimage/countrys/europe/balkans.htm. Accessed February 27, 2017
- World Bank Country and Lending Groups – World Bank Data Help Desk [Internet]; 2016. https://datahelpdesk.worldbank.org/knowledgebase/articles/906519-world-bank-country-and-lending-groups. Accessed February 28, 2017
- EUROPA - Countries [Internet]. https://europa.eu/european-union/about-eu/countries_en. Accessed February 28, 2017
- Jakovljevic MM, Arsenijevic J, Pavlova M, et al. Within the triangle of healthcare legacies: comparing the performance of South-Eastern European health systems. J Med Econ 2017;20:483-92
- Jakovljevic MB. Resource allocation strategies in Southeastern European health policy. Eur J Health Econ 2013;14:153-9
- Koçkaya G, Wertheimer A. Pharmaceutical market access in emerging markets. Torino, Italia: SEEd; 2016. 239 p
- Catic T. Differences in reimbursement prices and inequalities to access most commonly prescribed medicines in Bosnia and Herzegovina. Value Health 2015;18:A527
- Rancic N, Kovacevic A, Dragojevic-Simic V. Long-term health expenditure changes in selected Balkan countries. Front Public Health 2015;3:152
- Morgan S. The determinants of prescription drug expenditure … and what to do about them. 2014. https://open.library.ubc.ca/cIRcle/collections/ubccommunityandpartnerspublicati/47136/items/1.0048391. Accessed February 27, 2017
- Elseviers M, Andersen M, Benko R, et al. Drug utilization research: Methods and applications. Chichester, West Sussex: Hoboken, NJ: John Wiley & Sons; 2016
- Vogler S, Zimmermann N, Habl C. Understanding the components of pharmaceutical expenditure—overview of pharmaceutical policies influencing expenditure across European countries. Generics Biosimilars Initiat J 2013;2:178-87
- Lu Y, Hernandez P, Abegunde D, et al. The world medicines situation 2011. Med Expend World Health Organ Geneva [Internet]. 2011. http://www.who.int/entity/health-accounts/documentation/world_medicine_situation.pdf?ua=1. Accessed February 28, 2017
- Annex: The World Medicines Situation 2011 - Medicine Expenditures. World Health Organization. [Internet]. 2011. http://apps.who.int/medicinedocs/en/m/abstract/Js20052en/. Accessed February 28, 2017
- Keegan C, Thomas S, Normand C, et al. Measuring recession severity and its impact on healthcare expenditure. Int J Health Care Finance Econ 2013;13:139-55
- Impact of the Economic Recession on the Pharmaceutical Sector [Internet]; 2010. http://apps.who.int/medicinedocs/en/m/abstract/Js17419e/. Accessed March 1, 2017
- Leopold C, Mantel-Teeuwisse AK, Vogler S, et al. Effect of the economic recession on pharmaceutical policy and medicine sales in eight European countries. Bull World Health Organ 2014;92:630-640D
- Jakovljevic M, Souliotis K. Pharmaceutical expenditure changes in Serbia and Greece during the global economic recession. South East Eur J Public Health 2016;5. DOI: 10.4119/UNIBI/SEEJPH-2016-101
- Souliotis K, Papageorgiou M, Politi A, et al. Estimating the fiscal effects of public pharmaceutical expenditure reduction in Greece. Front Public Health 2015;3:203
- Jakovljevic MB, Djordjevic N, Jurisevic M, et al. Evolution of the Serbian pharmaceutical market alongside socioeconomic transition. Expert Rev Pharmacoecon Outcomes Res 2015;15:521-30
- The Agency for Medicinal Products and Medical Devices of Bosnia and Herzegovina. Report on consumption of market authorized medicines in 2009 in Bosnia and Herzegovina [Internet]. Banja Luka: The Agency for Medicinal Products and Medical Devices of Bosnia and Herzegovina; 2010. http://www.almbih.gov.ba/_doc/publikacije/PrometLijekova2009BiH.pdf. Accessed March 2, 2017
- The Agency for Medicinal Products and Medical Devices of Bosnia and Herzegovina. Report on consumption of market authorized medicines in 2015 in Bosnia and Herzegovina [Internet]. Banja Luka: The Agency for Medicinal Products and Medical Devices of Bosnia and Herzegovina; 2016. http://www.almbih.gov.ba/_doc/publikacije/promet2015.pdf. Accessed March 2, 2017
- Agency for Medicinal Products and Medical Devices of Croatia. Annual Report on Drug Consumption for 2007 [Internet]. Zagreb: HALMED; 2008. http://www.halmed.hr/Novosti-i-edukacije/Publikacije-i-izvjesca/Izvjesca-o-potrosnji-lijekova/Izvjesce-o-prometu-lijekova-u-Republici-Hrvatskoj-u-2007/. Accessed March 2, 2017
- Agency for Medicinal Products and Medical Devices of Croatia. Annual Report on Drug Utilisation for 2015 [Internet]. Zagreb: HALMED; 2016. http://halmed.hr/Novosti-i-edukacije/Publikacije-i-izvjesca/Izvjesca-o-potrosnji-lijekova/Izvjesce-o-potrosnji-lijekova-u-Republici-Hrvatskoj-u-2015/. Accessed March 2, 2017
- Agency for Medicines and Medical Devices of Montenegro. Report on medicines consumption in Montenegro in 2009 [Internet]. 2010. https://www.calims.me/Portal/faces/dinamickeStrane?_afrWindowMode=0&_afrLoop=26718080599316225¶mRender=1¶mS=67&_adf.ctrl-state=x7e7e7y5r_121. Accessed March 2, 2017
- Agency for Medicines and Medical Devices of Montenegro. Report on medicines consumption in Montenegro in 2015 [Internet]. Agency for Medicines and Medical Devices of Montenegro; 2016. https://www.calims.me/Portal/faces/dinamickeStrane?_afrWindowMode=0¶mS=168&_afrLoop=26718081683561422¶mRender=1&_adf.ctrl-state=x7e7e7y5r_130. Accessed March 2, 2017
- OECD. OECD Health Statistics 2014 How does Slovenia compare? [Internet]. 2014. http://www.oecd.org/els/health-systems/Briefing-Note-SLOVENIA-2014.pdf. Accessed March 1, 2017
- Cylus J. Analysis of the Health System in Slovenia. Health System Expenditure Review. Final Report. [Internet]. 2015. http://www.mz.gov.si/fileadmin/mz.gov.si/pageuploads/Analiza/Report_Expenditure_review_Slovenia_FINAL_FORMATTED_without_cover.pdf. Accessed March 1, 2017
- Džakula A, Sagan A, Pavić N, et al. Croatia: Health system review. Health Syst Transit 2014;16:1-162
- Godman B, Kwon H-Y, Brkičić LS, et al. Pharmaceutical pricing in Croatia: a comparison of ordinances in 2013 versus 2009 and their potential savings to provide future guidance. Generics Biosimilars Initiat J 2015;4:79-89
- Yılmaz ES, Koçkaya G, Yenilmez FB, et al. Impact of health policy changes on trends in the pharmaceutical market in Turkey. Value Health Reg Issues 2016;10:48-52
- Avdi E. The effect of pricing policies and cost-containment measures in Albanian health insurance scheme. Romanian Econ Bus Rev 2013;8:61
- Dimova A, Rohova M, Moutafova E, et al. Bulgaria: Health system review. Health Syst Transit 2012;14:1-186
- Iskrov G, Stefanov R. Prospects of risk-sharing agreements for innovative therapies in a context of deficit spending in Bulgaria. Front Public Health 2015;3:64
- Vlădesc C, Scîntee SG, Olsavszky V, et al. Romania: health system review. Health Syst Transit 2016;18:1-170
- EuroREACH. WP4 International Health Data Systems – draft [Internet]; 2011. http://www.euroreach.net/sites/default/files/WP4%20International%20Health%20Data%20Systems%20Deliverable.pdf. Accessed March 13, 2017
- OECD. Pharmaceutical spending (indicator). [Internet]; 2017. OECD. http://data.oecd.org/healthres/pharmaceutical-spending.htm. Accessed March 13, 2017
- European Health for All Database (HFA-DB) [Internet]; 2016. http://data.euro.who.int/hfadb/. Accessed March 13, 2017
- Gerdtham UG, Johannesson M, Jönsson B. Drug expenditure and new drug introductions: the Swedish experience. Pharmacoeconomics 1993;4:215-25
- Gerdtham UG, Lundin D. Why did drug spending increase during the 1990s? A decomposition based on Swedish data. Pharmacoeconomics 2004;22:29-42
- Lambrelli D, O’Donnell O. The impotence of price controls: failed attempts to constrain pharmaceutical expenditures in Greece. Health Policy 2011;101:162-71
- Kajdiž R, Bojnec Š. Determinants of public expenditures for medicinal products in non hospital consumption in Slovenia. EM Ekon Manag 2014;17:27-34
- OECD. Tackling Wasteful Spending on Health [Internet]. OECD Publishing; 2017. http://www.oecd-ilibrary.org/social-issues-migration-health/tackling-wasteful-spending-on-health_9789264266414-en. Accessed March 2, 2017
- Belloni A, Morgan D, Paris V. Pharmaceutical expenditure and policies [Internet]. Paris: Organisation for Economic Co-operation and Development; 2016. http://www.oecd-ilibrary.org/;jsessionid=9ed8987pnsqh9.x-oecd-live-03content/workingpaper/5jm0q1f4cdq7-en. Accessed February 28, 2017
- Jakovljevic MB, Milovanovic O. Growing burden of non-communicable diseases in the emerging health markets: the case of BRICS. Front Public Health 2015;3:65
- Jakovljevic MB, Vukovic M, Fontanesi J. Life expectancy and health expenditure evolution in Eastern Europe-DiD and DEA analysis. Expert Rev Pharmacoecon Outcomes Res 2016;16:537-46
- Jakovljevic M, Laaser U. Population aging from 1950 to 2010 in seventeen transitional countries in the wider region of South Eastern Europe. SEEJPH 2015;3. DOI: 10.4119/UNIBI/SEEJPH-2015-49