
Abstract
Aims: Multiple sclerosis (MS) is a disabling autoimmune disease affecting the central nervous system. Few studies have examined the effect of MS on patient outcomes in Japan. The study aim was to quantify MS burden in Japan by comparing MS respondents to matched controls on patient outcomes.
Materials and methods: Data from seven administrations of the nationally representative Japan National Health and Wellness Survey (2009–2014 and 2016) were used (n = 181,423). Respondents self-reporting MS diagnosis were compared with respondents not reporting MS. Matched controls were selected using propensity scores. Respondents with MS and matched controls were compared on health-related quality-of-life (HRQoL), work productivity and activity impairment, healthcare resource utilization, and costs. Comparisons were made using Chi-square tests or one-way ANOVAs.
Results: A total of 96 respondents with MS and 480 matched controls were included in the analyses. MS respondents reported worse mental (44.35 vs 47.51, p < .05), physical (33.11 vs 49.04, p < .001), and role (37.78 vs 47.11, p < .001) component summary scores (minimally important difference is 3.0). Additionally, MS respondents reported decrements on every health profile sub-scale (p < .001) and 5-Level EuroQoL-5 Dimensions outcome (p < .01). MS respondents also reported more healthcare provider visits (13.78 vs 6.13) and hospitalizations (3.02 vs 0.70; both, p < .001), leading to higher direct costs. For work productivity and activity impairment, MS respondents reported more absenteeism (17.50% vs 5.57%), presenteeism (38.11% vs 21.62%), overall work impairment (46.68% vs 25.27%), and activity impairment (46.88% vs 24.90%, all, p < .001), leading to higher indirect costs.
Limitations: Japan NHWS data are cross-sectional, and causal relationships cannot be established. Due to the self-reported nature of the data, responses could not be independently verified.
Conclusions: Results suggest MS in Japan is associated with poorer HRQoL and greater work and activity impairment, healthcare resource use, and costs. Improved MS management could benefit both patients and society.
Introduction
Multiple sclerosis (MS) is a chronic demyelinating and neurodegenerative disease of the central nervous system, affecting numerous systems of the bodyCitation1,Citation2. The most common initial symptoms of MS are sensory symptoms and fatigue, minimal or mild cognitive impairment, and mobility problemsCitation2,Citation3. Although most MS patients have a normal (or near-normal) life expectancy, up to 60% of patients are no longer fully ambulatory 20 years after disease onsetCitation3.
Global data from the 2008 World Health Organization (WHO) Atlas of MS study provided a median estimated MS prevalence of 30/100,000. Based on data from countries that provided information, there were ∼56,000 MS cases in Western Pacific countries (including Japan) at that timeCitation3. A 2013 update reported that the estimated number of MS cases worldwide has risen from 2.1 million in 2008 to 2.3 million in 2013Citation4. Similarly, cases in Japan appear to be on the rise. Although data specific to Japan were not described in the WHO reports, other contemporary research indicated that the prevalence rate had risen from 8.6 to 13.1/100,000 between 2001 and 2006 in the Tokachi province of HokkaidoCitation5. By 2011, the prevalence in the Tokachi province had reached 16.2/100,000Citation6. According to a 2016 study that estimated the prevalence of MS diagnosis using data from the Japan Medical Center claims database, the prevalence of MS similarly increased from 15.0/100,000 in 2011 to 18.0/100,000 in 2014Citation7.
MS patients have exceedingly complex clinical needs requiring extensive treatment and repeated access to multidisciplinary healthcare teamsCitation8. Patients show substantial decrements in health-related quality-of-life (HRQoL), and MS symptoms result in difficulties engaging in daily activities and lead to employment disruptionsCitation9. In 2010, the worldwide impact of MS resulted in an estimated 1,075,000 disability-adjusted life years (DALYs, the sum of years of life lost due to premature mortality and years lived with disability)Citation10,Citation11. In addition, patient burden increases with greater disease severity. A 2011 study of Japanese MS patients showed increasing disease severity to be strongly correlated with decreased mobility, more symptoms, poorer emotional well- being, more difficulties with thinking, and greater fatigueCitation9.
Furthermore, the financial impact of MS is sizable. A 2016 study estimated direct costs of MS using a large Japanese health insurance claims database in which 1,133 MS patients were identified and followed across a 6-month period from 2013–2014. The total per patient monthly cost was ¥93,542 (United States [US] $776; ¥1,122,504 and $9,317/year),1 which is ∼3-times the estimated per patient monthly cost in the general population. Moreover, half of the overall medical costs were attributed to disease-modifying therapy (DMT). For newly-diagnosed patients, hospitalization costs were responsible for the largest financial impact in the initial month. Drug costs were responsible for the largest financial impact over timeCitation12. However, as this study assessed data from a health insurance claims database, it did not include patient-reported outcomes like HRQoL and work productivity and activity impairment. In Australia (also in the Western Pacific region), 2010 annual costs per person with MS averaged nearly Australian [AU] $50,000 (US $36,235 and ¥4,365,663/year), with lost productivity cited as the largest contributor to costsCitation13. The difference in annual costs across these two studies may be due to the fact that these data came from two separate countries and/or due to methodological differences.
Fortunately, DMTs and multidisciplinary care plans are available to attenuate patient suffering and offset MS-related economic burden in JapanCitation8. However, few studies have quantified the burden of MS in Japan at both the patient and societal (i.e. costs) levels using patient-reported data. The objective of this study was, thus, to quantify the burden of MS in Japan with respect to HRQoL, work productivity and activity impairment, healthcare resource utilization, and associated costs using data from a large cross-sectional health survey designed to be representative of the Japanese population.
Methods
Sample selection and procedure
Participants were unique respondents who completed the Japan National Health and Wellness Survey (NHWS, n = 181,423), which was administered in 2009–2014 and in 2016. Potential respondents were selected from an opt-in survey panel through stratified random sampling, with strata by age and gender specified to match the Japanese general adult population. Invitations to participate in the NHWS were sent to members of the Lightspeed Research Internet panel (as well as Lightspeed Research panel partners) via e-mail, with reminder e-mails sent as needed. To be eligible for the current study, all participants were required to be: (1) able to read and understand Japanese; (2) able to operate a computer accessing the online survey; (3) located in Japan; (4) aged 18 or older; and (5) willing to provide informed consent to participate. After providing informed consent, respondents completed a confidential self-administered online survey. Thus, outcomes were all retrospective and patient-reported. Regarding incentives, participants received points that could be exchanged for small prizes or accumulated over time for larger items. The study was found to be exempt by Pearl IRB (Indianapolis, IN), as there was minimal anticipated impact on respondents, given that this was a survey study asking about non-invasive topics.
Cohort identification
Respondents who self-reported a doctor diagnosis of MS were considered part of the respondents with MS group. Those who did not report a diagnosis of MS served as the “no MS” control group, which was further culled to identify a sub-set of matched controls.
Data quality control
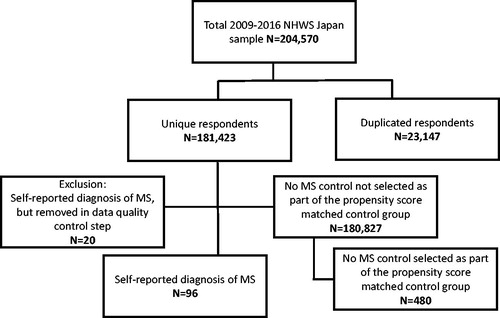
Data quality control was implemented through examination of each variable in the data. Specifically, descriptive statistics including means, medians, minimums, and maximums were examined, as well as the distribution of each variable. As a part of this process, it was noticed that, of the 116 participants reporting a diagnosis of MS, 20 respondents had unusually high (≥30) Charlson Comorbidity Index (CCI; see Health history section below) scores. When further examined, it was noticed that these respondents had, on average, endorsed 131 out of 158 total possible diseases. As this phenomenon conferred either excessive medical morbidity and/or misunderstanding of the NHWS questionnaire, these 20 respondents were removed. The remaining 96 respondents were included in the respondents with MS group (see ). No controls were removed from the analyses.
Figure 1. Respondent flow diagram for the study. MS, Multiple sclerosis; NHWS, National Health and Wellness Survey.
Measures
Demographics
Age (entered as a continuous variable), education (coded as university degree vs all else), household income (coded as < ¥3,000,000, ¥3,000,000–<¥5,000,000, ¥5,000,000–<¥8,000,000, ¥8,000,000 or more, or decline to answer), and health insurance status (coded as National Health Insurance, Social Insurance, Late Stage Elderly Insurance, other, or no insurance) were assessed for all respondents.
Health history
Smoking habits (coded as current, former, or never smoker), exercise behavior (coded as do not exercise vs regularly exercise), alcohol use (coded as currently consume alcohol vs abstain), body mass index (BMI) category (coded based on the WHO recommendations for Asian populations: underweight [<18.5 kg/m2], acceptable risk [18.5–<23 kg/m2], increased risk [23.0–<27.5 kg/m2], high risk [≥27.5 kg/m2], or decline to provide weight)Citation14, and chronic disease burden, as measured by the CCI, were includedCitation15. The CCI is a composite score, with a higher score suggesting a higher burden of chronic disease. It is calculated based on the presence of chronic conditions (e.g. diabetes, peptic ulcer, liver disease, and cancer), with each condition assigned a score of 1, 2, 3,2 or 6 (). The CCI was originally designed to predict 10-year mortality, and it has been widely used to assess chronic disease burden in large retrospective studies. The CCI is also frequently used to describe comorbidity burden in studies of chronic illness populations, including recent studies of MSCitation16.
Table 1. Description of primary diagnoses in NHWS contributing to CCI.
Health outcomes
HRQoL was assessed using the physical (PCS), mental (MCS), and role component summary (RCS) scores from the 36/12-item Medical Outcomes Study (MOS) Short Form Health Survey version 2 (SF-36v2 and SF-12v2)Citation17,Citation18. These measures have undergone numerous validation studiesCitation17,Citation18. Short Form-6 Dimensions (SF-6D) health utility scores, which are derived from the SF-12v2/SF-36v2, were also includedCitation19,Citation20. Additionally, individuals completing the SF-36v2 (survey administrations in 2012–2014 and 2016) were compared on an 8-factor health profile that included physical functioning, role-physical, bodily pain, general health, vitality, social functioning, role-emotional, and mental health norm-based scores (mean = 50 and standard deviation = 10). Those who participated in the 2016 survey also completed the 5-level EuroQol-5 Dimensions (EQ-5D-5L)Citation21. For SF-36v2 scores, minimally important differences (MIDs) = 3.0, and for SF-6D health utility scores, MID = 0.041Citation18,Citation22.
Work productivity and activity impairment outcomes
Work productivity and activity impairment were assessed using the Work Productivity and Activity Impairment–General Health (WPAI-GH) questionnaireCitation23. Four sub-scales (absenteeism, presenteeism, overall work impairment, and activity impairment) are generated from the WPAI-GH in the form of percentages, with higher values indicating greater impairment due to the patient’s health. Only respondents currently employed (full-time, part-time, or self-employed) provided data with respect to absenteeism, presenteeism, and overall work impairment, and the recall period is 1 week. The WPAI-GH is frequently used to describe work productivity and activity impairment in studies of chronic illness populations, including recent studies of MSCitation24.
Healthcare resource utilization outcomes
Healthcare resource utilization was defined by the number of healthcare provider visits, the number of emergency room (ER) visits, and the number of times hospitalized in the past 6 months.
Cost outcomes
Indirect and direct costs were estimated from the available Japan NHWS data. Annual indirect costs were calculated by integrating information from the WPAI-GH (percentage of impairment) and hourly wage rates from the Japan Basic Survey on Wage Structure, 2011, using the Lofland methodCitation25. For each employed respondent, his or her annual wage was estimated based on median weekly rates (provided by demographic strata) multiplied by the number of weeks in a year. Direct costs were estimated by multiplying the number of physician visits, ER visits, and hospitalizations in the past 6 months by two (to estimate annual number of visits) and then multiplying by the corresponding unit cost for each, which was obtained from the literatureCitation26,Citation27. In the case of hospitalizations, only a cost per day was obtained from the literature, while the NHWS asks respondents for the number of hospitalizations. To align them, the cost per day was multiplied by the average length of stay per hospitalization in Japan, as reported by the Organization for Economic Cooperation and DevelopmentCitation27.
Analyses
All analyses were conducted using Statistical Analysis System (SAS) version 9.3Citation28. A matching procedure was employed to minimize sample size imbalance and control for covariates between the respondents with MS and controls. For each respondent with MS, five respondents from the control group, who closely resembled the respondents with MS, were identified using a greedy-matching algorithm based on propensity scoresCitation29. Propensity scores were derived using a logistic regression model with the following demographic and health characteristics as predictors: age, sex, employment, education, income group, insurance type, BMI group, alcohol use, smoking status, exercise, CCI category (categorized as 0, 1, 2, or 3+ comorbidities), and year of survey completion. A power calculation was used to select the 1:5 match with controls, where power exceeds 0.80 under a moderate effect size (Cohen’s d ≥0.33).
Demographic, health history, and outcome (i.e. HRQoL, WPAI-GH, healthcare resource utilization, and costs) variables were compared between respondents with MS and controls before and after matching. To detect statistically significant differences between groups, chi-square and one-way analysis of variance (ANOVA) tests for categorical and continuous variables, respectively, were conducted.
Results
Bivariate statistics for the 96 respondents with MS and 181,307 controls are presented in . The respondents with MS differed from overall respondents significantly on sex (more female MS respondents), employment (higher unemployment for MS respondents), annual household income (lower income for MS respondents), BMI (fewer increased or higher risk BMI for MS respondents), alcohol use (less alcohol use for MS respondents), exercise behavior (less regular exercise for MS respondents), and CCI category (higher CCI for MS respondents), all p < .05. After running the matching procedure, 480 controls were matched with MS respondents and included in the main analyses as the matched control group. The matching procedure equalized the groups on all background variables. All p-values were >.25, suggesting that the groups were not significantly different on the background variables, and that the procedure was, thus, successful (). Of 96 MS respondents and 480 matched controls, the majority were female (65.6%), middle-aged (46.4 years old, on average), college-educated (51.2%), and unemployed (59.5%). Most respondents (79.0%) had a CCI score of zero. Group differences in outcomes indicated greater impairment among respondents with MS, as compared with controls.
Table 2. Comparison of respondent characteristics between respondents with MS and controls.
Health outcomes
MCS, PCS, and RCS scores were all significantly lower among those with MS, compared with matched controls (all p-values < .05, and all exceeded MID) (). SF-6D health utilities were also significantly lower among respondents with MS, and the 8-factor health profile was also lower on all measures (all p-values < .001, and all exceeded MID) (). Although limited in sample size due to inclusion in 2016 only, EQ-5D-5L index scores were significantly lower in respondents with MS, as were EQ-5D visual analog scale (VAS) scores (both p-values = .005) ().
Figure 2. Comparison of 8-item SF-36v2 health profile scores between diagnosed MS respondents to the matched control group. 95% confidence intervals are presented, and all p-values are <.001. Only respondents taking NHWS surveys in 2010–2014 and 2016 were included. MS, Multiple sclerosis.
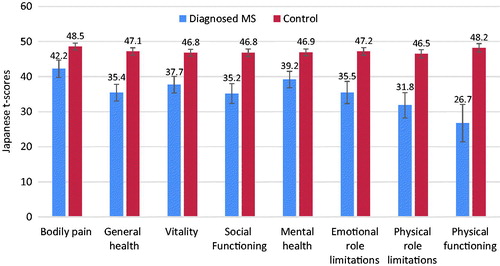
Table 3. Comparison of health-related quality-of-life outcomes between MS patients and controls.
Healthcare resource utilization outcomes
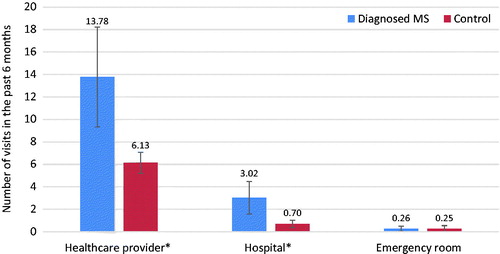
Healthcare resource use was significantly higher among respondents with MS. Healthcare provider visits for respondents with MS were more than double (13.78 vs 6.13), and hospitalizations were more than quadruple (3.02 vs 0.70) those of matched controls (both, p < .001) ().
Figure 3. Comparison of health resource utilization and costs between MS patients and matched controls. 95% confidence intervals are presented, and p-values significant at <.001 are indicated with an *. MS, Multiple sclerosis.
Work productivity and activity impairment outcomes
Although the WPAI-GH results were limited in power because of the low proportion of employed respondents with MS, work productivity and activity impairment for respondents with MS was higher on every sub-scale.
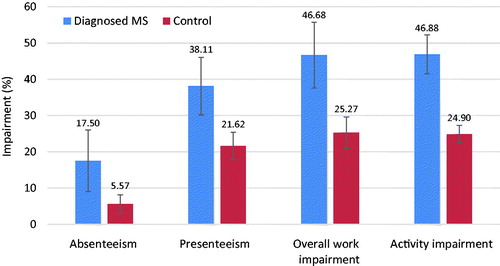
Respondents with MS reported significantly higher absenteeism (17.50% vs 5.57%), presenteeism (38.11% vs 21.62%), overall work impairment (46.68% vs 25.27%), and activity impairment (46.88% vs 24.90%) (all, p < .001) ().
Figure 4. Comparison of work productivity and activity impairment between MS patients and controls. 95% confidence intervals are presented, and all p-values <.001. MS, Multiple sclerosis. Only respondents currently employed (full-time, part-time, or self-employed) provided data with respect to absenteeism, presenteeism, and overall work impairment.
Cost outcomes
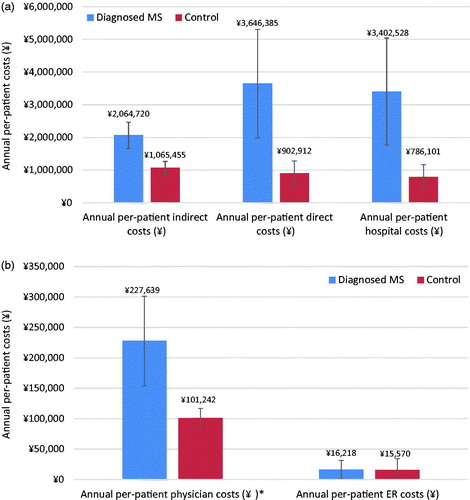
Additionally, estimated direct and indirect costs were significantly higher for respondents with MS, which was in line with overall work impairment and healthcare resource use outcomes (all, p < .001), with the exception of ER costs (p = .98) (). Mean annual per-patient direct costs were estimated at ¥3,646,385 ($30,265) for respondents with MS, compared with ¥902,912 ($7,494) for matched controls. Mean annual per-patient indirect costs were estimated at ¥2,064,720 ($17,137), compared with ¥1,065,455 ($8,843) for matched controls.
Figure 5. (a) Comparison of annual per-patient indirect, direct, and hospital costs. 95% confidence intervals are presented, and all p-values <.001. (b) Comparison of annual per-patient physician costs and ER costs. 95% confidence intervals are presented, and p-values significant at .001 are indicated with an *. ER, Emergency room; MS, Multiple sclerosis.
Discussion
This is the first case control study to evaluate the burden of MS in Japan using patient-reported outcomes and a large nationally representative survey. Results indicate that the presence of MS in Japan is associated with poorer HRQoL, greater work productivity impairment (leading to higher indirect costs), and greater healthcare resource utilization (leading to higher direct costs), relative to matched controls. The present study differed from other Japanese MS studies, in that it provided data on patient and economic burden from the viewpoint of the patient. Another novel aspect of the present study was that, rather than collecting data from claims databases, hospitals, or specialized facilities, the present sample was recruited through a large health survey designed to be representative of the Japanese general adult population as a whole, thereby providing a broader view (including alignment with census data for Japan).
A clear finding from the study is that respondents with MS reported experiencing significantly poorer HRQoL across all measured indicators, relative to matched controls, with mean differences surpassing the respective MIDs for MCS, PCS, RCS, all domain scores, and SF-6D health utility scoresCitation18,Citation22. These findings align with other recent Japanese studies of HRQoL in persons with degenerative disorders and other chronic medical conditionsCitation30,Citation31.
Estimated costs were greatly increased, as measured by overall work impairment (for employed respondents) and healthcare resource use. It should be noted that many respondents with MS were unemployed (58.3%), despite being, on average, middle-aged (average age of 47.5 years old). It should be noted that the high proportion of unemployment in middle-aged adults may, itself, be an indicator that symptom burden was prevalent in the study sample. For the employed respondents (41.7% of those with MS), all indicators of work productivity and activity impairment were elevated, relative to matched controls. The degree of absenteeism, in particular, was 3-times higher in employed respondents with MS vs employed matched controls, and activity impairment was nearly double that of matched controls.
Respondents with MS also reported more than double the number of healthcare provider visits and more than quadruple the number of hospitalizations than matched controls. Ultimately, median annual per-patient indirect costs for respondents with MS were estimated to be nearly 4-times greater than for matched controls. Similarly, median annual per-patient direct costs were also estimated to be 4-times higher for respondents with MS than for matched controls.
This nearly 4-fold difference in direct costs is slightly larger than the estimates provided from another recent Japanese study, which estimated that total per-patient monthly direct costs were ∼3-times higher for those with MS, compared with the general population. However, this other research study used different methodologies than the current studyCitation12. Methodological differences, including utilization of different data sources, are known to produce variations in economic estimates in MS researchCitation32.
Ultimately, the overall pattern of results observed for costs in the current study is consistent with previous reports on MS from a wide array of countriesCitation8,Citation9,Citation32. In terms of total cost per year, the estimate for respondents with MS (¥3,646,385 [$30,265]) was comparable to estimates from Australia of ¥4,365,663 ($36,235)Citation13. Annual direct costs in this study were nearly 3-times greater than those of a recent 2016 study using claims data (¥3,646,385 vs ¥1,122,504)Citation12. These differences may be attributed to difference in data sources and methodologies used for analyzing costs.
Limitations
There are a number of limitations to the current study that should be considered alongside the results. Data from the Japan NHWS are based on self-reported outcomes; as such, the values reported cannot be independently verified. However, the survey is relatively low-stakes, and respondents have little incentive to misrepresent their reporting. Further, given the cross-sectional nature of the data, causal or longitudinal relationships cannot be determined.
Additionally, matching variables were fairly conservative, including employment and income (which may be impacted by MS symptoms). Including employment and income in the match may have resulted in an under-estimation of work-related burden. Also, work impairment conclusions may be limited in power because of the low proportion of employed MS patients out of the total sample. Another limitation was that the EQ-5D-5L data were only collected in 2016, limiting the sample size for some of the HRQoL outcome analyses. Given most respondents had CCI scores of 0, it also is likely the study sample reflected healthier adults, thereby limiting generalizability. Results may also be less generalizable to those without internet access and/or patients with higher symptom burden, since they are less likely to participate in the NHWS.
Conclusions
When compared with controls, the presence of MS in Japan was consistently associated with significantly higher burden, as measured in the form of HRQoL, work productivity and activity impairment, healthcare resource utilization, and costs. This is an indication that MS places a significant burden on patients and the economic system in Japan. Improved MS management could benefit both the patient and the Japanese economy.
Transparency
Declaration of funding
This study was funded by Biogen.
Declaration of financial/other interests
CN reports that, in connection with this manuscript, there are no conflicts of interest to be disclosed. MH is an employee of and holds stock and/or stock options in Biogen. NW was an employee of Biogen at the time this analysis was performed. RL is an employee of Kantar Health, which is a paid consultant for Biogen. Peer reviewers on this manuscript have received an honorarium from CMRO for their review work, but have no other relevant financial relationships to disclose.
Acknowledgments
The authors thank Tammy Schuler for her assistance in the preparation of this manuscript.
Notes
Notes
1 Yen to US dollar conversions were based on the average 2016 exchange rate of 0.0083 yen per US dollar.
2 Conditions contributing to CCI at a score of 3 (i.e. moderate-to-severe liver disease) was not asked in NHWS.
References
- Whitwell J. Setting new standards in multiple sclerosis care and research. Lancet Neurol 2012;11:835
- Kister I, Bacon TE, Chamot E, et al. Natural history of multiple sclerosis symptoms. Int J MS Care 2013;15:146-58
- WHO. Atlas multiple sclerosis resources in the world 2008. Geneva, Switzerland: WHO Press; 2008
- Browne P, Chandraratna D, Angood C, et al. Atlas of multiple sclerosis 2013: a growing global problem with widespread inequity. Neurology 2014;83:1022-4
- Houzen H, Niino M, Hata D, et al. Increasing prevalence and incidence of multiple sclerosis in northern Japan. Mult Scler 2008;14:887-92
- Houzen H, Niino M, Hirotani M, et al. Increased prevalence, incidence, and female predominance of multiple sclerosis in northern Japan. J Neurol Sci 2012;323:117-22
- Ogino M, Shiozawa A, Ohta H, et al. Prevalence and patient characteristics of multiple sclerosis (MS) in Japan. Value Health 2016;19:A873
- Multiple Sclerosis International Federation. Atlas of MS 2013: mapping multiple sclerosis around the world. Mult Scler Int Fed London, United Kingdom. 2013;1-28
- Kikuchi H, Mifune N, Niino M, et al. Impact and characteristics of quality of life in Japanese patients with multiple sclerosis. Qual Life Res 2011;20:119-31
- Murray CJL, Vos T, Lozano R, et al. Disability-adjusted life years (DALYs) for 291 diseases and injuries in 21 regions, 1990–2010: a systematic analysis for the Global Burden of Disease Study 2010. Lancet 2012;380:2197-223
- Vos T, Flaxman AD, Naghavi M, et al. Years lived with disability (YLDs) for 1160 sequelae of 289 diseases and injuries 1990–2010: a systematic analysis for the Global Burden of Disease Study 2010. Lancet 2012;380:2163-96
- Ogino M, Kawachi I, Otake K, et al. Current treatment status and medical cost for multiple sclerosis based on analysis of a Japanese claims database. Clin Exp Neuroimmunol 2016;7:158-67
- Palmer AJ, Colman S, O’Leary B, et al. The economic impact of multiple sclerosis in Australia in 2010. Mult Scler Int Fed 2013;19:1640-6
- WHO expert consultation. Appropriate body-mass index for Asian populations and its implications for policy and intervention strategies. Lancet (London, England) 2004;363:157-63
- Charlson ME, Pompei P, Ales KL, et al. A new method of classifying prognostic comorbidity in longitudinal studies: development and validation. J Chronic Dis 1987;40:373-83
- Marrie RA, Bernstein CN, Peschken CA, et al. Intensive care unit admission in multiple sclerosis: increased incidence and increased mortality. Neurology 2014;82:2112-19
- Ware JE, Kosinski Jr M, Turner Bowker DM, et al. How to score version 2 of the SF-12v2® Health Survey (with a supplement documenting SF-12® Health Survey). Lincoln, RI: Qual. Inc.; 2002
- Maruish ME, editor. New SF36v2 user guide, 3rd Edition. Lincoln, RI: QualityMetric Incorporated. 2011
- Brazier J, Roberts J. The estimation of a preference-based measure of health from the SF-12. Med Care 2004;42:851-9
- Brazier J, Roberts J, Deverill M. The estimation of a preference-based measure of health from the SF-36. J Health Econ 2002;21:271-92
- Herdman M, Gudex C, Lloyd A, et al. Development and preliminary testing of the new five-level version of EQ-5D (EQ-5D-5L). Qual Life Res 2011;20:1727-36
- Walters SJ, Brazier JE. Comparison of the minimally important difference for two health state utility measures: EQ-5D and SF-6D. Qual Life Res 2005;14:1523-32
- Reilly MC, Zbrozek AS, Dukes EM. The validity and reproducibility of a work productivity and activity impairment instrument. Pharmacoeconomics 1993;4:353-65
- Glanz BI, Degano IR, Rintell DJ, et al. Work productivity in relapsing multiple sclerosis: associations with disability, depression, fatigue, anxiety, cognition, and health-related quality of life. Value Health 2012;15:1029-35
- Lofland JH, Pizzi L, Frick KD. A review of health-related workplace productivity loss instruments. Pharmacoeconomics 2004;22:165-84
- Ministry of Health, Labour, and Welfare. 2012. Available at: http://www.mhlw.go.jp/bunya/iryouhoken/database/zenpan/dl/h23_doukou_03.pdf [Japanese]
- Organization for Economic Cooperation and Development. Average length of stay in hospital for all causes, 2000 and 2009 (or nearest year). Available at: http://dx.doi.org/10.1787/888932524659
- SAS Institute Inc. SAS/STAT 9.3 user’s guide. Cary, NC: SAS Institute, Inc.; 2011
- Parsons LS. Reducing bias in a propensity score matched-pair sample using greedy matching techniques. The Twenty-Sixth Annual SAS Users Group International Conference. 2001;214–26
- Miyashita M, Narita Y, Sakamoto A, et al. Health-related quality of life among community-dwelling patients with intractable neurological diseases and their caregivers in Japan. Psychiatry Clin Neurosci 2011;65:30-8
- Kojima M, Kojima T, Ishiguro N, et al. Psychosocial factors, disease status, and quality of life in patients with rheumatoid arthritis. J Psychosom Res 2009;67:425-31
- Ernstsson O, Gyllensten H, Alexanderson K, et al. Cost of illness of multiple sclerosis - a systematic review. PLoS One 2016;11:e0159129