
Abstract
Aims: To model direct medical costs associated with reductions in cardiovascular disease (CVD) events in T2DM patients reported in the CANVAS and EMPA-REG trials, which assessed the cardiovascular safety of canagliflozin and empagliflozin, respectively.
Materials and methods: Costs were modeled from a US managed care organization (MCO) perspective for the CVD outcomes included in both trials: three-point major adverse cardiovascular event (MACE) and its components (cardiovascular-related death, nonfatal myocardial infarction, nonfatal stroke), as well as heart failure requiring hospitalization. The rate of CVD events averted (difference between study drug and placebo) was projected to the portion of an MCO T2DM population matching the respective trial’s inclusion criteria. A targeted literature search for paid amounts directly associated with each CVD event provided the unit costs, which were applied to the projected number of events averted, to calculate costs avoided per member per year (PMPY). One-way sensitivity analyses were performed on events averted, unit costs, and percentages of trial-applicable patients.
Results: Based on three-point MACE events averted, costs avoided PMPY of $6.17 (range: $1.27–$10.94) for CANVAS and $2.75 ($0.19–$4.83) for EMPA-REG were estimated. Costs avoided for individual components of MACE ranged from $0.77 to $3.84 PMPY for CANVAS and from -$0.97 (additional costs) to $1.54 for EMPA-REG. PMPY costs avoided for heart failure were $2.72 for CANVAS and $1.32 for EMPA-REG.
Limitations and conclusions: Models assumed independent, non-recurrent outcomes and were restricted to medical costs directly associated with the trial-reported events. The reductions in CVD events in T2DM patients reported for both CANVAS and EMPA-REG project to a positive cost avoidance for these events in an MCO population. The analysis did not include an assessment of the impact on total cost, as the costs associated with adverse events, drug utilization or other clinical outcomes were not examined.
Introduction
Type 2 diabetes mellitus (T2DM) is caused by progressively reduced insulin secretion in the presence of insulin resistance, leading to abnormal metabolism of carbohydrates. It is typically diagnosed based on abnormal plasma glucose or glycated hemoglobin (HbA1c)Citation1. The health consequences of T2DM stem not only from the metabolic disease itself but also from the associated complications, notably cardiovascular disease (CVD).
T2DM is associated with a two-fold increase in specific CVD outcomes including myocardial infarction and stroke, independent of conventional risk factorsCitation2. Moreover, the combination of T2DM and CVD is associated with a greater mortality risk than having either of these conditions aloneCitation3.
Due to its prevalence and complications, T2DM has the potential to impose a high economic burden on US managed care plans. Indeed, the costs associated with diabetes and its complications in the US in 2017 were estimated at $327 billion ($237 billion in direct medical costs and $90 billion in reduced productivity)Citation4. Moreover, an individual with diagnosed diabetes was estimated to have a 2.3 times higher direct medical expenditure (including inpatient, outpatient, and pharmacy costs) compared to a similar individual without diabetes, after adjustment for age and sexCitation4.
The treatment landscape for T2DM has been rapidly evolving in recent years. Among a number of novel therapies are compounds of the sodium-glucose co-transporter 2 inhibitor (SGLT2i) class. Canagliflozin and empagliflozin are the two SGLT2is approved by the Food and Drug Administration (FDA) to improve glycemic control in adults with T2DM, used in conjunction with diet and exercise. Although the approval of new therapies to treat the patients with diabetes focuses on glycemic control, the evaluation of new therapies by other stakeholders (e.g. payers) may include other outcomes related to diabetes treatment.
Given the increased CVD risks associated with certain diabetes treatments, notably the thiazolidinedionesCitation5, the US FDA has issued guidelines recommending additional safety trials to be conducted to demonstrate that T2DM medications will not result in an unacceptable increase in CVD eventsCitation6. Results from several such post-marketing trials have been published to date, including trials studying two of the four FDA-approved SGLT2is, the CANVAS trial for canagliflozin and EMPA-REG for empagliflozinCitation7,Citation8 while trial results for dapagliflozin (e.g. VERTIS CV [ClinicalTrials.gov Identifier: NCT01730534; completed September 2018]; Dapa-HF [NCT03036124; expected completion December 2019]) and ertugliflozin (e.g. DECLARE-TIMI 58 [NCT01986881; expected completion September 2019]) are not yet published. Several other CVD outcomes trials for different classes of T2DM therapies are currently ongoingCitation9.
In a consensus statement, the American Association of Clinical Endocrinologists and the American College of Endocrinology, endorsed the use of SGLT2is as an adjunctive oral anti-hyperglycemic agent for combination therapy with metformin. Furthermore, the SGLT2is were reported to decrease HbA1c, weight and systolic blood pressure, as well as reduce various CVD events and secondary renal endpoints. However, the SGLT2is were reported to increase the risk of mycotic genital infections, as well as low-density lipoprotein (LDL) cholesterol levels, and have limited efficacy in patients with lower estimated glomerular filtration rate. Furthermore, they were associated with higher risk of dehydration, bone fractures, and diabetic ketoacidosisCitation10. Moreover, the SGLT2is, as a newer class of diabetes medication, have no generic alternatives, leading to a relatively higher costCitation11.
Results from the CANVAS (CANagliflozin CardioVascular Assessment Study) Program demonstrated a significant reduction in the primary composite MACE (major adverse cardiovascular event) outcome of cardiovascular death, nonfatal myocardial infarction, or nonfatal stroke in patients treated with canagliflozin compared to standard of care (placebo), with a rate of 26.9 per 1000 patient-years (PY) in the canagliflozin group and 31.5 per 1000 PY in the placebo group, and a hazard ratio (HR) of 0.86 (95% confidence interval [CI]: 0.75–0.97)Citation8. The population had a mean age of 63.3 years and was predominantly male (64.2%); more than half of the patients (65.6%) had a history of cardiovascular disease at baselineCitation8. An analysis of adverse events showed notably an increase in the rate of atraumatic lower limb amputation, leading to an FDA recommendation in 2017 that a boxed warning regarding amputation be addedCitation12.
The EMPA-REG OUTCOME (Cardiovascular Outcome Event Trial in Type 2 Diabetes Mellitus Patients) trial showed that empagliflozin significantly reduced the rate of the MACE outcome with a rate of 37.4 per 1000 PY in the empagliflozin group and 43.9 per 1000 PY in the placebo group and a HR (95% CI) of 0.86 (0.74–0.99)Citation7. The population had a mean age of 63.1 years and was predominantly male (71.2%); all patients had established CVD (e.g. 75.6% of the patients had a coronary heart disease at baseline)Citation7. The FDA approved the indication of empagliflozin to reduce the risk of cardiovascular death in adults with T2DM in 2016Citation13.
The goal of the present study was to complement the literature on CVD outcomes in T2DM patients by using economic models to estimate the economic value associated with reductions in CVD reported for patients treated with canagliflozin in CANVAS and with empagliflozin in EMPA-REG. The trial-based clinical findings were combined with unit-costs and population projections obtained from the literature to estimate the direct healthcare costs avoided in an adult US commercially-insured (i.e. managed care organization [MCO]) population under 65 years of age. This economic evaluation focused on the CVD outcomes that were reported in both trials.
Methods
Costs models were developed to estimate CVD costs avoided for the CANVAS and EMPA-REG trials, separately, drawing upon the published clinical results from the primary publication for each trialCitation7,Citation8, supplemented with event cost parameters extracted from a targeted literature search. The five CVD events targeted for the quantification of costs avoided were reported for both CANVAS and EMPA-REG trials; three-point MACE, cardiovascular death, nonfatal myocardial infarction, nonfatal stroke and heart failure requiring hospitalization.
The models were intended to project the costs avoided to an adult US commercially-insured (i.e. MCO) population less than 65 years old. Based on a prevalence of 6.35% for US adults less than 65 years old with T2DMCitation14, the size of the T2DM subpopulation was estimated. In the CANVAS-based and EMPA-REG-based economic models, the event rates reported for each trial were applied to the proportion of insured lives matching the trial’s study population criteria. The clinical trial population for CANVAS was composed of patients who were either 30 years of age or older with a history of symptomatic atherosclerotic CVD or 50 years of age or older with CVD risk factors (seeCitation8 for the list of inclusion criteria), which was termed the “primary and secondary CVD prevention” population. The clinical trial population for EMPA-REG was composed of patients with established CVD who were 18 years of age or older (seeCitation7 for the list of inclusion criteria), which was termed the “secondary CVD prevention” population.
Values for the prevalence of “secondary CVD prevention” and “primary and secondary CVD prevention” populations were taken from a published analysis of the National Health and Nutrition Examination Survey (NHANES) from 2011 to 2012 and 2013 to 2014, for patients less than 65 years oldCitation15. NHANES uses a complex, multistage, probability sampling design to create a nationally representative survey of the non-institutionalized civilian US populationCitation16.
The unadjusted rates of events per 1000 person-years (PY) were extracted for the placebo and treated (or pooled treated) arms of the CANVAS and EMPA-REG trialsCitation7,Citation8. The difference in events per 1000 PY between the placebo and treated arms was defined as the number of events averted per 1000 PY. Since the three-point MACE is calculated based on the first occurrence among three outcomes, the number of events averted for the three-point MACE may differ from the sum of the components. To estimate the rate of events averted in a US managed care population, the raw trial rates of CVD events averted were projected to the proportion of a plan’s covered lives that met the trial criteria (i.e. primary and secondary CVD prevention for CANVAS and secondary CVD prevention for EMPA-REG). The projected rate of events averted per 1000 PY for each of the trials’ applicable population was converted into a number of events averted in one year for a modeled MCO population of 1 million covered lives.
The unit costs of events used in the models were extracted from the published literature based on a targeted literature review, where studies published within the last 10 years that analyzed insurance claims or hospital records for an adult population in the US were selected. To maintain the perspective of US managed care plans, “paid” costs rather than “billed” costs or charged amounts were selected. Unit costs of events were selected to represent costs temporally linked to the event or the year of the event. The time horizon for the economic models was limited to a single year, without attempting to forecast the potential economic implications of a clinical event in future years.
To estimate the unit cost of the composite three-point MACE endpoint, the unit costs of individual MACE components were weighted to reflect the component event rates in each trial. Since the proportions of cardiovascular death, nonfatal myocardial infarction and nonfatal stroke represented in the MACE results of CANVAS and EMPA-REG were not the same, the unit cost applied to the MACE endpoint differed in the two models (See Appendix).
The costs avoided for each endpoint were calculated for the two models by multiplying the number of events averted per year in the modeled MCO population and the unit cost estimates for each event. Costs avoided were reported as two metrics: per member per year (PMPY) and per T2DM patient per year (PDPPY). In cases where the placebo arm had a lower event rate than the study treatment arm, the negative costs avoided would represent an incremental cost to the insurer.
The models assumed that clinical events and their associated costs were independent and non-recurrent. Specifically, the potential impact of an event on the risk of subsequent events was not taken into account. The time-to-event analyses reported in the primary publications only reported on the first occurrence of a given CVD outcome, therefore, the model could not account for multiple occurrences of these outcomes.
One-way sensitivity analyses were performed to assess the effect on results by varying assumptions in rates of events in the reported trial results, in the per-unit costs extracted from the literature and in the prevalence rates defining the applicable population for each trial.
First, to account for the variability in rates of events reported in the CANVAS or EMPA-REG trials’ published results, the confidence intervals (CIs) of the adjusted hazard ratios (HR) for each event (as per trial dataCitation7,Citation8) were used, along with the rate of events in the placebo arm to calculate the lower and upper ranges of the rate of events averted.
Second, to account for the variability in the per unit costs extracted from the literature, the smallest and largest applicable costs identified in the literature were used as lower and upper ranges, or the costs based on lesser or greater severity of the event were used to define lower and upper ranges.
Third, to account for the variability in the assumed prevalence for primary CVD prevention and secondary CVD prevention, lower and upper bounds were set equal to the boundaries of the 95% CIs assuming a binomial distributionCitation15. Calculations were made using the Hmisc package in R version 3.4.1 (R Foundation, Vienna, Austria).
provides the values of all parameters used in the models and sensitivity analyses, with details in the Appendix.
Table 1. Parameters for the main and sensitivity analyses.
All costs were inflated to 2016 US dollars using the Consumer Price Index for All Urban Consumers (CPI-U), Medical CareCitation17. The models were implemented in Excel 2016 (Microsoft, WA, USA).
Results
Main analysis
In both models, the prevalence of T2DM was 6.35% in the theoretical MCO population, resulting in 63,500 patients with T2DM out of 1 million members. In the CANVAS model, the rate of events averted was projected to the primary CVD prevention and secondary CVD prevention proportion (50.5%) of the MCO T2DM population. In the EMPA-REG model, the rate of events averted was projected to the secondary CVD prevention proportion, which represented 15.4% of the MCO T2DM population ().
Table 2. Projected MCO avoided costs for cardiovascular outcomes observed in the CANVAS and EMPA-REG trialsa
Given the difference in the rate of events between the treated and standard of care populations, the number of events associated with the three-point MACE averted in the theoretical population over one year, was 147.5 for the CANVAS model and 63.6 for the EMPA-REG model. This resulted in avoided costs PMPY of $6.17 for the CANVAS model and $2.75 for the EMPA-REG model. The same values PDPPY were $97.11 and $43.29 ().
Avoided costs associated with individual components of the three-point MACE were smaller than that of the three-point MACE, as expected. For the CANVAS model, the largest costs avoided among the components of the three-point MACE were for nonfatal myocardial infarction at $3.84 PMPY and $60.52 PDPPY for the CANVAS model and $1.54 PMPY and $24.28 PDPPY for EMPA-REG model ().
The number of events avoided for heart failure requiring hospitalization, in the theoretical MCO population over one year was 102.6 for the CANVAS model, and 49.9 for the EMPA-REG model. This resulted in avoided costs of $2.72 PMPY and $42.90 PDPPY for the CANVAS model. Avoided costs associated with reduction in hospitalization for heart failure were $1.32 PMPY and $20.85 PDPPY for the EMPA-REG model ().
Sensitivity analysis
The upper and lower bounds used for the sensitivity analyses have been defined in the methods section and in . and present the results of the one-way sensitivity analyses of avoided costs PMPY per outcome for three sources of variation: the number of events averted in the theoretical population per 1000 PY, the per-unit cost of an event and the applicable percentage of the T2DM population based on trial criteria. All one-way sensitivity analyses on the avoided costs associated with reductions in the three-point MACE resulted in positive values for costs avoided, ranging from $1.27 to $10.94 PMPY for the CANVAS model, and $0.19 to $4.83 PMPY for the EMPA-REG model ( and ).
Figure 1. Sensitivity analysis for avoided costs per member per year for CVD events (CANVAS trial). Abbreviations. CVD, cardiovascular disease; MACE, major adverse cardiac event; MCO, managed care organization; PY, person-years; T2DM, type 2 diabetes mellitus patient per year.
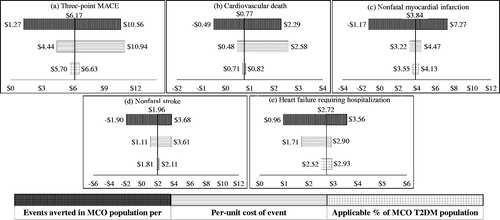
Figure 2. Sensitivity analysis for avoided costs per member per year for CVD events (EMPA-REG trial). Abbreviations. CVD, cardiovascular disease; MACE, major adverse cardiac event; MCO, managed care organization; PY, person-years; T2DM, type 2 diabetes mellitus patient per year.
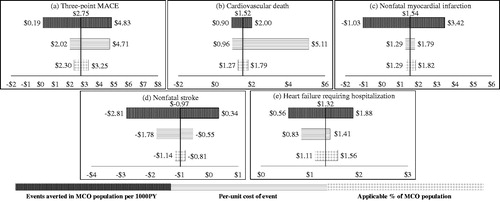
The largest source of variation in costs avoided was the 95% confidence interval around events averted, based on the reported trial event rates. In instances where the lower bound examined for events averted projected to negative costs avoided, the result can be interpreted as incremental costs. A notable example is the impact on costs avoided related to nonfatal stroke. At the lower bounds for events averted, based on the variability of trial event rates, the CANVAS model projects an incremental $1.90 PMPY and the EMPA-REG model projects an incremental $2.81 PMPY ( and ). All one-way sensitivity analyses on heart failure requiring hospitalization resulted in positive costs avoided, varying from $0.96 to $3.56 PMPY for the CANVAS model, and $0.56 to $1.88 PMPY for the EMPA-REG model ( and ).
Discussion
In a main analysis and three one-way sensitivity analyses which varied event rates, per-unit cost of events, and applicable populations, the models predicted positive costs avoided under all conditions for the primary clinical outcome, three-point MACE, based on the observed results from the CANVAS and EMPA-REG trials. The models also estimated costs avoided under all conditions tested for the heart failure requiring hospitalization outcome.
These economic models complement the results of trialsCitation7,Citation8 and of real-world studiesCitation18 which show a growing body of evidence on diabetes outcomes other than glycemic control. The models provide insight for US managed care decision-makers on the potential CVD-related costs avoided in patients treated with canagliflozin or empagliflozin.
The range of costs avoided reported in the sensitivity analysis reflected not only the variation in rate of events in the clinical trial, but also the variation in estimates extracted from the pharmacoeconomic and cost-of-illness literature. For instance, estimating the cost of cardiovascular death is complicated by the diversity of CVD events included in the definitionCitation19.
The current study assumed an evidence-based approach by projecting trial results to populations approximating individual trial inclusion criteria related to established CVD and CVD risk factors. One large-scale real-world study suggests that medication of the SGLT2i class reduced heart failure and death in a population where 87% of the patients had no established CVDCitation18. Of note, the mechanisms underlying a potential class effect are still being studiedCitation20.
The aim of this analysis was to assign an economic value to the observed changes in a specific set of clinical events. The economic values associated with other clinical outcomes such as reductions in HbA1c, systolic blood pressure, body weight or adverse effects are beyond the scope of this economic analysis and were not accounted for. The cost models did not examine prescription drug costs, which would be an important component for any total cost analysis.
The cost analysis for each clinical event type was based on the first occurrence of an event type, independent from the occurrence of other CVD events. Furthermore, the trial results did not quantify multiple occurrences of a given CVD event, so the scope of the model was limited to costs directly associated with the first occurrence. No assumptions were made about future cost implications related to CVD events.
To our knowledge, there is no centralized database of unit costs from a managed care perspective for the trial-reported outcomes in patients with T2DM using SGLT2is, therefore, several estimates from the published literature were extracted. This resulted in heterogeneity in per-unit cost of event, given the diversity of methods, adjustments, definitions, etc., employed in the literature. When diabetes-specific costs were not available, costs pertaining to the general health-insured population were used. Furthermore, the applicable percentage of the MCO T2DM population pertained to the US general population, which may be different from a population of insured individuals. A common set of cost assumptions were applied to both CANVAS and EMPA-REG models.
Finally, the models used parameters extracted from two different trials, which may have had differences in the methods and measurements of outcomes. In both cases, the models were evidence-based, providing estimates relevant for MCO populations representative of those studied in each trial.
Conclusions
Estimates for CVD-related costs avoided for a managed care population were estimated based on the reductions in CVD events that were measured in both the CANVAS and EMPA-REG trials. Across all sensitivity analyses performed, three-point MACE, the primary outcome for each study, was associated with cost avoidance in both PMPY and PDPPY. The results presented here contribute to an understanding of the economic effects represented by the clinical results reported in these trials. More research is needed to understand additional clinical outcomes and cost implications of SGLT2i medications in real-world T2DM populations.
Transparency
Declaration of funding
This study was funded by Janssen Scientific Affairs, LLC.
Declaration of financial/other interests
MHL, DP, RK, ST, AMM, and PL are employees of Analysis Group, Inc., a consulting company that has received research grants from Janssen Scientific Affairs, LLC, to conduct this study. MD, JC, and BB are employees of Janssen Scientific Affairs, LLC and stockholders of Johnson and Johnson, Inc. Peer reviewers on this manuscript have received an honorarium from JME for their review work, but have no other relevant financial relationships to disclose.
Author contributions
Analyses were conducted by MHL, DP, RK, ST, AMM, and PL. All authors contributed to the study conception and design as well as the interpretation of data and all authors agree to be accountable for all aspects of the work.
Previous presentations
Part of this work was presented at the AMCP Nexus 2018 Meeting (October 22–25, 2018, Orlando, FL, USA).
Acknowledgements
We would like to acknowledge Mahrukh Imran, Mikhail Davidson, Frederic Kinkead, and Sara Kaffashian for their contribution to the manuscript. All were employees of Analysis Group, Inc. at the time of this study. Analysis Group received consulting fees from Janssen Scientific Affairs, LLC for the conduct of this study.
Additional information
Funding
Related Research Data
References
- American Diabetes Association. Standards of medical care in diabetes. Diabetes Care. 2016;39:S1–S109.
- The Emerging Risk Factors Collaboration. Diabetes mellitus, fasting blood glucose concentration, and risk of vascular disease: a collaborative meta-analysis of 102 prospective studies. Lancet. 2010;375:2215–2222.
- The Emerging Risk Factors Collaboration. Association of cardiometabolic multimorbidity with mortality. JAMA. 2015:314(1):52–60.
- American Diabetes A. Economic Costs of Diabetes in the U.S. in 2017. Diabetes Care. 2018;41(5):917–928.
- McCullochD. Thiazolidinediones in the treatment of diabetes mellitus. Up To Date. 2017;1757
- U.S. Food and Drug Administration. Guidance for industry diabetes mellitus — evaluating cardiovascular risk in new antidiabetic therapies to treat type 2 diabetes. U.S. Department of Health and Human Services, Food and Drug Administration, Center for Drug Evaluation and Research (CDER); 2008.
- Zinman B, Wanner C, Lcahin JM, Fitchett D, Bluhmki E, Hantel S, Mattheus M, Devins T, Johansen OE, Woerle HJ, Broedl UC. Empagliflozin, cardiovascular outcomes, and mortality in type 2 diabetes. N Engl J Med. 2015;373(22):2117–2128.
- Neal B, Perkovic V, Mahaffey KW, de Zeeuw D, Fulcher G, Erondu N, Shaw W, Law G, Desai M, Matthews DR. Canagliflozin and cardiovascular and renal events in type 2 diabetes. N Engl J Med. 2017;377(5):644–657.
- Cefalu, W. T, Kaul, S, Gerstein, H. C, Holman, R. R, Zinman, B, Skyler, J. S, Green, J. B, Buse, J. B, Inzucchi, S. E, Leiter, L. A, Raz, I, Rosenstock, J, Riddle, M. C. Cardiovascular Outcomes Trials in Type 2 Diabetes: Where Do We Go From Here? Reflections From a Diabetes Care Editors' Expert Forum. Diabetes Care. 2018;41(1):14–31.
- Garber, A. J, Abrahamson, M. J, Barzilay, J. I, Blonde, L, Bloomgarden, Z. T, Bush, M. A, Dagogo-Jack, S, DeFronzo, R. A, Einhorn, D, Fonseca, V. A, Garber, J. R, Garvey, W. T, Grunberger, G, Handelsman, Y, Hirsch, I. B, Jellinger, P. S, McGill, J. B, Mechanick, J. I, Rosenblit, P. D, Umpierrez, G. E. Consensus statement by the American Association of Clinical Endocrinologists and American College of Endocrinology on the comprehensive type 2 diabetes management algorithm – 2018 executive summary. Endocr Pract. 2018;24(1):91–120.
- Gurgle HE, White K, McAdam-Marx C. SGLT2 inhibitors or GLP-1 receptor agonists as second-line therapy in type 2 diabetes: patient selection and perspectives. Vasc Health Risk Manag. 2016;12:239–249.
- US Food and Drug Administration. FDA confirms increased risk of leg and foot amputations with the diabetes medicine canagliflozin (Invokana, Invokamet, Invokamet XR);2017 [cited 2017 Sep 22]. Available from: https://www.fda.gov/downloads/Drugs/DrugSafety/UCM558427.pdf
- JARDIANCE® (empagliflozin) tablets, for oral use Initial U.S. Approval; 2014, 2016 [cited 2017 Sep 22]. Available from: https://www.accessdata.fda.gov/drugsatfda_docs/label/2016/204629s008lbl.pdf
- CDC National Center for Chronic Disease Prevention and Health Promotion. Estimates of diabetes and its burden in the United States. National Diabetes Statistics Report; 2017 [cited 2018 Sep 16]. Available from: https://www.cdc.gov/diabetes/pdfs/data/statistics/national-diabetes-statistics-report.pdf
- Cai J, Bookhart B, Pfeifer M, Tiggelaar S, Lefebvre P. The prevalence of primary and secondary cardiovascular disease prevention populations among subjects with type 2 diabetes mellitus in the United States. In American Association of Diabetes Educators (AADE): Indianapolis, Indiana; 2017.
- Johnson D, Dohrmann S, Mohadjer L. National Health and Nutrition Examination Survey: Sample Design. National Center for Health Statistics, Vital Heath Stat. 2014;2(162):1–25.
- US Bureau of Labor Statistics. Consumer Price Index – All Urban Consumers; 2017 [cited 2017 Jan 17). Available from: https://data.bls.gov/cgi-bin/surveymost?cu
- CVD-REAL Investigators and Study Group. Lower risk of heart failure and death in patients initiated on SGLT-2 inhibitors versus other glucose-lowering drugs: the CVD-REAL study. Circulation. 2017;136(12):249–259.
- Bonafede, M. M, Johnson, B. H, Richhariya, A, Gandra, S. R. Medical costs associated with cardiovascular events among high-risk patients with hyperlipidemia. Clinicoecon Outcomes Res. 2015;7:337–345.
- Ampudia-Blasco, F. J, Romera, I, Arino, B, Gomis, R. Following the results of the EMPA-REG OUTCOME trial with empagliflozin, is it possible to speak of a class effect? Int J Gen Med, 2017;10:23–26.
- Shetty, S, Stafkey-Mailey, D, Yue, B, Coutinho, Anna B, Wang, W, Landsman-Blumberg, P, Sander, S, Coleman, C. The direct cost of cardiovascular disease-related death in patients with type 2 diabetes mellitus in a commercially insured population in the United States. AMCP 2016 Nexus, October 3–6. National Harbor MD; 2016.
- O'Sullivan, AK, Rubin J, Nyambose J, Kuznik A, Cohen DJ, Thompson D. Cost estimation of cardiovascular disease events in the US. PharmacoEconomics, 2011;29(8): 693–704.
- Straka, Robert J, Liu, Larry Z, Girase, Prafulla S, DeLorenzo, A, Chapman, R. H. Incremental cardiovascular costs and resource use associated with diabetes: an assessment of 29,863 patients in the US managed-care setting. Cardiovasc Diabetol. 2009;8(1):53.
- Ward, A, Alvarez, P, Vo, L, Martin, S. Direct medical costs of complications of diabetes in the United States: estimates for event-year and annual state costs (USD 2012). J Med Econ. 2014;17(3):176–183.
- Chapman, R. H, Liu, L. Z, Girase, P. G, Straka, R. J. Determining initial and follow-up costs of cardiovascular events in a US managed care population. BMC Cardiovasc Disord. 2011;11:11.
Appendix
Table A1. Per-unit cost of events