
Abstract
Aim: Within a treated migraine population, to evaluate if the sub-group meeting criteria for high disease-specific total costs is significantly different to the sub-group with medium and/or low-costs, and to identify the associated risk factors.
Methods: Data from the Household Component of Medical Expenditure Panel Survey (MEPS-HC, 2008–2012), a nationally representative survey of non-institutionalized civilians in the US, were analyzed. Key inclusion criteria were migraine diagnosis (ICD-9 code: 346.XX) and prescribed treatment for migraine. Patients were categorized into high (>top 10th percentile), low (<bottom 10th percentile), and medium (between high and low) cost sub-groups per migraine-specific total costs. Logistic regression models were applied to identify predictors of high vs medium and medium vs low-costs. Preventive eligibility, defined as (i) past/current use of migraine preventives or (ii) overuse of acute medications, was compared to non-preventive eligibility.
Results: Within the treated migraine cohort (n = 1,735), the mean age was 39 years, 80% were female, and the majority were in the medium-cost sub-group (n = 1,360) (low-cost n = 190, high-cost n = 195). Significant predictors of high vs medium-costs were low SF-12 Physical Composite Scores (OR = 0.95; 95% CI = 0.92–0.97), low SF-6D health utility index scores (OR = 0.019; 95% CI = 0.002–0.193), preventive eligibility-i (OR = 0.019; 95% CI = 0.002–0.193), and preventive-eligibility-ii (OR = 3.10; 95% CI = 1.62–5.91). Statistically significant (p < 0.05) predictors of medium vs low-costs included anxiety, Fleishman score, preventive-eligible-i, and preventive-eligible-ii.
Conclusions: Among patients treated for migraine, distinct characteristics, including patient-functioning measures and comorbidities, are predictive of high vs medium-costs, and medium vs low-costs. Preventive eligibility is a predictor of being in the higher cost sub-groups; however, preventive treatments that improve functioning and reduce acute medication use have the potential to reduce migraine-specific costs.
Limitations: The results are limited to a population that is diagnosed and treated for migraine. Over-the-counter medication use, and migraine headache frequency and severity were not captured.
Introduction
The estimated unadjusted total healthcare expenditures among people with migraine, in the US, is $56.31 billion per yearCitation1. Direct costs associated with the management of migraine include contributions from primary care (∼50%), outpatient specialty (∼20%), and emergency department visits (∼15%)Citation2. Indirect costs associated with migraine are also common, with ∼40% of the migraine population accruing indirect costs, with individual averages ranging from nearly $1,000 to over $3,000 per yearCitation3. Both the debilitating nature of this chronic neurological disease and the prevalence patterns for migraine contribute to this high economic burden.
Migraine is characterized by severe attacks of headache pain lasting 4–72 hours with associated hypersensitivity to environmental stimuli, including light and sound; gastrointestinal, cognitive, and vestibular symptoms are also presentCitation4. When a migraine attack occurs, individuals’ ability to function is impaired, which interferes with the conduct of usual daily activities, including occupational, educational, household, family, and social responsibilitiesCitation5. More than 50% of people with migraine report that the impact of a migraine attack results in a severe reduction in the level of physical functioning, often requiring bed restCitation6. In addition, migraine is associated with a number of comorbidities including psychiatric disorders (e.g. depression and anxiety), sleep disorders, fatigue, cardiovascular disease or risk factors (e.g. hypertension, diabetes, high cholesterol, and obesity), cerebrovascular disease, and other chronic pain disorders (e.g. fibromyalgia, musculoskeletal pain, and visceral pain)Citation7–11. In the US, the prevalence of migraine is nearly 12% for those who are at least 12 years of age, with 6% of the male population and 17% of the female population suffering from this diseaseCitation12. The prevalence peaks during prime working ages of adulthood (i.e. >18 years) and begins to decline at ∼55 years of age, approaching single digits in populations older than 65 years of age, with the peak prevalence rate being 26.1% for females aged 18–44 yearsCitation13. The debilitating nature and high prevalence rates during prime working ages make migraine an important neurological disease to further understand the risk factors associated with higher cost sub-groups.
Several studies have reported the significantly higher total cost burden for chronic migraine (CM, ≥15 headache days per month, of which 8 are migraine headache days) compared to episodic migraine (≤14 migraine headache days per month)Citation14. Patient-reported measures of disability and functional impairment are also greater among patients with more frequent migraine headachesCitation15. Other important clinical characteristics associated with higher costs among patients with migraine include comorbidities and acute medication overuseCitation16. Although patient-reported health-related quality-of-life (HRQoL) measures may serve as predictors of indirect or direct costs, the strength of this association when controlling for variables such as comorbidities and acute medication overuse remains unknownCitation3,Citation17. Due to the high prevalence of migraine and the large proportion that have a lower frequency of migraine attacks, there is a need to specifically address the population that would be considered eligible for migraine preventive treatmentCitation15. Therefore, the objective of our study was to determine if cost sub-groups among a treated migraine population were significantly different from each other. More specifically, it was to evaluate if those who meet the criteria for high migraine-specific total costs are statistically significantly different compared to the sub-group with medium and/or low-costs, and identify associated risk factors with being in a higher cost sub-group. This was done using nationally representative data from the Medical Expenditure Panel Survey (MEPS), a public-access, large-scale database in the US that links direct cost information with information on productivity and HRQoL. Secondary objectives included evaluating the distribution of all-cause direct and indirect costs, and all-cause and disease-specific healthcare resource utilization among the cost sub-groups. In addition, the correlation between migraine-specific costs, and measures of comorbidity and HRQoL was analyzed to inform model building.
Methods
Data source
This study used survey data from the 2015 MEPS Household component (MEPS-HC), a nationally representative survey of non-institutionalized civilians in the USCitation18. The MEPS-HC comprises data from the household and individuals with supplementation from their medical providers. The sampling frame is drawn from respondents to the National Health Interview Survey using an overlapping study design. For every new panel of sample households selected in a year, data is collected for two calendar years in five rounds of interviews, which allows for continuous estimates of healthcare expendituresCitation18.
Data in MEPS are collected using computer-assisted personal interviewing which allows for collection of large-scale and individual-specific data. Detailed information is collected on parameters including the following: demographics, diagnosed conditions, health status, medical service utilization, medical expenditures, source of payments, access and satisfaction with healthcare, health insurance coverage, income, and employmentCitation18.
Study data and time period
The study data were drawn from all panel surveys in 2015 MEPS-HC that were completed from 2008 through 2012. Data from patients diagnosed with migraine (ICD-9 code: 346.XX in the Medical Conditions file), who were aged 18–65 years, civilians who were non-institutionalized, and participated in a panel for which 2-year data were available, were included. In addition, these patients had to meet criteria for a “treated migraine cohort”, which was defined as past or current use of a prescribed migraine-preventive medication, or prescribed an acute medication for migraine, at any time during the study.
Among patients who were prescribed an acute medication for migraine, a sub-group with utilization indicative of the need for a preventive treatment was identified. This was done based on following utilization patterns over ∼5 months (or more) during the study period defined as acute medication overuse: (i) opioid use for 8+ days/month, (ii) barbiturate use for 5+ days/month, (iii) triptan use for 8+ days/month, or( iv) any combination of ergotamine, triptans, analgesics, and/or opioids on 10+ days/month without overuse of a single classCitation19,Citation20.
Therefore, within the treated migraine cohort, there were two sub-groups of patients who were considered preventive treatment-eligible: (i) patients identified per history or current use of a migraine preventive and (ii) patients identified per acute medication overuse. A third sub-group was also identified, which consisted of patients who were prescribed acute treatments for migraine and had not met the criteria for acute medication overuse; this sub-group was defined as not eligible for preventive treatment for the purpose of this research. Identifying the third sub-group as not eligible for preventive treatment was a conservative approach, and likely included some patients with at least migraine headache 4 days per month, which is a treatment guideline threshold for considering preventive treatmentCitation21.
Preventive migraine medications included all those listed in the American Academy of Neurology (AAN) and the American Headache Society (AHS) guidelines for the pharmacologic treatment of episodic migraine prevention in adults (2012)Citation22; botulinum toxin for chronic migraine was also included.
Patients who were excluded from the study included: patients who were diagnosed with HIV (ICD9 codes: 042), cancer (codes: Clinical Classification Software Categories 11–45), discontinued from MEPS during the 2 years for any reason, and patients diagnosed with migraine who were not taking a preventive treatment or pattern of acute medication use indicative of preventive eligibility.
Study objectives/assessments
The primary objective of this study was to determine whether patients with high migraine-specific total costs (top 10% of direct healthcare costs and indirect costs) are a statistically significantly different sub-population than patients with low (bottom 10% of direct healthcare costs and indirect costs) or medium (between high and low-costs) costsCitation23,Citation24. Patients were categorized into three sub-groups as high (in the top 10th percentile), medium (between low and high), and low (in the bottom 10th percentile), based on their total migraine-specific costs. This objective included identification of factors associated with high vs medium and medium vs low migraine-specific total costs in patients with migraine.
Secondary objectives were to evaluate the distribution across the sub-groups of all-cause and disease-specific healthcare resource utilization, and direct costs associated with outpatient visits (i.e. healthcare services from a hospital outpatient department), office visits, inpatient visits (i.e. overnight hospitalization), emergency room (ER) visits, prescriptions, and diagnostics. In addition, indirect costs were calculated according to measures of productivity (employment, wages, and missed days of work). Migraine-specific direct costs were healthcare costs specifically documented as being related to the treatment of migraine. Non-migraine direct costs included healthcare costs for outpatient visits, office visits, inpatient visits, and ER visits that were associated with other diseases or injuries, not related to the treatment of migraine. Migraine-specific total costs were the summation of migraine-specific direct costs and indirect costs. All-cause total costs were calculated by summing migraine-specific total costs and non-migraine direct costs. Costs were adjusted to 2013 US dollars using the medical care component of the consumer price indexCitation25.
Analyzing the strength and direction of the correlation between total all-cause costs and measures of comorbidity and HRQoL was an objective to inform model development. The HRQoL/functional status measures included the 12-Item Short-Form Health Survey (SF-12) Health Status Measure, which allowed calculation of the Short Form 6 Dimension health index utility score (SF-6D) and quality-adjusted life years (QALY). The SF-12, a validated survey instrument, has two validated sub-scales for physical and mental health status, namely, the mental composite summary (MCS) and physical composite summary (PCS). The MCS and PCS scores are normalized to a mean score of 50, and scores below 50 represent below-average mental or physical health status, respectively. The SF-6D is a sub-set of questions from the SF-12 measure and provides an estimated utility index measure for health using general population values (1.0 indicates perfect health and 0.0 indicates death)Citation26. QALY was estimated by multiplying the SF-6D utility index score by life expectancyCitation27. Measures of comorbidity burden utilized the Fleishman score which identifies the chronic conditions and is specific to the presence of 10 high-prevalence chronic conditions (scores range from 0–10)Citation24. Higher scores indicate a higher number of select comorbid conditions.
Statistical methods
All analyses utilized the primary sampling clusters, strata, and sampling weights of the complex survey design in MEPS to represent a national US population. Descriptive analyses included reporting the weighted mean and its 95% confidence interval (95% CI) or mean and standard error (SE) for each group for continuous variables. For categorical measures, the weighted percentages (%) for each group were reported. Bivariate tests of the three primary groups of interest utilized one-way ANOVA (for continuous variables) by PROC SURVEYREG and Chi-square tests (for categorical variables) by PROC SURVEYREG. The results of bivariate tests were considered statistically significant for p < 0.05.
Correlation analyses between migraine-specific total costs, and measures of comorbidity burden and patient-functioning were conducted to better understand the strength and direction of associations, and the resulting Pearson correlation coefficient was reported. Two multivariable logistic regression models were developed to identify statistically significant predictive covariates for categorization into cost sub-groups: (i) high-cost vs medium-cost sub-group and (ii) medium-cost vs low-cost sub-group. Potential factors in multivariable logistic regression included age, gender, family income, race/ethnicity, education, region, survey year, insurance status, employment status, Fleishman scores, MCS and PCS scores, SF-6D, and treated migraine status. Two models were developed to address the primary research hypothesis that the higher cost sub-group had different predictors than the medium cost sub-group, which had different predictors than the low cost sub-group, in essence that the cost sub-groups were unique. Models selections were applied based on bivariate analyses in two cost sub-groups and clinical judgement. The statistically significant variables from bivariate analyses and clinically meaningful variables were included as predictors in the logistic regression models. The C-statistics from two multivariate logistic regression models were reported to indicate logistic regression model predictive accuracy. Odds ratios and their 95% CIs resulted from these analyses. All analyses were conducted using SAS version 9.3 (SAS Institute Inc., Cary, NC) and its survey procedures.
Results
Patient disposition and demographics
In total, 1,745 patients (unweighted sample) were included in the study after applying inclusion and exclusion criteria. This included the following number of patients (unweighted sample) for the three sub-groups: low: 190, medium: 1,360, and high: 195. The majority of patients were females (79.8%) and non-Hispanic white (76.5%), and the mean age was 39.0 years (). Statistically significant differences among low-, medium-, and high-cost sub-groups were observed for the following characteristics: age, race, mean family total income, mean HRQoL scores (SF-12 PCS, SF-12 MCS, SF-6D health utility index scores, and QALY), Fleishman score, and specific comorbidities. Comorbidities with significant differences across cost sub-groups included anxiety, depression, diabetes, hypertension, sleep disturbance, heart disease, and asthma. Moving from a lower cost to a higher cost sub-group, HRQoL scores decreased significantly, and the Fleishman score and percentage of patients with specific comorbidities increased significantly. Notably, no significant differences across cost sub-groups were noted for gender, region, employment status, or for the proportion of patients with acute medication overuse or preventive use.
Table 1. Sociodemographic and health status of treated migraine cohort (based on cost sub-group [2008–2012 MEPS Population]).
Migraine-specific total costs and healthcare resource utilization
The mean total migraine-specific expenditures among patients in the low-cost sub-group was $14, in the medium-cost sub-group, it was $1,373, and in the high-cost sub group, it was $14,348. All-cause total costs in all three cost sub-groups were substantially higher than migraine-specific total costs (). Mean migraine-specific direct expenditures in the high-cost sub-group were statistically significantly higher than in the medium- or low-cost sub-groups (low: $6, medium: $697, and high: $6282) (p < 0.001) (). Within direct costs, expenditures arising from outpatient visits, office visits, inpatient visits, ER visits, pharmacy prescriptions, and diagnostics were all significantly higher in patients with high- vs medium- or low-costs (). Across all of these direct cost categories, both utilization and associated expenditures increased with each incrementally higher cost sub-group. For example, with the exception of inpatient visits, the mean of all migraine-specific utilizations tripled from medium- to high-cost patients.
Figure 1. Mean all-cause and migraine-specific total costs in the three cost sub-groups of the treated migraine cohort.
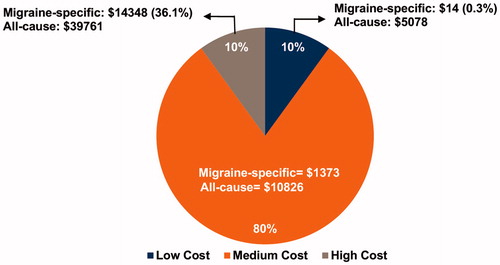
Table 2. All-cause and migraine-specific costs for treated migraine cohort in the three cost sub-groups.
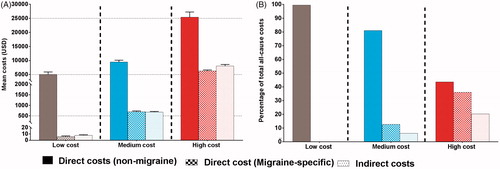
summarizes migraine-specific direct costs, non-migraine-specific direct costs, and indirect costs in low-, medium-, and high-cost sub-groups (). In patients with low-costs, migraine-specific direct costs and indirect costs were negligible (<$10). Non-migraine-specific direct cost constituted the largest percentage of total all-cause costs in all three patient sub-groups (). The share of migraine-specific direct costs to total all-cause costs increased from 0.1% in the low-cost sub-group to 6.4% and 15.8% in the medium- and high-cost sub-groups, respectively. This trend was also observed for the share of indirect costs to total all-cause costs, which increased from 0.2% in the low-cost sub-group to 6.2% and 20.3% in the medium- and high-cost sub-groups, respectively ().
Figure 2. Direct and indirect costs for the treated migraine cohort by cost sub-group. Results are mean ± SE of costs (A) and a percentage of total all-cause costs (B).
Predictors of costs
A significant negative correlation was observed for migraine-specific total costs with SF-12 MCS (r = −0.25), SF-12 PCS (r = −0.40), SF-6D (r = −0.36), and QALY (r = −0.28) (p < 0.001), indicating that higher costs are associated with lower HRQoL scores. A significant positive correlation was observed for migraine-specific total costs with the Fleishman score (r = 0.31) (p < 0.001) (), indicating that higher costs are associated with a higher number of chronic conditions. Similarly, a significantly negative correlation was observed for migraine-specific direct costs and indirect costs with SF-12 PCS, SF-6D, and QALY (p < 0.001), while a significant positive correlation was observed with the Fleishman score (r = 0.06) (p < 0.01). A moderate correlation was observed between migraine-specific total costs and indirect costs with HRQoL scores, while a weak correlation was observed between migraine-specific direct costs and HRQoL scores (). Similarly, a moderate correlation was observed between migraine-specific total costs and indirect costs with comorbidity measures, while a weak correlation was observed between migraine-specific direct costs and comorbidity measures.
Table 3. Correlation between costs, and measures of patient functioning and comorbidities.
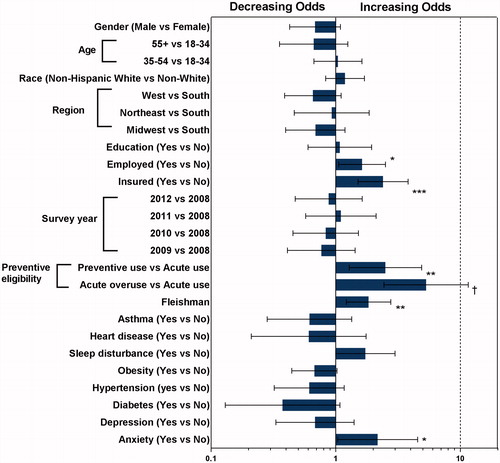
and illustrate results from the analysis using the logistic regression model to identify predictors of being in high-cost vs medium-cost category, and in medium-cost vs low-cost category. Significant predictors of being in the high-cost vs medium-cost category were: (i) lower scores in the SF-12 PCS domain (OR = 0.945; 95% CI = 0.921–0.970), (ii) lower SF-6D scores (OR = 0.019; 95% CI = 0.002–0.193), (iii) living in the West US vs South US (OR = 1.773; 95% CI = 1.014–3.103), (iv) preventive eligibility per prior preventive medication use vs preventive non-eligible (OR = 8.484; 95% CI = 5.270–13.657), and (v) preventive eligibility per acute medication use vs preventive non-eligible (OR = 3.098; 95% CI = 1.624–5.911). For being in the medium-cost category vs low-cost category, significant predictors were: (i) anxiety (OR = 2.170; 95% CI = 1.037–4.543), (ii) Fleishman score (OR = 1.835; 95% CI = 1.219–2.764), (iii) preventive eligibility per prior preventive medication use vs preventive non-eligible (OR = 2.505; 95% CI = 1.283–4.890), and (iv) preventive eligibility per acute medication use vs preventive non-eligible (OR = 5.311; 95% CI = 2.439–11.568). C-statistics from logistic regression models for high-costs vs medium-costs and medium-costs vs low-costs were 0.86 and 0.74, respectively; this indicates that the two logistic regression models fit data well and have high predicted probability.
Figure 3. Logistic regression model predictive of cost (high- vs medium-costs). † p < 0.0001; ***p < 0.001; **p < 0.01; *p < 0.05 for comparisons of high- vs medium-costs. Abbreviations. PCS, physical composite score; SF-6D, short-form six-dimension.
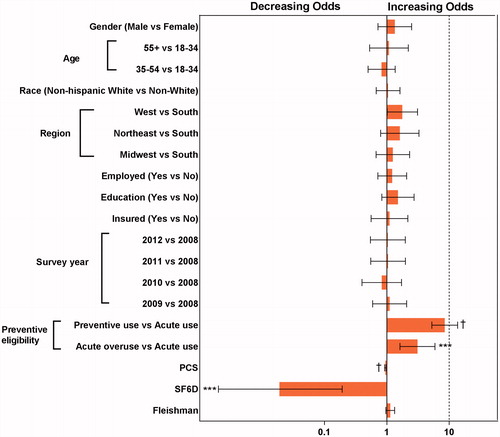
Figure 4. Logistic regression model predictive of cost (medium- vs low-costs). †p < 0.0001; ***p < 0.001; **p < 0.01; *p < 0.05 for comparisons of medium- vs low-costs.
Discussion
The current study findings suggest that the treated migraine cohort with high disease-specific total costs is a significantly different sub-population than people with medium migraine-specific total costs with respect to several clinical characteristics. Among patients treated for migraine, distinct characteristics that are predictive of being in the high vs the medium migraine-specific cost sub-group included lower utility index scores per the SF-6D and lower physical functioning per the PCS. For the medium vs low migraine-specific cost sub-group, distinct characteristics included a higher cumulative number of comorbidities and anxiety. Consistent predictors of higher costs included preventive eligibility per current or past use of migraine preventives, and preventive eligibility per acute medication overuse.
Among patients with migraine, comorbidity burden and diagnoses with chronic migraine are recognized as strong contributors to direct and indirect costsCitation4,Citation14,Citation19. In this study, when comparing the high- vs medium-cost sub-groups, lower scores in physical aspects of overall functioning or health utility were associated with higher migraine-specific total costs. For average physical health, PCS is 50 and for perfect health, SF-6D health utility measure is 1Citation26. The mean SF-12 PCS was notably lower for the high-cost sub-group (37.3) compared to scores for the low- (50.5) and medium-cost (49.5) sub-groups, respectively. However, the SF-6D health utility measure did reflect more gradient levels of health among the three sub-groups, with a mean score of 0.6 for the high-cost, 0.7 for the medium-cost, and 0.8 for the low-cost sub-groups. An important finding was the moderate correlation of migraine-specific costs (total, direct, and indirect) with measures of HRQoL (SF-12 MCS and PCS, SF-6D, and QALY); this correlation was the strongest for total and indirect costs with HRQoL measures. A unique finding is that HRQoL scores are moderately correlated with migraine-specific direct costs, whereas comorbidities are weakly correlated. When evaluating measures of comorbidity burden and patient functioning, the strongest correlation was seen for total, direct, or indirect migraine-specific costs with the Physical Component Score of SF-12. However, comorbidities among the low-, medium-, and high-cost sub-groups reflected gradient levels of burden, including for the Fleishman score (0.9, 1.3, 2.5), anxiety (6.9%, 22.7%, 41.4%), depression (15.5, 25.3%, 49.4%), hypertension (18.2%, 21.6%, 35.2%), and sleep disorders (10.9%, 20.4%, 44.8%), respectively. Chronic pain or specific pain conditions, such as fibromyalgia, were not pre-specified for inclusion in the models. However, pain conditions are important given the association with migraine, acute medication use, and health-related quality-of-life; and should be specifically addressed in future researchCitation10. In summary, even though comorbidities were more common for the high-cost sub-group, measures of functional health served as stronger predictors of cost, whereas comorbidities remained a strong cost predictor for medium- vs low-costs, both for total comorbidity burden and anxiety.
Preventive and acute medication treatment served as consistent predictors of migraine-specific total costs. The overuse of acute medications to treat migraine headache attacks has recently emerged as an additional risk factor for costsCitation28,Citation29. In the current study, preventive eligibility per prior preventive use and preventive eligibility per acute medication overuse were significant predictors for being in the high- vs medium-cost sub-groups and for being in the medium- vs low-cost sub-groups. Within the high-cost sub-group, 56.5% of patients had past or current use of a preventive, and more than 20% overused acute medications; however, the medium-cost group had lower and near equal distributions (18.5% and 16.7%, respectively), and neither was as common in the low-cost group (7.9% and 3.5%, respectively).
These results are important given that preventive treatment and other interventions that reduce acute medication overuse and improve patients’ ability to function may reduce migraine-specific costs. In addition, HRQoL measures, comorbidity-burden, and treatment use may also serve as predictors of the total cost burden when headache frequency is unknown or unavailable in an existing healthcare databaseCitation30,Citation31.
In this study of a treated migraine cohort, of the total all-cause costs, indirect costs and migraine-specific direct costs accounted for 0.3%, 12.7%, and 36.1% in the low-, medium- and high-cost sub-groups, respectively. The majority of expenditures were due to direct costs, specifically those associated with pharmacy utilization and office visits. In the International Burden of Migraine Study (IBMS), direct medical costs accounted for the majority of total headache-related costs in patients with chronic migraine (60.0%, $4,943 of $8,243) and episodic migraine (64.3%, $1,705 of $2,649)Citation3. Notable differences between our study and the IBMS include analyses of migraine-specific costs vs headache-related costs, and distinguishing groups by cost categories vs based on episodic or chronic migraine status. In our study, the high-cost group is likely to reflect a population with a high frequency of migraine attacks. In this cost sub-group, there was a slightly lower proportion of migraine-specific direct costs to total migraine-specific total costs (43.7%, $6,282 of $14,348) compared to patients with chronic migraine in IBMS.
Recent estimates indicate that the total of annual direct and annual indirect costs in patients with migraine and without migraine are $11,010 and $4,436, respectively. These estimates are similar to those obtained for all-cause total costs in the medium-cost sub-group ($10,826) and low-cost sub-group ($5, 078) in this study. Unlike other studies, this research was designed to better understand the high-cost sub-group of a treated migraine cohort, whose total cost expenditures were much higher at $39,761. A study by Stockbridge et al.Citation17 using the MEPS database to estimate average incremental healthcare expenditures associated with chronic pain showed that “a little bit” of chronic pain-related interference is associated with a $2,498 increase in total adjusted expenditures over no pain interference (p < 0.0001) and a $1,008 increase over non-chronic pain interference (p = 0.0001). The current study did not address measures of pain interference; however, it did find lower scores in physical aspects of overall functioning to be a significant predictor of being in the higher cost sub-group. Similar to this research, other studiesCitation16 suggested that increased acute medication use was associated with higher all-cause healthcare costs for patients with migraine.
Strengths and limitations
The strengths of this study include using the MEPS data source, which uses a complex sampling design to be representative of the US population. Robust methods were used to identify any unique clinical characteristics associated with higher cost sub-groups, and multiple elements of cost were evaluated, that is, total all-cause, disease-specific, direct, and indirect costs.
There are limitations in this study that need to be considered when interpreting the results. The overall economic burden is under-estimated because the costs associated with over-the-counter (OTC) medications are not accounted for in MEPSCitation32. Results are not representative of the undiagnosed or untreated migraine population, and are limited to a population with medical events and treatments coded for migraineCitation33. The data source was specific to the US and may not be generalizable to other countries. Variables of interest were limited by the data source, migraine headache severity was unknown, frequency or chronic migraine status was not reported (only three digits of the ICD-9-CM diagnosis are available in MEPS), disease-specific indirect costs are not captured, and the criteria for preventive eligibility per acute medication use was limited by the panel survey intervals. Patients identified as prevention eligible per acute medication use were conservative in nature and were most likely under-representative of all patients who would be considered for preventive treatmentCitation21. Limited condition-specific comorbidities were explored due to the nature of how diseases are captured; specifically, defining chronic pain conditions would require use of the ICD-9 codes at the 3-digit level, which does not have the specificity needed to only capture pain-related diseases. However, the SF-12 score does include an item that measures the degree that pain (any pain condition) impairs functioning in the past 4 weeks. Survey data is collected in a repeated cross-sectional manner that may introduce reporting biases or errors. Temporality of events was not evaluated, and variables were limited to a 2-year period.
Value of finding for practitioners/patients/society
Both the overuse of acute medications and preventive treatments were predictors of higher total costs. The utilization of safe, tolerable, and effective preventive treatments that reduce acute medication use and improve patients’ functioning may reduce migraine-specific direct and indirect costs. Therefore, it is important for clinicians to identify effective preventive treatments, in preventive eligible patients, that adequately treat the disease without increasing other categories of healthcare resource utilization. It is unclear whether novel treatments for migraine will decrease the comorbidity burden associated with migraine; however, if the number of comorbid conditions and the burden of anxiety associated with this painful neurological condition could be reduced, this could provide another avenue for cost reductions. Overall, this study has contributed to the understanding and identification of unique clinical characteristics for high-costs among patients with migraine, which may inform future targeted interventions.
Transparency
Declaration of funding
This study was sponsored by Eli Lilly and Company, Indianapolis, IN, USA.
Declaration of financial/other interests
JF, WY, RMN, SAF, and DN are employees of Eli Lilly and Company, Indianapolis, IN, USA, and hold company stock. JME peer reviewers on this manuscript have no relevant financial or other relationships to disclose.
Acknowledgements
Sreelatha Akkala and Sriram Govindan, employees of Eli Lilly Services India Private Limited, Bengaluru, India, provided writing assistance. Allen Nyhuis, an employee of Eli Lilly and Company at the time of analysis, provided statistical support.
References
- Raval AD, Shah A. National trends in direct health care expenditures among US adults with migraine: 2004 to 2013. J Pain. 2017;18:96–107.
- Burch RC, Loder S, Loder E, et al. The prevalence and burden of migraine and severe headache in the United States: updated statistics from government health surveillance studies. Headache. 2015;55:21–34.
- Messali A, Sanderson JC, Blumenfeld AM, et al. Direct and indirect costs of chronic and episodic migraine in the United States: a web-based survey. Headache. 2016;56:306–322.
- Headache Classification Committee of the International Headache Society. The International Classification of Headache Disorders, 3rd edition (beta version). Cephalalgia. 2013;33:629–808.
- Abu Bakar N, Tanprawate S, Lambru G, et al. Quality of life in primary headache disorders: a review. Cephalalgia. 2016;36:67–91.
- Lipton RB, Bigal ME, Diamond M, et al. Migraine prevalence, disease burden, and the need for preventive therapy. Neurology. 2007;68:343–349.
- Diener HC, Solbach K, Holle D, et al. Integrated care for chronic migraine patients: epidemiology, burden, diagnosis and treatment options. Clin Med (Lond). 2015;15:344–350.
- Merikangas KR. Contributions of epidemiology to our understanding of migraine. Headache. 2013;53:230–246.
- Schwedt TJ. Chronic migraine. BMJ. 2014;348:g1416.
- Giamberardino MA, Affaitati G, Martelletti P, et al. Impact of migraine on fibromyalgia symptoms. J Headache Pain. 2015;17:28.
- Wang SJ, Chen PK, Fuh JL. Comorbidities of migraine. Front Neurol. 2010;1:16.
- Buse DC, Manack AN, Fanning KM, et al. Chronic migraine prevalence, disability, and sociodemographic factors: results from the American Migraine Prevalence and Prevention Study. Headache. 2012;52:1456–1470.
- Smitherman TA, Burch R, Sheikh H, et al. The prevalence, impact, and treatment of migraine and severe headaches in the United States: a review of statistics from national surveillance studies. Headache. 2013;53:427–436.
- Lanteri-Minet M. Economic burden and costs of chronic migraine. Curr Pain Headache Rep. 2014;18:385.
- Ford JH, Jackson J, Milligan G, et al. A real-world analysis of migraine: a cross-sectional study of disease burden and treatment patterns. Headache. 2017;57:1532–1544.
- Bonafede M, Cai Q, Cappell K, et al. Factors associated with direct health care costs among patients with migraine. J Manag Care Spec Pharm. 2017;23:1169–1176.
- Stockbridge EL, Suzuki S, Pagan JA. Chronic pain and health care spending: an analysis of longitudinal data from the Medical Expenditure Panel Survey. Health Serv Res. 2015;50:847–870.
- MEPS-HC Panel Design and Collection Process, Agency for Healthcare Research and Quality, Rockville, Md. [cited 2018 Jun 13]. Available from: https://meps.ahrq.gov/mepsweb/survey_comp/hc_data_collection.jsp
- Bigal ME, Lipton RB. Excessive acute migraine medication use and migraine progression. Neurology. 2008;71:1821–1828.
- Silberstein SD, Olesen J, Bousser MG, et al. The International Classification of Headache Disorders, 2nd Edition (ICHD-II)-revision of criteria for 8.2 Medication-overuse headache. Cephalalgia. 2005;25:460–465.
- American Headache Society. The American Headache Society position statement on integrating new migraine treatments into clinical practice. Headache. 2019;59:1–18.
- Silberstein SD. Preventive migraine treatment. Continuum. 2015;21:973–989.
- Farley JF, Harley CR, Devine JW. A comparison of comorbidity measurements to predict healthcare expenditures. Am J Manag Care. 2006;12:110–119.
- Fleishman JA, Cohen JW. Using information on clinical conditions to predict high-cost patients. Health Serv Res. 2010;45:532–552.
- United States Department of Labor. Consumer Price Index. 2014 [cited 2018 Sep 21]. Available from: https://www.bls.gov/cpi/factsheets/medical-care.htm
- Brazier JE, Roberts J. The estimation of a preference-based measure of health from the SF-12. Med Care. 2004;42:851–859.
- National Vital Statistics Report. United States Life Tables. 2017. [cited 2018 Oct 21]. Available from: https://www.cdc.gov/nchs/data/nvsr/nvsr66/nvsr66_03.pdf
- Janet HF, Schroeder K, Nyhius AW, et al. Cycling through migraine preventive treatments: implications for all-cause total direct costs and disease-specific costs. J Manag Care Spec Pharm. 2019;25(1):46–59.
- Shah AM, Bendtsen L, Zeeberg P, et al. Reduction of medication costs after detoxification for medication-overuse headache. Headache. 2013;53:665–672.
- Lipton RB, Serrano D, Nicholson RA, et al. Impact of NSAID and Triptan use on developing chronic migraine: results from the American Migraine Prevalence and Prevention (AMPP) study. Headache. 2013;53:1548–1563.
- Blumenfeld AM, Bloudek LM, Becker WJ, et al. Patterns of use and reasons for discontinuation of prophylactic medications for episodic migraine and chronic migraine: results from the Second International Burden of Migraine Study (IBMS-II). Headache. 2013;53:644–655.
- Lipton RB, Diamond S, Reed M, et al. Migraine diagnosis and treatment: results from the American Migraine Study II. Headache. 2001;41:638–645.
- Hazard E, Munakata J, Bigal ME, et al. The burden of migraine in the United States: current and emerging perspectives on disease management and economic analysis. Value Health. 2009;12:55–64.