
Abstract
Aims: To evaluate the cost differences between a treatment strategy including tofacitinib (TOFA) vs treatment strategies including adalimumab (ADA), golimumab (GOL), infliximab (IFX), and vedolizumab (VEDO) among all patients with moderate-to-severe ulcerative colitis (UC) (further stratified by patients naïve/exposed to tumor necrosis factor inhibitors [TNFis]).
Materials and methods: An Excel-based decision-analytic model was developed to evaluate costs from the perspective of a third-party US payer over 2 years. Efficacy and safety parameters were taken from prescribing information and published trials. All patients started induction therapy on the first treatment in the strategy and continued if efficacy criteria were met and no major adverse event occurred (in which cases they proceeded to the next treatment in the strategy).
Results: The cost per member per month (PMPM) of the TOFA–>IFX–>VEDO–>GOL strategy ($1.11) was lower than that of the ADA–>IFX–>VEDO–>GOL strategy ($1.34; Δ = $−0.23) among the TNFi-naïve population (n = 204 patients out of a plan of one million members). Similarly, the use of TOFA before ADA (i.e. TOFA–>ADA–>IFX–> VEDO) was also associated with lower PMPM costs than the use of ADA before TOFA (i.e. ADA–>TOFA–>IFX–>VEDO): $1.15 vs $1.25 (Δ = $−0.10). Similar, and often larger, differences were observed in both the overall moderate-to-severe population and the TNFi-exposed population. Sensitivity analyses resulted in the same conclusions.
Limitations: Our model relied on efficacy data from prescribing information and published trials, which were not head-to-head and slightly differed with respect to methods. Additionally, our model used representative minor and major ADRs (and the associated costs) to represent toxicity management, which was a simplifying assumption.
Conclusions: This analysis, the first of its kind to evaluate TOFA vis-à-vis other advanced therapies in the US, suggests the early use of TOFA among both TNFi-naïve and TNFi-failure patients results in lower PMPM costs compared with other treatment alternatives.
Introduction
Ulcerative colitis (UC) is an inflammatory disease of the colon that is characterized by intermittent periods of disease flaring and remissionCitation1,Citation2. Although the primary clinical symptom is the presence of bloody diarrhea, patients can also experience a range of additional symptoms, including rectal bleeding, tenesmus (a continual or recurrent need to evacuate the bowels), urgency (feeling of immediate necessity to evacuate the bowels), abdominal pain, and fatigueCitation2–5.
UC affects ∼900,000 people in the USCitation6. Prior research has suggested it is associated with a substantial economic burden on the healthcare system, totaling between $8 and $15 billion annually in the USCitation7. A study by Null et al.Citation8 found that patients initiating either adalimumab or infliximab incurred an average of $42,000 in direct costs per patient in the first 12 months, with $14,000 alone due to in-patient hospitalizations.
Treatment of UC typically consists of aminosalicylates (5-ASAs), corticosteroids, and/or immunomodulators (e.g. azathioprine, 6-mercaptopurine)Citation4. However, as many as 40% of patients require advanced therapiesCitation9. For such patients, several biologic treatments are available, including the tumor necrosis factor inhibitors (TNFis) infliximab (IFX), adalimumab (ADA), golimumab (GOL), and the anti-integrin vedolizumab (VEDO)Citation4,Citation10. In May 2018, tofacitinib (TOFA), an oral, small molecule Janus kinase inhibitor, was approved by the Food and Drug Administration as an additional option for the treatment of adults with moderately-to-severely active UCCitation11,Citation12.
Given the evolving management options for patients with moderate-to-severe disease, the objective of this study was to compare, from a US payer perspective, the costs of various UC treatment strategies. In particular, this study sought to compare the costs associated with a TOFA-related treatment strategy with treatment strategies which included other approved therapies using a decision analytic model. Our model separately considered the overall moderate-to-severe UC population along with both TNFi-naïve and TNFi-exposed sub-populations to provide a framework for the payer community to evaluate the short-term economic implications of various treatment options.
Methods
Patients
The model focused on evaluating all patients with moderate-to-severe UC as well as those who were TNFi-naïve and those who were TNFi-exposed over a 1-, 2-, or 3-year time period (the base case scenario assumed a 2-year time period, which was set a priori). The number of patients eligible for one of the treatments included in the model was estimated based on the size of the healthcare organization and epidemiological factors associated with the disease. For the base case scenario, a hypothetical health plan with one million members was assumed. Kappelman et al.Citation13 estimated the prevalence rate of UC as 0.24%. A market research analysis was used to estimate, among all patients with UC, the number with diagnosed moderate-to-severe disease who were using advanced therapy (19% of all patients with UC), as well as the split of the TNFi-naïve and TNFi-exposed (45% and 55%, respectively).
Model structure and comparators
The decision-analytic model was constructed in Microsoft Excel (Microsoft, Redmond, WA) with the objective of evaluating the total costs of treating patients with, and the number of patients responding to, TOFA and other advanced therapies approved for the treatment of UC. The model used a decision-tree structure (see ), with nodes representing the probability of adverse drug reactions (ADRs), response after induction, remission after maintenance, and switching treatment. The model allows up to four lines of sequential therapy in the overall moderate-to-severe population and TNFi-naïve sub-population and up to two lines of sequential therapy in the TNFi-exposed sub-population. The treatment strategies for the base case scenario were selected based on common treatment patterns in the US. However, as done in prior economic modelsCitation14, the focus of the comparisons in the base case scenario was between TOFA and the most common self-injectable therapy (i.e. ADA).
Figure 1. Model diagram. For the first base case analysis, Strategy 1 was TOFA ?> IFX ?> VEDO ?> GOL, Strategy 2 was ADA ?> IFX ?> VEDO ?> GOL, Strategy 3 was TOFA ?> ADA ?> IFX ?> VEDO and Strategy 4 was ADA ?> TOFA ?> IFX ?> VEDO. Abbreviations. ADA, adalimumab; ADR, adverse drug reaction; GOL, golimumab; IFX, infliximab; TNFi, tumor necrosis factor inhibitor; SOC, standard of care; TOFA, tofacitinib; UC, ulcerative colitis; VEDO, vedolizumab.
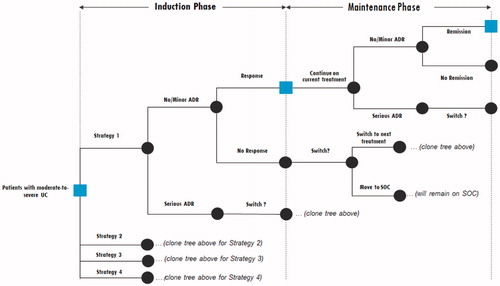
As graphically illustrated in , the model begins with patients starting their induction phase of the first treatment in the strategy (e.g. TOFA in the case of Strategy 1; see ). First, it is determined whether patients experience a serious ADR during induction. If they do, they move to the induction phase of the second treatment in the strategy (e.g. IFX in the case of Strategy 1). If patients do not experience a serious ADR during induction, it is next determined whether they respond to the treatment during induction (i.e. they achieve clinical response). If patients do respond, they continue using this same treatment into maintenance and until the end of Year 1. For patients who do not respond, the vast majority (i.e. 87%) move to the induction phase of the second treatment in the strategy; the remaining 13% discontinue the strategy altogether. This “switch rate” (which has also been used in similar treatment cost models)Citation14 was derived as a pooled estimate of discontinuation rates from the various UC clinical programsCitation11,Citation12,Citation15–23.
Table 1. Treatment strategies evaluated in the analyses.
For the patients described above who respond after induction, they are then evaluated again at the end of Year 1. First, it is determined whether patients experience a serious ADR during maintenance. If they do, they move to the induction phase of the subsequent treatment in the strategy. If patients do not experience a serious ADR during maintenance, it is next determined whether they respond to the treatment. Consistent with the goals of clinical practice in UC, clinical remission (rather than clinical response) is evaluated at the end of Year 1 (maintenance) to determine whether or not a patient continues on this same therapy during Year 2. At the end of Year 2, the same evaluation takes place as with the end of Year 1.
Patients who fail all four treatments (or both treatments in the TNFi-exposed sub-population) within the time horizon are placed on a standard of care regimen, which (for treatment cost purposes) included steroids, azathioprine, and the average treatment cost across TOFA, IFX, ADA, VEDO, and GOL. These patients were considered perpetual non-responders for the purposes of healthcare resource use (discussed below).
Model inputs
Efficacy
Efficacy was defined using clinical response for induction and remission for maintenance and were sourced from the corresponding US product insert (USPI) information and/or published data from the phase 3 programs for each treatment (see )Citation11,Citation12,Citation19,Citation20,Citation24–28. Clinical response was defined by a decrease from the baseline Mayo score of at least 3 points and at least 30%, with an accompanying decrease in the rectal bleeding sub-score of at least 1 point or an absolute rectal bleeding sub-score of 0 or 1Citation11,Citation12,Citation19,Citation20,Citation24–28. Clinical remission was defined by a total Mayo score of 2 points or lower, with no individual sub-score exceeding 1 point (see Supplementary Appendix Table A1)Citation19,Citation20,Citation24–28. However, it should be noted the TOFA clinical program relied upon a more stringent definition of remission which, in addition to the definition of clinical remission, also required a rectal bleeding score of 0, in addition to the other requirementsCitation11,Citation12. These variations in definitions were not accounted for since we relied upon USPI data for all treatments. Although relying upon other sources (e.g. a network meta-analysis) could address some of these limitations, there was no published network meta-analysis study which included all approved treatments and reported maintenance efficacy in both TNFi-naïve and TNFi-exposed subpopulations.
Table 2. Efficacy and safety assumptions used to populate the model.
Although the USPI for TOFA allows for an induction period of up to 16 weeksCitation24, only efficacy from 8 weeks was included in the base case scenario since the induction trials were 8 weeks in duration. Additionally, the USPI allows for either 5 mg twice daily (BID) or 10 mg BID during maintenanceCitation24. We assumed that all TNFi-naïve patients would receive 5 mg BID (and the corresponding efficacy of that dose) and all TNFi-exposed patients would receive 10 mg BID (and the corresponding efficacy of that dose). As discussed below, neither of these assumptions had any bearing on treatment costs, as both doses of TOFA are priced identically and the cost per day during induction and maintenance are the same.
Safety
The risk of an ADR was considered during each induction and maintenance period. The model classified ADRs as either minor or major. For model simplicity, and to allow for direct comparisons across treatments, a single representative ADR was chosen for each category. An upper respiratory tract infection (URTI) was selected to represent the minor ADR category given its frequency, consistent reporting across trials, and prior use in similar economic modelsCitation14. For the same reasons, serious infections were selected to represent the major ADR category. Rates for these two events for each treatment were obtained from the USPIs and/or clinical trial publications (see )Citation11,Citation12,Citation24–28. The time period of their assessment in the USPIs/clinical trials matched that of the model (i.e. USPI/clinical trial ADR rates were reported for both induction and maintenance periods).
Healthcare resource use
The model considered direct medical costs in the form of outpatient visits, hospitalizations, emergency room visits, endoscopies, and drug-related monitoring. Aside from drug-related monitoring, resource use events were calculated based on the patient’s remission status during maintenance. In other words, patients who were not in remission had more healthcare resource use events than patients who were in remission. These estimates were derived from several real-world data studiesCitation4,Citation7,Citation29,Citation30. Unfortunately, these articles only reported healthcare resource use by response status (not remission status), so we applied non-responder healthcare resource use data to non-remitters and responder healthcare resource use data to remitters. This would likely over-estimate the resource use for both groups, though sensitivity analyses were carried out to vary the contribution of healthcare resource use on the overall results.
Drug-related monitoring was independent of response and remission status, and was calculated using the USPI and/or published guidelinesCitation24–28,Citation31.
Costs
Drug costs were calculated based on wholesale acquisition costs (WAC), as reported in Analysource as of July 7, 2018 (see Supplementary Appendix Table A2)Citation32. The analysis assumed a semiannual WAC price increase of 6.9% over the 2-year time horizon, which has been used in prior modelsCitation14. To calculate total drug costs, WAC was applied to the USPI dosing for each treatment, with the following two exceptions.
First, dose escalation was assumed to occur for ADA and IFX based on therapeutic drug monitoring guidelines and the availability of real-world data documenting the frequency of this phenomenonCitation31,Citation33. Specifically, based on a recent real-world data study, it was assumed that 13% and 29% of patients using ADA and IFX, respectively, used double the dose of those products during maintenanceCitation33.
Second, the USPI for TOFA allows for an induction period of up to 16 weeks and allows for either 5 mg BID or 10 mg BID to be used during maintenanceCitation24; however (as noted above), we assumed an 8 week induction period and assumed that only TNFi-exposed patients would use 10 mg BID in maintenance. These slight restrictions relative to the USPI have no bearing on drug costs, as both dosages of TOFA are priced equally and there is no difference in daily costs between induction and maintenance.
It is worth noting that the model factored in the duration of multiple induction periods if patients did not respond to their first therapy. This was done to avoid any double-counting of drug costs. For example, if a patient responded to their first therapy after 8 weeks of induction and proceeded to maintenance, they would incur 44 weeks of maintenance drug costs in Year 1 (as 8 weeks + 44 weeks = 52 weeks). On the other hand, if a patient failed their first therapy after 8 weeks of induction, responded to their second therapy after 8 weeks of induction, and proceeded to maintenance with this second therapy, they would incur only 36 weeks of maintenance costs in Year 1 (as 8 weeks + 8 weeks + 36 weeks = 52 weeks). In other words, the model kept track of the various induction periods (and their length) to ensure the induction plus maintenance period would total a full year. However, the model also followed the relevant dosing schedule when totaling drug costs. If a patient received an infusion of IFX at Week 50, no further treatment costs would be incurred for Year 1, as their next administration would not occur until Year 2.
All other costs were based on the 2017 Physician’s Fee and Coding Guide, which were the most recently available at the time of this studyCitation34. Drug-related administration costs were included for infusion treatments based on hourly rates (see Supplementary Appendix Table A2). For subcutaneously injected treatments, it was assumed based on clinician interviews that 90% of patients self-injected at home (which incurred only a one-time nurse training fee), and the remaining 10% received their treatment in a clinic setting (which incurred an administration fee each time). Unit costs for healthcare resource use (i.e. outpatient visits, hospitalizations, emergency room visits, endoscopies, and drug-related monitoring) were obtained through the Physician’s Fee and Coding Guide (see Supplementary Appendix Table A2)Citation34. Costs for a minor ADR (i.e. URTI) were calculated based on the assumption that it would equate to a 7-day course of amoxicillin and one primary care provider visit ($146). Costs for a major ADR (i.e. serious infection) were calculated based on the assumption that it would equate to the treatment of an episode of pneumonia in a US hospital plus two follow-up visits ($9,158). Similar assumptions have been used previouslyCitation14.
Model analyses
Total costs were estimated for each of the treatment strategies over a 2-year time horizon. The primary outcome of the model was the cost per member per month (PMPM). Additional outcomes were the total number of remitters and the cost per remitter. The base case scenario examined treatment strategies in the TNFi-naïve population, although additional analyses were also conducted in the overall moderate-to-severe and TNFi-exposed populations.
A series of sensitivity analyses were also conducted to assess the robustness of the comparisons. First, because the efficacy rates were generally high for TOFA we introduced uncertainty into these parameters. Specifically, we re-ran analyses with both induction and maintenance efficacy rates, which were 10% and 20% higher and lower than the base case assumption. Since we used a characteristic minor/major ADR to estimate rates and costs, we also varied this for TOFA to see the impact on the model conclusions. We set the incidence of both minor and major ADRs for TOFA to 300% of their default values (i.e. tripled the rates) and also set the incidence of both minor and major ADRs of TOFA to be 10% higher than the highest reported rate for any other treatment (i.e. 35.2% and 7.7%, respectively). Because healthcare resource use events can be quite variable, we introduced uncertainty by varying the unit costs to be 50% and 200% of their default values. Finally, we removed the assumption of dose escalation (i.e. only the USPI dosing was incorporated) and also used the 16 week induction efficacy for TOFA.
Results
Base case analysis: TNFi-naïve
The base case analyses evaluated the treatment costs of different treatment strategies in the TNFi-naïve sub-population over a 2-year period. There were two primary comparisons: (1) the comparison of a TOFA strategy vs an ADA strategy (i.e. TOFA –> IFX –> VEDO –> GOL vs ADA –> IFX –> VEDO –> GOL; see Comparison 1 in ), and (2) the comparison of a TOFA 1st line strategy vs. a TOFA 2nd line strategy (i.e. TOFA –> ADA –> IFX –> VEDO vs ADA –> TOFA –> IFX –> VEDO; see Comparison 2 in ). With a health plan size of 1 million members and applying our epidemiological assumptions discussed above, 204 TNFi-naïve patients entered the model.
At the end of the time horizon, the TOFA strategy (Strategy 1) was associated with lower costs PMPM compared with the ADA strategy (Strategy 2) ($1.11 vs $1.34, Δ = −$0.23; see ). Costs were lower across each category (treatment, administration, medical resource use, and toxicity) for the TOFA strategy. This was most apparent with treatment costs, which was the primary contributor to total costs. Based on our efficacy assumptions, our model estimated that 28 more patients (out of 204) would be in remission with the TOFA strategy than with the ADA strategy (number needed to treat [NNT] = 7) after 2 years, with a total costs per remitter being substantially lower ($189,920 vs $378,491).
Table 3. Cost-related outcomes for each treatment strategy based on a hypothetical 1 million member plan.
For the second comparison, the TOFA 1st line strategy was associated with a lower cost PMPM compared with a TOFA 2nd line strategy ($1.15 vs $1.25, Δ = −$0.10; see ). Again, the costs were lower in all categories, although the differences were most pronounced in terms of treatment costs. A TOFA 1st line strategy was also associated with an additional six patients in remission (NNT = 36) and a lower cost per remitter ($212,979 vs $253,337) compared with the TOFA 2nd line strategy.
Overall moderate-to-severe and TNFi-exposed populations
The same treatment strategies and comparisons conducted in the TNFi-naïve sub-population were also evaluated in the overall moderate-to-severe population. Applying the epidemiological assumptions discussed above, 452 patients entered the model (45% were TNFi-naïve and 55% were TNFi-exposed). As with the TNFi-naïve sub-population, a TOFA strategy was associated with lower PMPM costs than with the ADA strategy ($2.50 vs $2.98, Δ = −$0.48), and a TOFA 1st-line strategy was associated with lower PMPM costs than with a TOFA 2nd-line strategy ($2.60 vs $2.77, Δ = −$0.17) (see ).
Among the TNFi-exposed population, we compared a TOFA strategy to an ADA strategy (TOFA –> VEDO vs ADA –> VEDO; Comparison 1) and we compared a TOFA strategy to a VEDO strategy (TOFA –> IFX vs VEDO –> IFX; Comparison 2). A total of 249 TNFi-exposed patients entered the model. The TOFA –> VEDO strategy was associated with lower PMPM costs compared with the ADA –> VEDO strategy ($1.39 vs $1.61; Δ = −$0.22). Similarly, the TOFA –> IFX strategy was associated with lower PMPM costs than the VEDO –> IFX strategy ($1.34 vs $1.54; Δ = −$0.21).
Sensitivity analyses
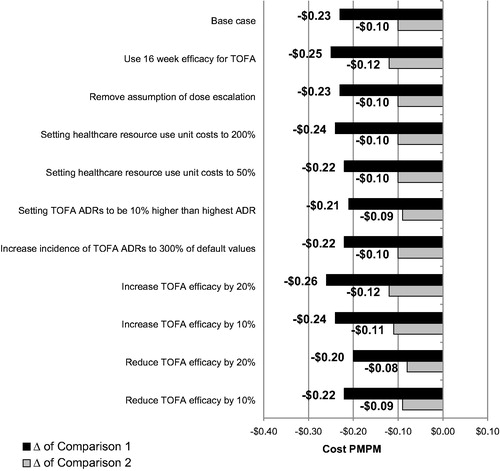
Finally, we explored the extent to which variations in our core assumptions would influence the conclusions of our base case analyses. As mentioned in our methods section, we varied the efficacy and safety rates associated with TOFA, healthcare resource utilization costs, and the presence/absence of dose escalation. The PMPM costs for each of these sensitivity analyses are shown alongside the base case in . The results of the sensitivity analyses were similar to that of the base case analysis. The differences between the TOFA and ADA strategies (which was −$0.23 in the base case) varied from −$0.20 to −$0.26, and the differences between TOFA 1st line and TOFA 2nd line (which was −$0.10 in the base case) varied from −$0.08 to −$0.12 across sensitivity analyses. The same exercise was carried out for the overall moderate-to-severe population and the TNFi-exposed sub-population, with similar findings.
Figure 2. Sensitivity analyses associated with the TNFi-naïve base case scenario results. Note the difference of Comparison 1 refers to the cost PMPM of Strategy 1 (TOFA → IFX → VEDO → GOL) minus the cost PMPM of Strategy 2 (ADA → IFX → VEDO → GOL). The difference of Comparison 2 refers to the cost PMPM of Strategy 3 (TOFA → ADA → IFX → VEDO) minus the cost PMPM of Strategy 4 (ADA → TOFA → IFX → VEDO). Abbreviations. ADA, adalimumab; GOL, golimumab; IFX, infliximab; PMPM, per member per month; TNFi, tumor necrosis factor inhibitor; TOFA, tofacitinib; VEDO, vedolizumab.
An additional sensitivity analysis was performed to include efficacy sourced from a network meta-analysis rather than the USPIs. As described above, we used the USPI data as our primary source of efficacy because results are available for both TNFi-naïve and TNFi-exposed sub-populations. However, a key limitation is that the USPI results do not account for differences in trial design or varying placebo rates across trials. Network meta-analyses are able to make such adjustmentsCitation35. Although two network meta-analyses have been published which include all the treatments in our economic modelCitation36,Citation37, neither was able to provide efficacy estimates stratified by sub-population. Instead, we relied upon a recently presented network meta-analysis which did provide this informationCitation38.
Using the efficacy estimates from this network meta-analysis in place of the USPI estimates, the results of our economic model were nearly identical to the main analysis. Among the TNFi-naïve and overall population, the TOFA strategy was associated with lower costs PMPM compared with the ADA strategy (TNFi-naïve: $1.11 vs $1.33, Δ = −$0.22; overall: $2.47 vs $2.95, Δ = −$0.48) and the TOFA 1st line strategy was associated with a lower cost PMPM compared with a TOFA 2nd line strategy (TNFi-naïve: $1.15 vs $1.25, Δ = −$0.10; overall: $1.30 vs $1.52; Δ = −$0.22).
Among the TNFi-exposed sub-population, the TOFA –> VEDO strategy was associated with lower PMPM costs compared with the ADA –> VEDO strategy ($1.37 vs $1.60; Δ = −$0.23) and the TOFA –> IFX strategy was associated with lower PMPM costs than the VEDO –> IFX strategy ($1.30 vs $1.52; Δ = −$0.22).
A final post-hoc sensitivity analysis included the incorporation of an IFX biosimilar rather than the IFX originator in treatment strategies which contained IFX. We assumed the efficacy and safety profile would be identical between the biosimilar and originator versions of IFX, and the only difference would be the drug cost (sourced from AnalysourceCitation32). Although all strategies reduced their PMPM totals when using the an IFX biosimilar, the revised totals were minimal ($0.02–$0.08), and the differences between strategies largely remained unchanged (from a $0.02 decrease in the size of the difference to a $0.01 increase).
Discussion
Although real-world comparative data is needed to inform the economic consequences of various UC treatment usage, such data can take significant time to accumulate. To facilitate near-term decision-making within the payer community, our model was developed to examine the short-term cost implications of different UC treatment strategies. Our results suggest that, among patients naïve to TNFi therapy, initiating TOFA as the first advanced therapy would result in reduced costs compared with initiating ADA as the first advanced therapy. Similarly, initiating TOFA first followed by ADA in this population would result in cost savings relative to initiating ADA first followed by TOFA. Results generated for other populations (the overall moderate-to-severe population and the TNFi-exposed sub-population) were also similar, in that TOFA strategies had lower costs than non-TOFA strategies, and that TOFA 1st-line strategies had lower costs than TOFA 2nd-line strategies.
The benefit to TOFA in both comparisons was primarily attributed to lower treatment costs, although savings in other categories were also observed: administration costs (since TOFA is oral and does not incur such costs), toxicity costs (due to generally lower rates of minor and major ADR rates for TOFA), and healthcare resource use costs (due to generally higher remission rates for TOFA, which causes patients to be in a lower-cost-incurring remission state compared with the higher-cost-incurring non-remission state). However, the benefits extended beyond the economic outcomes and suggest that the TOFA strategies investigated here would also be associated with more patients in remission.
Of course, models such as this one rely on assumptions which are entered as point estimates without directly capturing the degree of uncertainty in those point estimates. As a result, we undertook a series of sensitivity analyses to vary a number of key assumptions relating to efficacy, safety, and costs. This provided a more systematic assessment of our research questions. None of these variations demonstrably influenced the differences between treatment strategies, suggesting the overall conclusions are robust to even fairly significant variations in the core parameters.
No study to our knowledge has examined the cost implications of TOFA in the US vis-à-vis other advanced therapies for UC, so comparing our findings with existing literature is difficult. Nevertheless, a study by Wu et al.Citation39 that studied the cost-effectiveness of different treatment sequences in China and the UK found that sequences which included either TOFA or VEDO were among the most cost-effective in the UK, and treatment sequences which included TOFA were the most cost-effective in China. Although the structure and the key assumptions of the model of Wu et al. were different from our model (e.g. efficacy based on a network meta-analysis, costs were specific to each country, etc.), the overall conclusions further suggest the economic benefit to introducing TOFA earlier in the treatment paradigm.
Limitations
There are several limitations to consider. Efficacy assumptions were obtained from the USPIs and published trials of each treatment. Since none of these trials were head-to-head, and they all had slightly different methods (e.g. patient characteristics, concomitant therapies, etc.), it is possible the efficacy used here may differ from efficacy estimates generated under different circumstances. For example, TOFA trials relied upon centrally-read endoscopy results (vs locally-read), used stricter endoscopic Mayo sub-score criteria (a score of 1 indicated no friability in the TOFA clinical program, whereas a score of 1 could have indicated either no or mild friability in other programs), and had a more stringent definition of remission compared with other trials. Regardless, it should be noted that our sensitivity analyses suggest that our overall conclusions do not change, even with fairly significant variations in efficacy rates (i.e. variations well beyond the 95% confidence intervals of the point estimates as reported in the TOFA clinical program). We also validated our conclusions by using the inputs from a network meta-analysis rather than USPI information. Again, the overall conclusions remained the same.
It should also be mentioned that, even though the primary endpoint of the tofacitinib induction trials was remissionCitation11,Citation12, our model focused on clinical response after induction. As described in the methods, this decision aligns best with clinical practice (since it is unlikely a patient who responded but was not in remission would switch therapy), but it does deviate from some of the trial designs of the included therapies.
Our model incorporated dose escalation consistent with therapeutic drug monitoring guidelines and the recently published real-world data reporting its prevalenceCitation31,Citation33. However, as this practice is outside the USPIs and clinical programs, there is only modest available data. For instance, we did not account for the possibility of dose escalation with VEDO or GOL. Despite the level of uncertainty, removing dose escalation entirely had a negligible effect on our results and no effect on our conclusions.
Our approach for assessing ADRs was a simplified version of what occurs in real-world clinical practice. Although ADRs can occur at any point, we only assessed the probability of an ADR event at the end of each induction period (if there was more than one) and at the end of each year. The appearance of an ADR midway through one of these periods, and the corresponding economic implications, were beyond the scope of our present analysis. Our model relied on representative minor and major ADRs (and the associated costs) to represent toxicity management. Clearly, each treatment has a multitude of possible ADRs, which can vary considerably in costs and severity. The degree to which serious infections, for example, is indicative of the overall safety profile of each treatment is questionable, though this approach was used to ensure consistent reporting across trials. Examining rates of different ADRs across treatments would make the interpretation challenging. Despite the limitation of our simplified approach, it should be emphasized that we varied the ranges (and costs) for the management of these ADRs substantially without any change in the overall study conclusions. So, despite our simplifying assumptions, it is unlikely a more complex incorporation of safety information would meaningfully affect the results.
Another limitation is that the structure of the model represents a simplified linear pathway over a 2-year time horizon. In real-world clinical practice, future treatment choices may be dictated by prior treatment experiences. For example, a patient who fails their first therapy due to a major ADR during induction may have a very different subsequent treatment strategy than a patient who is no longer in remission after a year of their first therapy. Additionally, combination therapy (e.g. biologics with immunomodulators) was not modeled due to the lack of available data on the combined efficacy and safety profile of such combinations. The model was also not intended to provide data on more long-term cost consequences (e.g. surgery and surgical complications) given its short-term perspective. Future real-world data analyses can help address these simplifications and test the study hypotheses more directly, though researchers require more time on the market for VEDO and TOFA to allow for sufficient sample size and follow-up time for such comparisons with other treatments.
Despite these limitations, we believe this model and its results can be helpful to the payer community by providing a rigorously researched evidenced-based tool to assess the costs of various treatment strategies, with the ability to tailor specific assumptions to the particular organization.
Conclusions
The results of this economic model suggest that implementing a TOFA-related treatment strategy for moderate-to-severe patients with UC, regardless of prior TNFi exposure, may provide cost savings to the healthcare organization. Specifically, our results suggest that using TOFA as the first advanced therapy results in lower costs compared with using ADA as the first advanced therapy and, also, using TOFA followed by ADA as the first two advanced therapies, results in lower costs than using ADA followed by TOFA as the first two advanced therapies.
Transparency
Declaration of funding
This study was funded by Pfizer Inc.
Declaration of financial/other interests
SM, PQ, and JG are employees of Evidera Inc, which received research support from Pfizer Inc. MD, JB, KP, AS, JC, and DQ are employees and stock holders of Pfizer Inc, which funded this study. JME peer reviewers on this manuscript have no relevant financial or other relationships to disclose.
Previous presentations
Elements of this paper were presented at the Academy of Managed Care Pharmacy (AMCP) Nexus conference in October 2018.
Appendices
Download MS Word (18.3 KB)Acknowledgements
No assistance in the preparation of this article is to be declared.
Related Research Data
References
- Cosnes J, Gower-Rousseau C, Seksik P, et al. Epidemiology and natural history of inflammatory bowel diseases. Gastroenterology. 2011;140:1785–1794.
- Danese S, Fiocchi C. Ulcerative colitis. N Engl J Med. 2011;365:1713–1725.
- Fakhoury M, Negrulj R, Mooranian A, et al. Inflammatory bowel disease: clinical aspects and treatments. J Inflamm Res. 2014;7:113–120.
- Kornbluth A, Sachar DB. Ulcerative colitis practice guidelines in adults: American College of Gastroenterology, Practice Parameters Committee. Am J Gastroenterol. 2010;105:501–523.
- Mowat C, Cole A, Windsor A, et al. Guidelines for the management of inflammatory bowel disease in adults. Gut. 2011;60:571–607.
- Farthing M, Roberts SE, Samuel DG, et al. Survey of digestive health across Europe: final report. Part 1: The burden of gastrointestinal diseases and the organisation and delivery of gastroenterology services across Europe. United Eur Gastroenterol J. 2014;2:539–543.
- Cohen RD, Yu AP, Wu EQ, et al. Systematic review: the costs of ulcerative colitis in Western countries. Aliment Pharmacol Ther. 2010;31:693–707.
- Null KD, Xu Y, Pasquale MK, et al. Ulcerative colitis treatment patterns and cost of care. Value Health. 2017;20:752–761.
- Park SC, Jeen YT. Current and emerging biologics for ulcerative colitis. Gut Liver. 2015;9:18–27.
- Bressler B, Marshall JK, Bernstein CN, et al. Clinical practice guidelines for the medical management of nonhospitalized ulcerative colitis: the Toronto consensus. Gastroenterol. 2015;148:1035–1058.e3.
- Sandborn WJ, Ghosh S, Panes J, et al. Tofacitinib, an oral Janus kinase inhibitor, in active ulcerative colitis. N Engl J Med. 2012;367:616–624.
- Sandborn W, Sands BE, D’Haens GR, et al. Tofacitinib as induction and maintenance therapy for ulcerative colitis. N Engl J Med. 2017;376:1723–1736.
- Kappelman MD, Rifas-Shiman SL, Kleinman K, et al. The prevalence and geographic distribution of Crohn’s disease and ulcerative colitis in the United States. Clin Gastroenterol Hepatol. 2007;5:1424–1429.
- Claxton L, Jenks M, Taylor M, et al. An economic evaluation of tofacitinib treatment in rheumatoid arthritis: modeling the cost of treatment strategies in the United States. JMCP. 2016;22:1088–1102.
- Rutgeerts P, Sandborn WJ, Feagan BG, et al. Infliximab for induction and maintenance therapy for ulcerative colitis. N Engl J Med. 2005;353:2462–2476.
- Jiang XL, Cui HF, Gao J, et al. Low-dose infliximab for induction and maintenance treatment in Chinese patients with moderate to severe active ulcerative colitis. J Clin Gastroenterol. 2015;49:582–588.
- Probert CS, Hearing SD, Schreiber S, et al. Infliximab in moderately severe glucocorticoid resistant ulcerative colitis: a randomised controlled trial. Gut. 2003;52:998–1002.
- Suzuki Y, Motoya S, Hirai F, et al. Infliximab therapy for Japanese patients with ulcerative colitis: efficacy, safety, and association between serum infliximab levels and early response in a randomized, double-blind, placebo-controlled study. J Crohns Colitis. 2015;9:S372–S373.
- Sandborn WJ, van Assche G, Reinisch W, et al. Adalimumab induces and maintains clinical remission in patients with moderate-to-severe ulcerative colitis. Gastroenterology. 2012;142:257–265 e1–3.
- Reinisch W, Sandborn WJ, Hommes DW, et al. Adalimumab for induction of clinical remission in moderately to severely active ulcerative colitis: results of a randomised controlled trial. Gut. 2011;60:780–787.
- Suzuki Y, Motoya S, Hanai H, et al. Efficacy and safety of adalimumab in Japanese patients with moderately to severely active ulcerative colitis. J Gastroenterol. 2014;49:283–294.
- Sandborn WJ, Feagan BG, Marano C, et al. Subcutaneous golimumab induces clinical response and remission in patients with moderate-to-severe ulcerative colitis. Gastroenterology. 2014;146:85–95. quiz e14–15.
- Feagan BG, Rutgeerts P, Sands BE, et al. Vedolizumab as induction and maintenance therapy for ulcerative colitis. N Engl J Med. 2013;369:699–710.
- Xeljanz (tofacitinib) Prescribing Information. New York (NY); Pfizer, Inc.; 2012. (Revised May 2018). Available from: https://www.accessdata.fda.gov/drugsatfda_docs/label/2018/203214s018lbl.pdf. [Accessed 2018 July 6].
- Remicade (infliximab) Prescribing Information. Horsham (PA); Janssen Biotech, Inc.; 2013. (Revised October 2017). Available from: https://www.accessdata.fda.gov/drugsatfda_docs/label/2013/103772s5359lbl.pdf [Accessed 2018 July 6].
- Humira (adalimumab) Prescribing Information. North Chicago (IL); Abbott Laboratories Inc. 2013. (Revised December 2017). Available from: https://www.accessdata.fda.gov/drugsatfda_docs/label/2011/125057s0276lbl.pdf [Accessed 208 July 6].
- Simponi (golimumab) Prescribing Information. Horsham (PA.) Janssen Biotech Inc. 2014. (Revised May 2018). Available from: https://www.accessdata.fda.gov/drugsatfda_docs/label/2011/125289s0064lbl.pdf [Accessed 2018 July 6].
- Entyvio (vedolizumab) Prescribing Information. Deerfield (IL); Takeda Pharmaceuticals America, Inc.; 2014. (Revised February 2018). Available from: https://www.accessdata.fda.gov/drugsatfda_docs/label/2014/125476s000lbl.pdf [Accessed 2018 July 6].
- Bickston SJ, Waters HC, Dabbous O, et al. Administrative claims analysis of all-cause annual costs of care and resource utilization by age category for ulcerative colitis patients. JMCP. 2008;14:352–362.
- Holubar SD, Long KH, Loftus EV, et al. Long-term direct costs before and after proctocolectomy for ulcerative colitis: a population-based study in Olmsted County, Minnesota. Dis Colon Rectum. 2009;52:1815–1823.
- Vande Casteele N, Herfarth H, Katz J, et al. American Gastroenterological Association Institute technical review on the role of therapeutic drug monitoring in the management of inflammatory bowel diseases. Gastroenterology. 2017;153:835–857.e6.
- Analysource® (Selected from FDB MedKnowledge (formerly known as NDDF Plus) data included with permission and copyrighted by First Databank, Inc.). 2018. Available from: https://www.analysource.com/ [Accessed 2018 July 6].
- Rubin D, Mody R, Davis K, et al. Real-world assessment of therapy changes, suboptimal treatment and associated costs in patients with ulcerative colitis or Crohn's disease. Aliment Pharmacol Ther. 2014;39:1143–1155.
- InGauge Healthcare Solutions. Physician’s Fee and Coding Guide. Atlanta (GA): InGauge Publications; 2017.
- Dias S, Ades AE, Welton NJ, et al. Network Meta-Analysis for Decision-Making. Chichester (UK): John Wiley & Sons Ltd, 2018.
- Singh S, Fumery M, Sandborn WJ, et al. Systematic review with network meta-analysis: first- and second-line pharmacotherapy for moderate-severe ulcerative colitis. Aliment Pharmacol Ther. 2018;47:162–175.
- Bonovas S, Lytras T, Nikolopoulos G, et al. Systematic review with network meta-analysis: comparative assessment of tofacitinib and biological therapies for moderate-to-severe ulcerative colitis. Aliment Pharmacol Ther. 2018;47:454–465.
- Rubin DT, Ashaye AO, Zhang Y, et al. Efficacy of tofacitinib and biologics as induction and maintenance therapy for moderately to severely active ulcerative colitis: a systematic review and network meta-analysis. Poster presented at the American College of Gastroenterology congress; 2018 October; Philadelphia, PA.
- Wu B, Wang Z, Zhang Q. Cost-effectiveness of different strategies for the treatment of moderate-to-severe ulcerative colitis. Inflamm Bowel Dis. 2018;24:2291–2302.