
Abstract
Aims: Pembrolizumab demonstrated significantly prolonged overall survival (OS) vs. chemotherapy in the Phase III KEYNOTE-045 trial, and is approved in the US for the treatment of patients with locally advanced or metastatic urothelial carcinoma (mUC) who progressed after platinum-based chemotherapy. Using longer follow-up and individual patient-data from KEYNOTE-045, this study evaluates the cost-effectiveness of pembrolizumab vs. chemotherapy or atezolizumab from a US payer perspective.
Materials and methods: A partitioned-survival model was developed over a 20-year time horizon. Progression-free survival (PFS) and OS for pembrolizumab and chemotherapy were extrapolated using a piecewise modelling approach, where patient-level data from KEYNOTE-045 were used for the initial period followed by parametric distributions. OS of atezolizumab was estimated by indirect treatment comparisons based on KEYNOTE-045 and IMvigor211. Different scenarios were explored in the absence of indirect comparisons on PFS and time-on-treatment (ToT) between pembrolizumab and atezolizumab. Drug acquisition/administration, disease management, adverse events, and terminal care costs were considered.
Results: Compared with chemotherapy, pembrolizumab resulted in a mean gain of 1.33 life-years and 1.14 quality-adjusted life-years (QALYs) and an incremental cost of $106,299, yielding an incremental cost-effectiveness ratio of $93,481/QALY gained. Pembrolizumab dominated atezolizumab in extending patients’ life by 0.89 years and 0.76 QALYs, while reducing costs by $26,458. Key drivers of cost-effectiveness included survival extrapolation, OS hazard ratio of pembrolizumab vs. atezolizumab, and time horizon. Pembrolizumab had a 66% and 100% probability of being cost-effective vs. chemotherapy and atezolizumab, respectively, at a $100,000 willingness-to-pay threshold.
Limitations and conclusions: Uncertainties remain with extrapolated PFS and OS for pembrolizumab, OS indirect comparison, and ToT for atezolizumab. Despite these limitations, the model used robust methods to estimate key clinical endpoints with patient-level data from longer follow-up of KEYNOTE-045. Pembrolizumab dominates atezolizumab and is very likely cost-effective vs. chemotherapy in 2 L mUC at a $100,000 willingness-to-pay threshold.
Introduction
The majority of patients with metastatic urothelial carcinoma (mUC) receive platinum-based chemotherapy as first line (1L) treatment, with most patients experiencing disease progression following 1L treatment. Chemotherapies historically employed as second line (2L) treatments such as taxanes and vinflunine yield poor median progression-free survival (PFS) and overall survival (OS), ranging from 2–4 months and from 6–8 months, respectivelyCitation1–4. There is an urgent unmet need for effective treatment options for this population. In recent years, the rapid emergence of immunotherapy has considerably expanded treatment options for 2L mUC patientsCitation5.
The US Food and Drug Administration (FDA) has approved five checkpoint inhibitors as 2L treatment for patients with mUC, including pembrolizumab, atezolizumab, nivolumab, durvalumab, and avelumab. Among these, pembrolizumab and atezolizumab are the only agents evaluated in randomized controlled trials (RCTs). Pembrolizumab, a monoclonal antibody targeted at programmed cell death protein 1 (PD-1), is the only immunotherapy that has demonstrated superior OSCitation6,Citation7 compared with chemotherapy as 2L therapy for mUC. KEYNOTE-045 (NCT02256436), a Phase III RCT, compared pembrolizumab with chemotherapy (paclitaxel, docetaxel, and vinflunine monotherapy) in patients with mUC after failure of platinum-based therapy. The trial demonstrated improved OS (10.1 vs 7.3 months, hazard ratio [HR] = 0.70, 95% CI = 0.58–0.86), overall response rate (21.1% vs 11.0%), duration of response (median not reached [range = 1.6+ to 30.0+ months] vs. 4.4 months [range = 1.4+ to 29.9+ months]) and toxicity profile for pembrolizumab compared to chemotherapyCitation6,Citation7. More importantly, there were durable survival benefits with pembrolizumab yielding better 1- and 2-year OS rates (44.2% and 26.9%, respectively) than chemotherapy (29.8% and 14.3%, respectively). Atezolizumab, a PD-L1 inhibitor, was compared with chemotherapy (paclitaxel, docetaxel, or vinflunine) for 2L mUC in a Phase III RCT IMvigor211 (NCT02302807). Although there were no significant differences in OS between atezolizumab and chemotherapy in the pre-specified population with high PD-L1 expression levels (HR = 0.87; 95% CI = 0.63–1.21) and numerical significance in the overall population (HR = 0.85; 95% CI = 0.73–0.99)Citation8, atezolizumab was associated with a favorable safety profile and a longer duration of response than chemotherapy.
Cost-effectiveness analyses provide an important framework for payers, policy makers, suppliers, providers, and patients regarding the value of new treatments. Several major health technology appraisal (HTA) bodies in countries including the UK and Canada have recommended pembrolizumab for treating mUC in 2L based on its demonstrated plausible potential to be cost-effective at the current willingness to pay (WTP) thresholdsCitation9–12. Two recently published studies by Sarfaty et al.Citation13 and Criss et al.Citation14 examined the cost-effectiveness of pembrolizumab compared with chemotherapy for 2L mUC in the US setting, yielding varied cost-effectiveness results and different conclusions. Both studies highlighted the uncertainty due to the lack of long-term data, the use of aggregate trial level data, and failure to account for durable benefits provided to a subset of patients. In this study, we used longer-term individual patient level data from KEYNOTE-045 (median follow-up 27.7 months as of 26 October 2017) to assess the cost-effectiveness of pembrolizumab vs. chemotherapy as a 2L therapy for mUC in the US. We further evaluated the cost-effectiveness of pembrolizumab vs. atezolizumab using the results of an anchored indirect treatment comparison (ITC) based on individual patient data from KEYNOTE-045 and published data from IMvigor211Citation15.
Methods
Patient population
The target population for the model was patients with mUC that has recurred or progressed following platinum-containing chemotherapy. This is consistent with the patient population in KEYNOTE-045Citation6.
Comparators
Pembrolizumab is mentioned in the NCCN Clinical Practice Guidelines in Oncology (NCCN Guidelines®) as a category 1, preferred regimenCitation16. It is included in the model as the intervention of interest. The comparators in the model include the chemotherapy control group in KEYNOTE-045 (paclitaxel or docetaxel monotherapy) and the atezolizumab monotherapy based on the IMvigor211 trial. While vinflunine was also included in the chemotherapy control arm of KEYNOTE-045, this treatment is not approved in the US and was therefore not included in the model. Atezolizumab is an alternative guideline-recommended treatment option for 2L mUCCitation16. The anchored ITC between atezolizumab and pembrolizumab makes it feasible to compare these two treatments in the model. Other guideline-recommended therapies are not included due to the infeasibility of conducting anchored comparisons with pembrolizumab.
Model structure
A partitioned-survival model with three mutually exclusive health states: progression free (PF), progressive disease (PD), and death was used to estimate the costs and clinical outcomes for pembrolizumab vs. chemotherapy in the target population. The definition of progression in the model is consistent with the KEYNOTE-045 trial, which was measured as per the Response Evaluation Criteria In Solid Tumors (RECIST) v1.1 by blinded independent review committee. Patients started in the PF state and could either transit to PD, transit to death, or remain PF after each weekly cycle. Once a patient moved to PD, they could either remain there or die per cycle.
When comparing pembrolizumab vs. atezolizumab, the PF or PD states were not modeled in the base case due to a lack of indirect comparison evidence on PFS for pembrolizumab vs. atezolizumab. Alternatively, the model tracked patients’ alive and death states based on OS. Patients’ time to death (≥360, 180–360, 90–180, 30–90 and <30 days from death) was used to estimate health utilities and disease management costs. Inclusion of PF and PD states was explored in the scenario analyses to test the model structure sensitivity (see Supplementary Appendix).
Outcomes included costs (drug, administration, adverse events [AEs], disease management, subsequent therapy, and terminal care), life years, and QALYs, the latter of which informed the incremental cost-effectiveness ratio (ICER).
Model settings
The model evaluated cost effectiveness from a US third-party payer perspective, with costs and outcomes discounted at 3% per year. The model time horizon was 20 years, representing a sufficient length of time to capture long-term costs and benefit given a mean starting age of 65.5 years, based on KEYNOTE-045. The model had a weekly cycle length.
Modelling overall survival, progression-free survival, and time on treatment for pembrolizumab and chemotherapy
The model estimates the treatment effectiveness based on patient-level data from KEYNOTE-045 (26 October 2017 data cut-off) for the OS, PFS, and time on treatment (ToT). In the trial, 17.2% of patients in the control arm received anti-PD-1 or anti-PD-L1 immunotherapy drugs (e.g. pembrolizumab, nivolumab, or atezolizumab) as subsequent therapy. The presence of crossover to more effective treatments may dilute the treatment effect of pembrolizumab in OS compared with the control arm. Given limited real-world data reporting the subsequent utilization of immunotherapy drugs, it is unclear whether the OS in the control arm is under- or over-estimated. In the base case, a two-stage approach was implemented to adjust for the crossoverCitation17. No adjustment and other adjustment approaches were tested in scenario analysis.
Survival projection beyond the trial period were extrapolated in line with the National Institute of Health and Care Excellence (NICE) Decision Support Unit (DSU) guidelines. For OS and PFS, a piece-wise extrapolation approach was applied to account for the structural change observed in the initial parts of the Kaplan–Meier (KM) curves from KEYNOTE-045. For this approach, KM data were used directly before a cut-off point, followed by parametric models fit to the remaining data. A log-logistic distribution was selected for the OS and PFS for pembrolizumab. An exponential distribution was deemed the most plausible and therefore chosen for the OS and PFS for chemotherapy. Statistical fit (using both the Akaike and Bayesian information criteria) together with visual inspection and clinical plausibility of extrapolated curves were used to decide the most appropriate parametric distribution. The model base case used cut-off points at Weeks 15 and 32 for PFS and OS, respectively. The cut-off point was chosen based on visual inspection of significant changes in the log-cumulative hazard plot of OS and PFS; it also allowed for a reasonable sample size of observed data after the cut-off to estimate robust parametric curves. Scenario analyses were performed to test alternative plausible parametric curves and cut-off points.
The ToT data was extrapolated using one-piece parametric survival curves. A generalized gamma distribution was the best fit for chemotherapy. Parametric curves did not appear to fit the ToT data for pembrolizumab well. Since all patients had completed pembrolizumab treatment by this data cut, using the KM directly was considered appropriate. A maximum treatment duration of 2 years for pembrolizumab was applied as per the trial protocolCitation6.
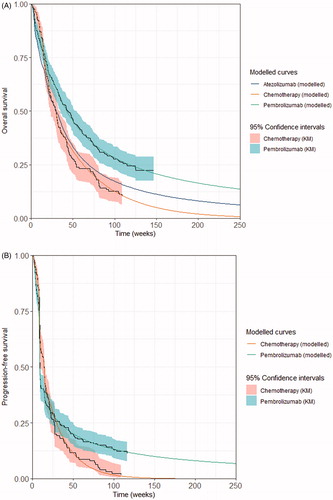
The KM including the 95% confidence intervals and best fitted survival curves of OS, PFS and ToT are presented in for pembrolizumab and chemotherapy. A detailed description of the curve selections is provided in the Supplementary Appendix. Modelled base case OS for chemotherapy was also validated externally with the reported OS curve for chemotherapy in the literatureCitation18–20 (Supplementary Appendix Figure S7).
Figure 1. Kaplan–Meier and best fitted survival curves. (A) Overall survival; (B) progression-free survival; (C) time on treatment. KM, Kaplan–Meier; OS, overall survival; PFS, progression-free survival; TOT, time on treatment.

Modelling overall survival, progression-free survival, and time on treatment for atezolizumab
In the absence of a head-to-head trial comparing pembrolizumab vs. atezolizumab, the OS HR of pembrolizumab vs. atezolizumab was derived from an ITC based on KEYNOTE-045 and IMvigor211Citation15. The ITC results showed that pembrolizumab was favored over atezolizumab among 2L mUC patients, via a network meta-analysis (NMA, HR = 0.83; 95% CI = 0.63–1.07) and an anchored matching-adjusted indirect comparison (MAIC, HR = 0.72; 95% CI = 0.53–0.97)Citation15. Compared with the NMA, the anchored MAIC further adjusted for cross-trial differences which were potential effect modifiers, by re-weighing the individual patient data from KEYNOTE-45 to match the baseline characteristics of the IMvigor211 populationCitation15. MAIC-based HR was used as the based case in the model, while NMA-based HR was tested in the scenario analyses. In the model, the OS of atezolizumab was estimated by applying the constant HR of atezolizumab vs pembrolizumab (i.e. the multiplicative inverse of the reported HR of pembrolizumab vs. atezolizumab) to the OS of pembrolizumab.
There was no published ITC for PFS based on KEYNOTE-045 and IMvigor211, and the publicly available data for atezolizumab were missing some of the clinical characteristics required for a robust indirect comparison with pembrolizumab, for example, patient-level data or trial-level summary data including hazard ratio of PFS between arms. Therefore, the impact of cross-trial differences on the PFS is unknown. In the absence of comparable PFS, patients were tracked by time to death instead of by progression states to estimate both health utilities and disease management costs in the base-case analyses.
The ITC for ToT based on KEYNOTE-045 and IMvigor211 was also neither available nor feasible due to insufficient publicly available ToT data for atezolizumab. Thus the ToT of atezolizumab was modeled based on the reported time-to-discontinuation curve based on IMvigor211, sourced from NICE single technology appraisal (TA525)Citation21. The time-to-discontinuation curve preferred by the NICE committee was reproduced by digitizing the KM/extrapolated curve up to 55 months, the latest timepoint shown in the reported plot. To extrapolate the curve beyond 55 months, a log-logistic parametric survival function as preferred by NICE committee was fitted to the constructed pseudo-patient level data using a commonly-adopted algorithmCitation22. A treatment duration cap was not applied to atezolizumab in the base-case analyses, to be aligned with the FDA label. A maximum of 2-year treatment duration for atezolizumab was mentioned in the NICE recommendationCitation21 and therefore tested in the scenario analyses.
For exploratory purposes, PFS and ToT for atezolizumab were modeled in scenario analyses by assuming proportional hazards between PFS and OS, as well as ToT and OS for atezolizumab. The HRs of PFS vs OS (2.28; 95% CI = 1.97–2.64) and ToT vs OS (2.16; 95% CI = 1.85–2.52), derived from Cox proportional hazard models, were applied to the modelled OS for atezolizumab to predict the PFS and ToT for atezolizumab. The Cox models were based on the constructed pseudo-patient level data of atezolizumab by digitizing the KM curves of PFS, ToTCitation21, and OSCitation8 from IMvigor211.
Safety
Treatment-related AEs from KEYNOTE-045 and IMvigor211 were included in the model to calculate the impact of AEs on costs and quality-of-lifeCitation8. All Grade ≥3 AEs with an incidence of ≥2% in either arm were included. Grade ≥2 diarrhea and febrile neutropenia of any grade were also included due to the high management costs of these AEs.
Health-related quality-of-life
The utility values of pembrolizumab and chemotherapy were based on EuroQOL-5D (EQ-5D) − 3-level (3 L) data collected in the KEYNOTE-045 trial. EQ-5D questionnaire response data were converted to population-based utility values using a US-specific algorithmCitation23. A time-to-death approach, reflecting the decline in cancer patients’ quality-of-life as they approach death, was used in the base caseCitation24. Disutility for AEs were already captured within time-to-death utilities, and thus not included in the model base case. The model assumed that health state utilities were the same across treatment arms as a conservative approach; arm-specific utilities were tested in scenario analyses. summarizes the time-to-death utilities from KEYNOTE-045. A conventional progression-based approach was also tested in the scenario analyses for the pembrolizumab and chemotherapy comparison. Due to lack of utility data on atezolizumab, it was assumed that both immunotherapies have the same utility values.
Table 1. Utility values used in the model based on KEYNOTE-045.
Resource use and costs
All costs are presented in 2018 USD and where applicable using health specific inflation indices from the US Bureau of Labor statistics. summarizes the main costs inputs; a complete list is presented in the Supplementary Appendix Table S1.
Table 2. Cost inputs.
Drug acquisition costs were calculated based on the vial cost, dosing schedule, and time on treatment. The vial costs for each treatment were based on the wholesale acquisition costs from the AnalySource database: $4,650 for 100 mg vial of pembrolizumab, $8,749 for 1,200 mg vial of atezolizumab, $55 for 300 mg vial of paclitaxel, and $495 for 160 mg vial of docetaxel. The paclitaxel and docetaxel usage within the control arm (49% vs 51%) and the average body surface area of 1.85 m2 were based on KEYNOTE-045. Pembrolizumab was administered at a fixed dose of 200 mg every 3 weeks (Q3W). Atezolizumab was administered at a fixed dose of 1,200 mg Q3W. Paclitaxel and docetaxel were administered at 175 mg/m2 (i.e. 324 mg) Q3W and 75 mg/m2 (i.e. 139 mg) Q3W, respectivelyCitation6. The cost per intravenous infusions was $144.72 for the first hour and $31.68 for each subsequent hour, based on data from the Centers for Medicare and Medicaid Services (CMS). The administration time for pembrolizumab, atezolizumab, paclitaxel, and docetaxel were 30 min, 1 h, 3 h, and 1 h respectivelyCitation30–33.
Costs for subsequent treatments were also included in the model. KEYNOTE-045 data were used to inform the distribution of subsequent treatment use. Due to the lack of data on the subsequent treatment use post-atezolizumab, the model assumed the same patterns as those post-pembrolizumab. The US-specific cost and dose were used to calculate the weekly drug acquisition and administration costs for each subsequent treatment. Patients were assumed to receive subsequent therapy for an average of 6 weeks (estimated from KEYNOTE-045 using all lines of subsequent therapies). Subsequent immunotherapies used in the comparator arm were excluded from the costs to be consistent with the OS adjustment for the control arm.
The total adverse event costs are calculated based on adverse event incidence rates and unit cost for each adverse event and applied as a one-off cost at the start of the model. The unit costs for managing each AE was estimated from the Agency for Healthcare Research and Quality Health costs and utilization project. The incidence rates and unit costs are detailed in the Supplementary Appendix Table S1.
Disease management costs were based on a retrospective cohort study of patients identified in the Surveillance, Epidemiology, and End Results (SEER)-Medicare databaseCitation29,Citation34. Costs were incorporated into the model by progression status (PF and PD) for the pembrolizumab and chemotherapy comparison. The one-time terminal care costs for the last 30 days of life were estimated from the same study. Since progression states were not modeled in the base case when comparing pembrolizumab and atezolizumab, disease management costs by time to death (≥360, 180–360, 90–180, 30–90 and <30 days [terminal care]), based on the same retrospective cohort studyCitation29, were incorporated into the model for this comparison.
Sensitivity analysis
One-way sensitivity analyses were performed by varying each parameter by its lower and upper bound and assessing the impact on the model results. Probabilistic sensitivity analyses (PSAs) were also performed, whereby each key parameter was randomly varied within its distribution range simultaneously for 1,000 iterations. Extensive scenario analyses were performed to test alternative sources of model inputs and model assumptions (e.g. alternative cut-offs for OS and PFS, alternative parametric survival curves, alternative HR for pembrolizumab vs atezolizumab based on NMA, alternative approach to estimate atezolizumab’s PFS and ToT, progression-based utilities, arm-specific utilities, and cost-sharing scheme from public payer perspective). Key model parameters and their distributions are presented in Supplementary Appendix Table S1.
Results
presents results of the discounted base case cost-effectiveness analysis. Over a 20-year time horizon, patients treated with pembrolizumab lived more than twice as long vs. patients treated with chemotherapy (2.22 years vs. 0.89 years). After adjusting for quality-of-life, pembrolizumab was associated with a QALY increment of 1.14 compared to chemotherapy. The incremental costs associated with the use of pembrolizumab vs. chemotherapy were $106,299. With a conservative assumption that no cost-sharing is applied for drug acquisition, drug administration, and AE costs, the ICER for pembrolizumab vs. chemotherapy was $93,481 per QALY gained, suggesting that pembrolizumab can be considered cost effective at a WTP threshold of $100,000 per QALY. With 20% cost-sharing for these costs, the ICER is reduced to $77,672 (see Supplementary Appendix Table S6).
Table 3. Model base case results.
Pembrolizumab extended patient’s life by 0.89 year vs. atezolizumab (increase of 67%), corresponding to an increment 0.76 QALYs. Pembrolizumab was cost saving vs. atezolizumab, and reduced costs by $26,458.
The incremental costs associated with pembrolizumab vs. chemotherapy were primarily contributed by the increased drug acquisition costs followed by disease management costs ($95,829 and $16,545 in absolute change, respectively), which were driven by the longer life expectancy resulting in longer period of treatment. The costs were partially offset by AEs management costs, due to the reduced severity and incidence of pembrolizumab’s AEs compared with chemotherapy. The overall reduction of costs for pembrolizumab vs. atezolizumab were driven by the reduced drug acquisition costs for pembrolizumab ($96,861 vs. $137,716), although patients in the pembrolizumab arm had increased disease management costs due to longer life expectancy ($52,803 vs. $36,863). Disaggregated costs are presented in Supplementary Appendix Table S5.
One-way sensitivity analysis showed that the OS best-fit curve parameters for pembrolizumab and the discount rate for health outcomes had the largest impacts on the ICER vs. chemotherapy (Supplementary Appendix Figure S8). The results of pembrolizumab vs. atezolizumab was most sensitive to OS HR of pembrolizumab vs. atezolizumab, discount rate for health outcomes, ToT curve parameters for atezolizumab, and OS best-fit curve parameters for pembrolizumab, however pembrolizumab remained dominant (Supplementary Appendix Figure S9).
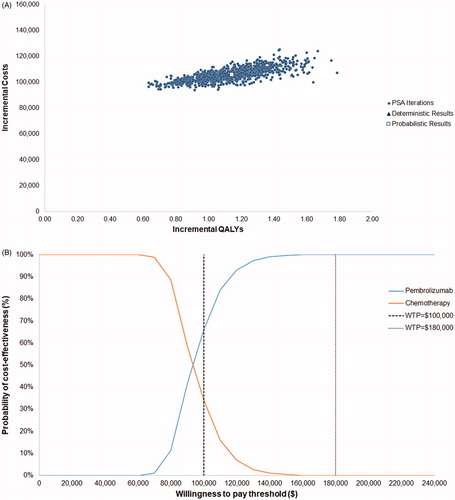
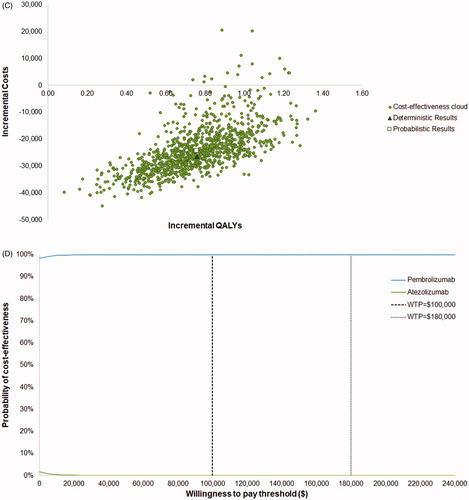
PSA produced a similar ICER to the deterministic base case result ($93,099 vs. $93,481 per QALY gained when comparing to chemotherapy and remained dominant when comparing to atezolizumab). A cost-effectiveness acceptability curve based on the PSA results showed that pembrolizumab had a probability of 66% and 100% of being cost effective vs. chemotherapy at WTP thresholds of $100,000 and $180,000 (3-times the gross domestic product per capita of the US), respectively (). Pembrolizumab is 100% cost-effective vs. atezolizumab at all WTP thresholds.
Figure 2. Probabilistic sensitivity analysis results. (A) PSA scatter plot vs. chemotherapy; (B) cost-effectiveness acceptability curve vs chemotherapy; (C) PSA scatter plot vs. atezolizumab; (D) cost-effectiveness acceptability curve vs atezolizumab. Abbreviations. Det., deterministic; PSA, probabilistic sensitivity analysis; QALY, quality-adjusted life-year.
The majority of the results from the scenario analyses showed that pembrolizumab is cost effective compared to chemotherapy or atezolizumab at a WTP threshold of $100,000 or $180,000; see Supplementary Appendix Table S6 for full details of the scenario analyses.
Discussion
This study suggested that, at a WTP threshold of $100,000, pembrolizumab is a cost-effective option compared to chemotherapy (ICER of $93,481 per QALY gained) and dominates atezolizumab, for treating mUC that has progressed following platinum-containing chemotherapy. The cost-effectiveness results were robust with the majority of ICERs in the one-way sensitivity analysis and the scenario analyses well below $100,000 or $180,000 per QALY gained.
When comparing pembrolizumab to chemotherapy, the ICERs were most sensitive to extrapolations of OS for pembrolizumab and chemotherapy, model time horizon and discount rates for health outcomes and costs. The ICERs were not sensitive to the factor of no adjustment of crossover or different adjustment approaches for OS in the chemotherapy arm. AE related costs of pembrolizumab are largely reduced compared to chemotherapy due to the more favorable safety profile with pembrolizumab observed in KEYNOTE-045Citation6. It is also reported in a meta-analysis that checkpoint inhibitors were associated with a significantly reduced incidence of AEs and severe AEs relative to chemotherapy.Citation35 AE costs are not main model drivers on the ICERs.
When comparing pembrolizumab to atezolizumab, results were most sensitive to the OS HR of pembrolizumab vs. atezolizumab, treatment duration cap for atezolizumab and ToT estimation. Despite the results being sensitive to the MAIC HR, pembrolizumab still remained dominant vs. atezolizumab using the upper bound MAIC HR or using the HR based on the NMA. PSA results showed that at a WTP threshold of $100,000, the probability of pembrolizumab being cost-effective vs atezolizumab is 100% when using the MAIC-based HR or the NMA-based HR, suggesting that the results remained robust regardless of the ITC approach employed (see Supplementary Appendix Figure S9).
Pembrolizumab has previously demonstrated cost-effectiveness compared to chemotherapy as 2L treatment for mUC, enabling positive recommendations by various HTA bodies from the UK, Sweden, Canada, and Australia using earlier data cuts from KEYNOTE 045Citation5,Citation7–9,Citation22. In the US setting, two prior studies by Sarfaty et al.Citation13 and Criss et al.Citation14 have examined the cost-effectiveness of pembrolizumab compared with chemotherapy in the 2L treatment, based on KEYNOTE-045, reporting higher ICERs and drawing different conclusions. Both studies had limitations. The analyses in both studies were based on aggregated trial data with limited follow-up (median = 14.1 months)Citation6. One of the key limitations is the uncertainty regarding long-term OS extrapolation. The conservative assumptions about the survival and relevant time-horizon need to be reassessed with long-term data to determine whether model projections reflect the actual trial data. This study uses longer-term OS from the KEYNOTE-045 from the final analysis (median follow-up 27.7 months) and therefore significantly reduces this uncertainty. Furthermore, cost effectiveness assessment for the PD-L1 positive subgroup is of limited utility given that pembrolizumab demonstrates activity and survival benefit regardless of PD-L1 status. Finally, none of the prior studies assessed the cost effectiveness of both pembrolizumab and atezolizumab – commonly used immunotherapies in the 2L setting.
The current study has many strengths. The pembrolizumab and chemotherapy comparison was based on individual patient data with a longer-term follow-up from a randomized Phase III trial. Beyond the trial duration, we explored multiple approaches for extrapolating the survival curves, ensuring that the most plausible parametric survival models were selected. Alternative distributions selected for OS and PFS resulted in ICERs which remained consistently within the $180,000 WTP threshold with the exception of the exponential for pembrolizumab’s OS vs. chemotherapy (see Supplementary Appendix Table S6). However, this curve visually had the poorest fit and is therefore considered an implausible choice. The piecewise approach allowed more accurate prediction of OS and PFS (see ). An important finding was that the conventional one-piece parametric fitting can underestimate the long-term OS benefit for immunotherapies such as pembrolizumab and thus overestimate the ICER of pembrolizumab (see Supplementary Appendix Figures S10 and S11), which may largely explain the higher ICER reported in the studies by Sarfaty et al.Citation13 and Criss et al.Citation14.
We used a 20-year time horizon to capture long-term health outcomes and costs. With a mean starting age of 65.5 years, based on KEYNOTE-045, 3.6% and 0.0% patients treated with pembrolizumab and chemotherapy remained alive by 20 years based on the extrapolated OS curve. Given that around 20% patients treated with pembrolizumab remained alive by 5 years, a 5-year time horizon (as in Sarfaty et al.’sCitation13 study) would be too short to fully capture the long-term survival gains associated with pembrolizumab.
Furthermore, we used EQ-5D utility values estimated directly from KEYNOTE-045 trial, allowing a more robust estimation by both time to death and progression status. Utilities in Criss et al.’sCitation14 analysis sourced from published literature were much lower than those observed in the trial and may partially contribute to the high ICERs.
Another strength is that, in our analysis, disease management costs were estimated using the SEER database which are reflective of real-world US clinical practice. The disease management costs were found to vary by time to death due to increased resource use towards death and by progression states. Therefore, it is particularly important to model this time-varying pattern to appropriately estimate the disease-related costs with prolonged survival associated with the use of pembrolizumab. Varying these costs in sensitivity analysis had very little impact on the ICER, and the choice of time-to-death approach or progression-based approach also had little impact on the ICER with all results remaining under the $100,000 WTP threshold vs. chemotherapy (see Supplementary Appendix Figure S8 and Table S6).
This study has several limitations. There remains inherent uncertainty with extrapolated PFS and OS of pembrolizumab and chemotherapy, given the still restricted follow-up duration of the trial and the real-world clinical practice that could differ from the trial. Extensive sensitivity and scenario analyses have been conducted to explore the uncertainty, while additional longer-term follow-up from the trial and real-world outcomes data could help to validate the results.
Additionally, in the absence of a head-to-head trial, the comparison of OS between pembrolizumab and atezolizumab relied on the published ITC (NMA and MAIC). While the MAIC approach adjusted for cross-trial differences and reduced the potential bias, there are risks of residual confounding. Regarding PFS and ToT of atezolizumab, a robust treatment comparison to pembrolizumab could not be generated due to the absence of patient-level data and insufficient publicly available data for atezolizumab. In the absence of ITC on PFS and ToT between pembrolizumab and atezolizumab, it was difficult to estimate whether or how the differences between KEYNOTE-045 and IMvigor211 would impact the comparative PFS and ToT. Acknowledging this limitation in PFS, the model adapted the model structure by excluding the PF and PD states and tracked patients by alive/death states and the time to death instead. The model has the advantage of using time-to-death health utility inputs from KEYNOTE-045 data and disease management inputs from a real-world SEER study. The scenario of including PF and PD states based on estimated PFS was explored, which shows that the model structure does not alter the conclusions (see Supplementary Appendix Table S6).
It is also uncertain whether the reported ToT for atezolizumab from IMvigor211 reflects the ToT in the modeled population aligned with KEYNOTE-045. In a scenario analysis, the ToT of atezolizumab was modelled by applying a HR to the modeled OS of atezolizumab, where the HR was derived by a Cox models using constructed pseudo-patient level data based on published KM curves from IMvigor211. This scenario resulted in a lower modeled ToT for atezolizumab than the published ToT data. With this conservative analysis of ToT for atezolizumab, the ICER for pembrolizumab vs. atezolizumab is $60,089 per QALY, demonstrating pembrolizumab being cost-effective at the $100,000 WTP threshold. The assumptions about proportional hazards and surrogacy between ToT and OS or PFS and OS were subject to uncertainty and require clinical justifications. The true ICER results may lie between the results in the base case and these scenario analyses, suggesting that pembrolizumab is a cost-effective option (at $100,000 WTP threshold), if not dominant, vs. atezolizumab.
Finally, the results and conclusions should be interpreted with caution for countries outside the US, especially for those with different resource utilization and costs pattern. However, the modeling concepts and approaches are generalizable to other countries.
Conclusions
Immunotherapy has revolutionized cancer care, particularly among patients with urothelial cancer. One concern about the adoption of novel therapeutics is that they are usually associated with high treatment costs. This US-based economic analysis suggests that pembrolizumab improves both survival and QALYs and is a cost-effective treatment compared with chemotherapy at a WTP threshold of $100,000 or $180,000 per QALY gained and dominates atezolizumab with cost savings. The use of individual patient longer follow-up data from the Phase III KEYNOTE-045 trial further mitigate the uncertainty of the projected survival of pembrolizumab and chemotherapy. To our knowledge, this is the first analysis which evaluates the cost-effectiveness of pembrolizumab vs. atezolizumab in the 2L mUC setting using the best available evidence from ITC. This analysis contributes to the value assessment for these important oncology drugs.
Transparency
Declaration of funding
This study was supported by funding from Merck Sharp & Dohme Corp., a subsidiary of Merck & Co., Inc., Kenilworth, NJ. The sponsor was involved in the design and conduct of the study; data collection, management, analysis, and interpretation; and review and approval of the manuscript.
Declaration of financial/other interests
GS: Consultant for BMS, Exelixis, Bayer, Sanofi, Pfizer, Novartis, Eisai, Janssen, Amgen, AstraZeneca, Merck, Genentech, EMD Serono, Astellas/Agensys; Research support to institution from AstraZeneca, Bayer, Amgen, Boehringer-Ingelheim, Janssen, Merck, Sanofi, Pfizer; Author for UpToDate; Steering committee for AstraZeneca, BMS, Bavarian Nordic; Speaker for OncLive; Research to Practice; Physician Education Resource (PER).
RS and YM are employees of BresMed Health Solutions Ltd. BresMed have received financial support and for this study provided by a contract with Merck. BresMed have received consultancy fees from Merck for producing this manuscript.
YZ, YL, HL, TF, BHM and JLG are employees of Merck Sharp & Dohme Corp., a subsidiary of Merck & Co., Inc., Kenilworth, NJ, who may own stock and/or hold stock options in the Company.
RM was supported by the NCI under award number K23CA187185. RM reports having served as a consultant for Astellas/Seattle Genetics and Roche, for work outside of the submitted manuscript.
JME peer reviewers on this manuscript have no relevant financial or other relationships to disclose.
Supplemental Material
Download MS Word (467.7 KB)Acknowledgements
The authors would like to acknowledge Ruifeng Xu and Abhiroop Chakravarty for their contribution to the data analysis. The authors would also like to acknowledge Oliver Hale for his contribution to the manuscript.
References
- Frantzi M, Latosinska A, Fluhe L, et al. Developing proteomic biomarkers for bladder cancer: towards clinical application. Nat Rev Urol. 2015;12(6):317–330.
- Kim JJ. Recent advances in treatment of advanced urothelial carcinoma. Curr Urol Rep. 2012;13(2):147–152.
- Bellmunt J, Theodore C, Demkov T, et al. Phase III trial of vinflunine plus best supportive care compared with best supportive care alone after a platinum-containing regimen in patients with advanced transitional cell carcinoma of the urothelial tract. J Clin Oncol. 2009;27(27):4454–4461.
- McCaffrey JA, Hilton S, Mazumdar M, et al. Phase II trial of docetaxel in patients with advanced or metastatic transitional-cell carcinoma. J Clin Oncol. 1997;15(5):1853–1857.
- Bukhari N, Al-Shamsi HO, Azam F. Update on the treatment of metastatic urothelial carcinoma. Sci World J. 2018;2018:1–7.
- Bellmunt J, de Wit R, Vaughn DJ, et al. Pembrolizumab as second-line therapy for advanced urothelial carcinoma. N Engl J Med. 2017;376(11):1015–1026.
- Fradet Y, Bellmunt J, Vaughn DJ, et al. Randomized phase III KEYNOTE-045 trial of pembrolizumab versus paclitaxel, docetaxel, or vinflunine in recurrent advanced urothelial cancer: results of >2 years of follow-up. Ann Oncol. 2019;30(6):970–976.
- Powles T, Duran I, van der Heijden MS, et al. Atezolizumab versus chemotherapy in patients with platinum-treated locally advanced or metastatic urothelial carcinoma (IMvigor211): a multicentre, open-label, phase 3 randomised controlled trial. Lancet. 2018;391(10122):748–757.
- National Institute for Health and Care Excellence (NICE). TA519: Pembrolizumab for treating locally advanced or metastatic urothelial carcinoma after platinum-containing chemotherapy 2018. [cited 12 March 2019]. Available from: https://www.nice.org.uk/guidance/ta519/chapter/1-Recommendations
- Australian Government Department of Health. Positive recommendations July 2018. 2018 [cited 2019 Apr 15]. Available from: http://www.pbs.gov.au/industry/listing/elements/pbac-meetings/pbac-outcomes/2018-07/positive-recommendations-07-2018.pdf
- Canadian Agency for Drugs and Technologies in Health. Keytruda for Metastatic Urothelial Carcinoma – Details 2018. [cited 2019 Apr 15]. Available from: https://www.cadth.ca/keytruda-metastatic-urothelial-carcinoma-details
- Srivastava T, Prabhu V, Li H, et al. Cost-effectiveness of pembrolizumab as second-line therapy for the treatment of locally advanced or metastatic urothelial carcinoma in Sweden. Eur Urol Oncol. 2018. DOI:10.1016/j.euo.2018.09.012
- Sarfaty M, Hall PS, Chan KKW, et al. Cost-effectiveness of pembrolizumab in second-line advanced bladder cancer. Eur Urol. 2018;74(1):57–62.
- Criss SD, Weaver DT, Sheehan DF, et al. Effect of PD-L1 testing on the cost-effectiveness and budget impact of pembrolizumab for advanced urothelial carcinoma of the bladder in the United States. Urol Oncol. 2019;37(3):180.e11–180.e18.
- Gelb D, Zhong Y, Perini R, et al. [P786] Network meta-analysis (NMA) and matching-adjusted indirect comparison (MAIC) of pembrolizumab (pembro) versus atezolizumab (atezo) for second-line (2L) locally advanced/metastatic urothelial carcinoma (mUC). National Harbour (MA): Society of Immunotherapy of Cancer; 2019.
- Referenced with permission from the NCCN Clinical Practice Guidelines in Oncology (NCCN Guidelines®) for Bladder Cancer V.3.2020. © National Comprehensive Cancer Network, Inc. 2020. All rights reserved. Accessed January 17, 2020. To view the most recent and complete version of the guideline, go online to NCCN.org. NCCN makes no warranties of any kind whatsoever regarding their content, use or application and disclaims any responsibility for their application or use in any way.
- Latimer NR, Abrams KR, Lambert PC, et al. Adjusting for treatment switching in randomised controlled trials – a simulation study and a simplified two-stage method. Stat Methods Med Res. 2017;26(2):724–751.
- Kamat AM, Cao Z, He J, et al. Costs of care for patients receiving chemotherapy for advanced bladder cancer. J Clin Pathways. 2017;3(10):63–70.
- Choueiri TK, Ross RW, Jacobus S, et al. Double-blind, randomized trial of docetaxel plus vandetanib versus docetaxel plus placebo in platinum-pretreated metastatic urothelial cancer. JCO. 2012;30(5):507–512.
- Petrylak DP, Tagawa ST, Kohli M, et al. Docetaxel as monotherapy or combined with ramucirumab or icrucumab in second-line treatment for locally advanced or metastatic urothelial carcinoma: an open-label, three-arm, randomized controlled phase II trial. J Clin Oncol. 2016;34(13):1500–1509.
- National Institute for Health and Care Excellence (NICE). TA525: atezolizumab for treating locally advanced or metastatic urothelial carcinoma after platinum-containing chemotherapy 2018. [cited 2020 Feb 4]. Available from: https://www.nice.org.uk/guidance/ta492/
- Guyot P, Ades AE, Ouwens MJ, et al. Enhanced secondary analysis of survival data: reconstructing the data from published Kaplan-Meier survival curves. BMC Med Res Methodol. 2012 ;12:9.
- Shaw JW, Johnson JA, Coons SJ. US valuation of the EQ-5D health states: development and testing of the D1 valuation model. Med Care. 2005;43(3):203–220.
- Hatswell AJ, Pennington B, Pericleous L, et al. Patient-reported utilities in advanced or metastatic melanoma, including analysis of utilities by time to death. Health Qual Life Outcomes. 2014;12:140.
- DMD America. AnalySource Suite of Drug Pricing Services. 2018. [cited 2019 Jan]. Available from: https://www.analysource.com/about.html
- Centers for Medicare & Medicaid Services. Physician Fee Schedule Search 2018. [cited 2018 May 10]. Available from: https://www.cms.gov/apps/physician-fee-schedule/search/search-criteria.aspx
- Centers for Medicare & Medicaid Services. ASP Drug Pricing Files 2018. [cited 2018 May 10]. Available from: https://www.cms.gov/Medicare/Medicare-Fee-for-Service-Part-B-Drugs/McrPartBDrugAvgSalesPrice/2018ASPFiles.html
- Agency for Healthcare Research and Quality. Healthcare Cost and Utilization Project [cited 2018 May 10]. Available from: https://hcupnet.ahrq.gov/#setup
- Zhong Y, Li H, He J, et al. C17 Pattern of disease management costs for advanced bladder cancer patients receiving chemotherapy. AMCP Managed Care & Speciality Pharamacy Annual Meeting; 2019; San Diego, CA.
- US Food and Drugs Administrations. KEYTRUDA® (pembrolizumab) injection, for intravenous use Initial U.S. Approval: 2014. [2014; cited 2019 Apr 15]. Available from: https://www.accessdata.fda.gov/drugsatfda_docs/label/2018/125514s034lbl.pdf.
- US Food and Drugs Administrations. TECENTRIQ® (atezolizumab) injection, for intravenous use Initial U.S. Approval: 2016. [2018; 2019 Mar 11]. Available from: https://www.accessdata.fda.gov/drugsatfda_docs/label/2018/761034s010lbl.pdf
- US Food and Drugs Administrations. TAXOL® (paclitaxel) INJECTION 2019 [cited 2019 May 21]. Available from: https://www.accessdata.fda.gov/drugsatfda_docs/label/2011/020262s049lbl.pdf
- US Food and Drugs Administrations. Docetaxel Injection 2012. [cited 2019 May 21]. Available from: https://www.accessdata.fda.gov/drugsatfda_docs/label/2012/201525s002lbl.pdf
- National Cancer Institute. SEER Cancer Stat Facts: Bladder Cancer [cited 2018 May 10]. Available from: https://seer.cancer.gov/statfacts/html/urinb.html
- Nishijima TF, Shachar SS, Nyrop KA, et al. Safety and tolerability of PD-1/PD-L1 inhibitors compared with chemotherapy in patients with advanced cancer: a meta-analysis. Oncologist. 2017;22(4):470–479.