
 ?Mathematical formulae have been encoded as MathML and are displayed in this HTML version using MathJax in order to improve their display. Uncheck the box to turn MathJax off. This feature requires Javascript. Click on a formula to zoom.
Abstract
Aims
The aim of this health economics study was to estimate the cost-utility of an aseptically processed, dehydrated human amnion and chorion allograft (dHACA) plus standard of care (SOC) (group 1) versus SOC alone (group 2) based on a published randomized controlled trial in which patients who had an eligible Wagner 1 diabetic foot ulcer wound were randomized to either of these treatments.
Materials and methods
A Markov microsimulation was used to project trial results out to a 1-year horizon time with a third-party payer perspective. The starting health state was an unhealed non-infected ulcer with other health states of healed ulcer, infected non-healed ulcer, cellulitis, osteomyelitis, and absorbing states of dead or amputation. All patients started with unhealed non-infected ulcers at cycle 0. Costs were incurred by patients for procedures at hospital outpatient wound care provider-based departments (PBDs) and hospitals (if complications occurred) and were calculated using time-based activity costing methods. Effectiveness units were quality-adjusted life years (QALYs) computed from literature utility values. One-way and probabilistic sensitivity analysis (PSA) were also conducted.
Results
After 1 year, the calculated incremental cost-effectiveness ratio (ICER) for group 1 versus group 2 was –$4,373 with group 1 (dHACA) being dominant over group 2 (SOC). PSA demonstrated that group 1 had 69.2% lower cost values with increased positive incremental effectiveness for 94.9% of values. A willingness to pay (WTP) curve showed that about 92% of interventions were cost effective for group 1 when $50,000 was paid.
Conclusions
The results of this study demonstrated that dHACA added to SOC compared to SOC alone was extremely cost-effective in the defined trial population.
Introduction
Diabetic foot ulcers (DFUs) are a costly complication of diabetes that can also have devastating consequences for the patientCitation1,Citation2. Standard of care (SOC) for patients with DFUs includes infection management, debridement of the wound to eliminate necrotic tissue and provide a viable wound bed, moisture-retentive dressings, and offloading for those ulcers on weight-bearing surfacesCitation3. With good SOC, many wounds will progress from the inflammatory to proliferative wound phase of healing, but in some instances this does not occur. A common recommendation of clinical practice guidelines is to assess the wound-healing trajectory after SOC has been initiated for a period of time and determine if it is satisfactory (e.g. percentage area reduction of the wound is >50% after 4 weeks)Citation4. If it is not, adjunctive treatments may be necessary to remove the barriers that are keeping the wound in the inflammatory phase.
In the last decade, dozens of new cellular and/or tissue-based products (CTPs) have entered the market and been used as adjunctive treatments for DFUs. However, while many have been found to be efficacious, they can also be costly. Investigating the cost-effectiveness of such CTPs could better inform health insurers, i.e. third-party payers as to the potential costs and benefit of using these products in an outpatient setting as adjunctive treatments in the care of DFUs. This would support the shift from a fee-for-service, volume-based methodology to a value-based payment approach (i.e. outcomes and quality/cost)Citation5.
Amnioband (MTF Biologics, Edison, NJ), is an aseptically processed, dehydrated human amnion and chorion allograft, hereon referred to as dHACA. This CTP is used to treat a variety of chronic wounds that have failed conventional standard of care. In a recent randomized controlled trial (RCT) 80 patients with full skin thickness DFUs were randomized to weekly treatments of dHACA and SOC versus SOC alone following a 2-week screening periodCitation6. After 12 weeks of treatment 85% (34/40) of the dHACA-treated DFUs healed, compared with 33% (13/40) treated with SOC alone. Mean time to heal within 12 weeks was significantly faster for the dHACA- treated group compared with SOC, 37 days vs 67 days in the SOC group (p = .000006).
The objective of this study was to model data from the RCTCitation6, using a Markov microsimulation approach. Since third-party payers are foremost interested in learning whether an intervention results in improved outcomes over SOC alone, this first dHACA health economics study did not compare other CTPs to dHACA, which is more challenging due to heterogeneity of trial populations. Likewise, the model mostly used trial data, as additional literature data for dHACA did not exist at the time of modeling.
Methods
The model simulates individuals as they age over time (1-year time horizon), while their wounds experience probabilities (“risks”) of changing health outcomes (“states”). In each cycle (one week), individuals may remain in their current state or transition to a different one. The state of each individual is tracked over time. One reason why 1 year was chosen is that 12 weeks is too short of a time period for evaluation; as Langer and RogowskiCitation7 noted of earlier wound care health economic studies, mean treatment cost may be expected to become lower over longer periods of time. Second, by the end of 1 year, the majority of Wagner 1 wounds (superficial or subcutaneous tissue ulcers) have healed or amputations have occurredCitation8. A cycle length of 1 week was chosen because wound care clinic visits are weekly and data were available for each visit.
Study participants, trial design, and interventions
All data were taken from the dHACA RCTCitation6. In this trial, there were two groups: intervention ((weekly application of dHACA, for up to 12 weeks) + SOC) (group 1); and SOC alone (group 2); There were 40 participants in each group. The percentage of wounds healed at 12 weeks was 85% in group 1 versus 33% for group 2 (p = 6.0 × 10⁻⁶).
Economic analysis
The health economic analysis (cost utility) compared group 1 vs group 2. Models were built with time horizons of 1 year. The perspective of the study was the third-party payer. Costs were calculated in 2019 U.S dollars in the setting of hospital outpatient wound care provider-based departments (PBDs). One million patients were simulated in the microsimulations (this number provided accuracy to 4 decimal places for costs and QALYs).
Expanding the time horizon out to 1 year required developing appropriate healing rate curves for both groups based on literature values for the populations and applying reasonable probabilities for complications and transitions to other health states besides a healed wound. Patients withdrawn from the trial for non-wound-related events or who had non-wound-related complications were kept in the simulation but their wounds were not allowed to heal until 12 weeks from randomization had elapsed.
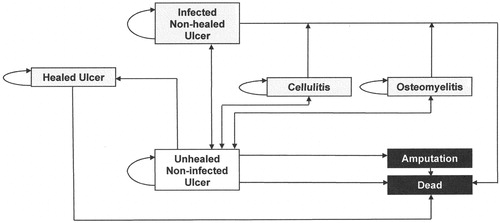
Costs were calculated based on a time-based activity-based costing (TBABC) method and not discountedCitation9. Patient Markov microsimulation models were built with Monte Carlo approaches to analyze cost-utility using Treeage Pro software (2017; R2.1). The starting health state was an unhealed non-infected ulcer with other health states of healed ulcer, infected non-healed ulcer, osteomyelitis, cellulitis, and absorbing states of dead and amputation ().
Figure 1. Health states used in the Markov microsimulation model.
Health state transition probabilities
Epithelialization
In order to calculate initial weekly epithelialization rates, two adjustments were made to the percentage of wounds healed at 12 weeks. The first arose because 2 DFUs in group 2 initially closed but were found to be reopened at the healing confirmation visit 2 weeks later. These wounds were classified as wound healing failures and the patients discharged from the study. In a real-world approach, wounds would be re-treated until healed. To model this approach, conservative healing rates were adopted with one wound classified as healed 4 weeks after the initial healing time (i.e. healed at week 9; area: 0.64 cm2) while the other was classified as still unhealed at 12 weeks (area: 7.5 cm2 at week 7). The second adjustment was necessary due to disparities in wound area at randomization between groups demonstrated in a Cox regression within 12 weeksCitation6. After adjustment for the crude SOC healing rates, a logistic regression was performed using the same model structure as reported in the study. Area at baseline was statistically significant and showed that the odds ratio (OR) for an increase in area of 1 cm2 decreased the odds of healing by 0.53. The healing rate for group 1 was adjusted using the following equation:
Where padj is the adjusted probability of healing, punadj the unadjusted probability of healing, and ORarea the odds ratio for the decrease in probability of healing due to an increase in area of 1 cm2; =75.1 (75.1%).
Healing rates for group 1 were then proportionally adjusted downward from weeks 0–12 using a factor of (75.1/85) = 0.88.
Based on a literature search of prospective cohort studies of DFUs with groups similar in demographics to the original trial population, it was estimated that 95% of wounds in group 1 would heal after 1 yearCitation8,Citation10,Citation11. Using the adjusted healing rates calculated for weeks 1–12 and a healing rate of 95% at 52 weeks, the best fit for the wound healing trajectory after 12 weeks was a polynomial equation: y = −0.0352×2 + 3.706x − 2.587; R2 = 0.990. Initial probability healing rates for each cycle after 12 weeks were derived to fit healing rates calculated using the equation. These same probabilities were used for group 2 after 12 weeks.
Death
Because patient age distributions were different between the groups, mortality rates would likely be different on average and thus were modeled using patient age in 5-year increments for each treatment group based on the method of Carter et al.Citation12 and adjusted using national census dataCitation13. The percentage of patients in each age interval was calculated. The calculated annual mortality rates were: group 1: 6.1%; group 2: 6.6%. Values for each group were divided by 52 to obtain the initial weekly mortality rate.
Amputation
No amputations were recorded during the trial. However, minor amputations do occur in this populationCitation8 in part because many patients have serious comorbidities and have had previous DFUs and amputations, which increases the risk for a minor amputation even for Wagner 1 DFUs (the classification of the wound population in the RCTCitation6) Additionally, major amputations can occur on the same foot that may or may not be related to a Wagner 1 DFU; for example, an ipsilateral deep DFU (common in this patient population) may result in a major amputation that involves the site of the Wagner 1 study ulcer. Accordingly, it was decided to model amputation in the base case after 12 weeks, setting the incidence to 5% (based on published study dataCitation8 at 1 year in group 2 for calibration purposes and imputing the same calculated weekly values for group 1 (i.e. both groups have the same cycle amputation probabilities after 12 weeks). It was assumed that 25% of the amputations would be major (75% would be minor amputations) based on populationsCitation8,Citation10 similar to the trial population. Amputation was chosen as an absorbing state because the model did not include recurring ulcers or recurring amputations to reduce complexity.
Infection
Infection describes osteomyelitis, cellulitis, and wound infection. Overall, modeling of each type of infection was based on trial resultsCitation6.
A patient in group 2 was treated in hospital for osteomyelitis of the index ulcer at week 8 with bone debridement and intravenous antibiotics. This infection complication was modeled with an incidence of 2.5% (1/40 patients) at week 8 only for an episode lasting 2 weeks (tunnel of 2 weeks and a probability of 1 for infection resolution at 1 week; most infections were treated for about 2 weeks). The incidence for osteomyelitis after week 12 was set to a nominal weekly incidence of 0.1%, reflecting the same rate as for the first 12 weeks including both groups ((1/80)/12)). Wounds were not allowed to have more than 1 osteomyelitis episode to keep modeling simple.
One case of cellulitis affecting the area of the index ulcer was reported in group 2 at week 6, managed with topical and oral antibiotics. The event was modeled using the same approach as for osteomyelitis.
There were several incidences of other wound infections: In group 1, 2 patients had infection-related complications of the study wound at weeks 4 and 6. In group 2, 4 patients had an infected study wound at weeks 2, 3, 4, and 11. In group 1, all infections were managed with systemic antibiotics, whereas in group 2, half of the infections were treated with topical as well as systemic antibiotics. The infections were modeled for a period of 2 weeks and a probability of 1 for infection resolution at 1 week, and an incidence of 2.5% at each of the weeks they occurred for each group. After 12 weeks, the weekly incidence was set to 0.6% ((6/80)/12). Wounds were permitted to have more than 1 infection episode.
Resource utilization
Standard of care
Standard of care for all DFUs is debridement to remove slough and necrotic tissue, offloading if the wound is located on the foot plantar surface or heel, a moist environment created by appropriate dressings, and wound infection treated with antibioticsCitation14. Each of these elements is further delineated in the model under the appropriate section.
Outpatient clinic visits
Within the first 12 weeks, subjects had weekly outpatient clinic visits until wounds healed unless complications lasting >1 week were encountered or patients reached an absorptive state. After 12 weeks, subjects with unhealed wounds were modeled as having an outpatient visit every 2 weeks per recent findings in regard to outcomesCitation15.
Debridement
No debridement data were available for the trial. Data from the largest wound debridement study to dateCitation16 suggested that debridement might occur at least every 2 weeks for unhealed wounds, and thus a debridement rate of 0.5 per week was applied for all unhealed wounds.
Offloading
To simplify cost calculations all offloading devices were assumed to be the removable diabetic offloading cam-walkers (boots) used in the trial as true total contact casting rarely occurred. In group 1, 29/40 of wounds (72.5%) were offloaded, while in group 2, 31/40 of wounds (77.5%) were offloaded. A new walking boot was provided 4 times a year.
Product applications
In group 1 dHACA was applied weekly until the wound closed or 12 weeks of treatment had elapsed.
Time-based activity-based costing
The TBABC method divides costs into 2 groups: (1) direct costs related to personnel time, procedures, and products used to treat patients; and (2) indirect costs related to the cost of operating a wound care clinic.
Initial hospital outpatient wound care PBD visits assumed 30 min of a physician’s time based on mapping level 3 complexity Current Procedural Terminology (CPT) codes to timeCitation17 and 30 min of a nurse’s time. For established PBD visits the time for the physician was halved but the nurse’s time remained the same. Debridements carried out at the initial clinic visit assumed 30 min of the physician’s time with subsequent debridements taking 15 min; a new debridement kit was used each time. CTP applications assumed 15 min of a physician’s time. All these times were based on input from trial investigators. Costs of dressings were estimated from public sources using key brand names ().
Table 1. Direct costs based on time-based activity-based costing (2019; US dollars).
Since indirect costs are unknown (nor calculated) for wound care PBDs in the USA, a figure of 30% was used in the base caseCitation9. This figure is a compromise based on an upper limit of 60% representing inpatient surgery and hospital departments that perform such surgeryCitation23 (wound care PBDs are unlikely to be allocated any surgical costs) and 0%, a case in which a hospital applies zero indirect costs to the wound care PBD. This 30% figure was applied after calculating the direct costs for each cycle to achieve total costs. Costs were calculated for groups 1 and 2 for each cycle starting with cycle 0 for both cohorts.
Unit costs are shown in . Red Book and ASP data for Q codes published quarterly by the Centers for Medicare and Medicaid Services (CMS) were 2019 (Q3) values while Medicare severity-diagnosis related group (MS-DRG) national average figures were taken from 2015 data. Source costs were inflated to 2019 values using the CPI inflation calculator for data earlier than 2019.
Cycle costs
The initial visit cost (cycle 0; day of randomization in the trial) for groups 1 and 2 includes evaluation, cutaneous debridement, the offloading device (if appropriate), intervention product, and dressings. Subsequent visit costs were calculated similarly.
For group 1, costs for CTP application were based on initial wound areas. Since dHACA is available in a number of sizes, the wound area was computed and the smallest dressing that could cover the wound was also estimated (). For each application documented in the trialCitation6, the cost of the application and then the mean cost at each week for group 1 was also calculated. These mean costs decreased over time, as on average, wounds became smaller in area even if they did not heal. By cycle 7, mean costs changed less than 10%, so to simplify model input costs were the same for cycles 7–11. Mean costs were finally increased by 1.136, as a response to the downward adjustment to healing rates (1/0.88). To illustrate dHACA sizes used, at cycle 0, the following sizes were used: 1.4 cm disk: 10/40; 1.8 cm disk: 6/40; 2 × 2 cm: 21/40; 2 × 4 cm: 3/40. By cycle 4, the dHACA sizes were: 1 cm disk: 11/20; 1.4 cm disk: 3/20; 1.8 cm disk: 2/20; 2 × 2 cm: 4/20.
Table 2. Calculation of ASP cost for different sizes of dHACA. Cost is $155.61 per square centimeter.
For group 1 (for the first 12 weeks), non-adherent and hydrogel-impregnated dressings were changed daily while the compression system was changed weekly. For group 2 (for the first 12 weeks) the collagen alginate dressings were changed daily. After 12 weeks, both groups received collagen alginate dressings twice a week, reflecting a more conservative dressing approach.
For each cycle, the direct costs for unhealed DFUs are: established visit cost, established visit debridement cost, cost of applying dHACA, cost of dHACA, dressing cost, Dynaflex (padding) cost, and offloading cost (if applied), with 1.3 × the subtotal representing the 30% indirect cost. The resource items, resource units used, and cost calculation are shown in .
Table 3. Example of resource items, resource units, and calculation of costs for cycle 0 for both treatment groups. Totals ±$0.01 due to rounding errors.
Costs for each cycle and group are shown in .
Table 4. Cycle costs ($) for model states.
Amputations
The cost of an amputation was obtained by assuming that 75% of amputations would be minor and 25% major, calculated as: $24,586.
Osteomyelitis
Because the ABC cost of osteomyelitis has not been reported, it was calculated by first inflating the cost of a minor amputation to a 2016 value, and then computing the ratio of this cost ($19,881.12) to the MS-DRG for amputation of a lower limb without any complications (618; $7,466.07)Citation24 and multiplying the MS-DRG for skin ulcer with complications (593; $6,369.69)Citation24 by the ratio (2.66) and inflating to 2019 cost values: $18,129.
Death
No costs were added for death.
Infection and cellulitis
Costs of a single infection or cellulitis episode lasting 2 weeks were based on 2 office visits, bacterial organism identification (culture, disk method, with one half of wounds also having nucleic acid, quantification, each organism), plus 2 weeks of treatment of cephalexin (500 mg twice daily), amoxicillin clavulanate (500 mg twice daily), or levofloxacin (500 mg once daily) (these costs were averaged at the level of a unit dose) with half of wounds also treated with metronidazole daily. The total cost per episode was calculated as $636.21.
Effectiveness
The effectiveness unit used was the QALY (quality-adjusted life year). A review of the literature showed several studies with utility values for diabetes-related comorbidities but only the data reported by Redekop et al.Citation25 contained utility values for infected and non-infected DFUs, as well as types of amputation: non-infected unhealed ulcer: 0.75; infected unhealed ulcer (also used for cellulitis and osteomyelitis): 0.70; healed ulcer: 0.84; minor amputation: 0.72 (0.74 + 0.68/2; some amputations are trans-metatarsal amputations rather than toes); major amputation: 0.65 (0.68 + 0.62/2; there needs to be a mix of above- and below-the-knee amputations). The final amputation utility value was calculated as 0.70 based on 25% of amputations being major and 75% minor.
QALY rewards for each cycle were calculated as the utility values for each health state divided by 52.
One-way sensitivity analysis
Based on model input variables, 3 sets were chosen in the categories of cost, probabilities, and utility values. Changes in costs and probability values were based on possible “round-number” capitations or provider policies or limits for extension of the trial population, or specific metrics of interest to test the basic model and its assumptions (generally ±50%) (). Results were calculated at 1 year and displayed as tornado diagrams based on relative changes to the baseline case (i.e. the center point would be $0 per QALY for a range based on increase and decrease of a variable).
Table 5. Variables used in sensitivity analysis, rationale for using them, and values used in the analysis.
Sensitivity analysis: clinical practice
There is likely to be considerable heterogeneity in regard to results achieved in clinical practice. To capture as much as possible in one ICER range (i.e. best and worst cases), microsimulations were carried out with these additional changes: (a) dHACA rates decreased by 20% and SOC healing rates increased by 20% for cycles 0–11; clinician’s hourly rates reduced by 25%; visit frequency every 2 weeks for SOC group for cycles 0–11; and dressing costs reduced by 50%; and (b) clinician’s hourly rates increased by 25%; visit frequency set to weekly for all groups for cycles ≥ 12; dressing costs increased by 50%.
Probabilistic sensitivity analysis (PSA)
PSA was carried out with an outer loop for parameter uncertainty (sampling) and an inner loop for individual variability (trials) using 1,000 samples and 1,000 trials. For parameter uncertainty, costs used gamma distributions, probabilities used beta distributions, and utility variables normal distributions. Standard deviations were set at 50% of the mean for costs, 25% of the mean for probabilities, and 10% of the mean for utility variables to accommodate variance estimates from model results at 1 year. All cost and probability variables were employed, as well as mortality rate and utility values themselves, with the exception of tunnel probabilities.
Model validation
After verifying that overall structures provided desired outputs, tracker variables were added to the temporary health states of infected non-healed ulcers, non-healed ulcers with cellulitis, and non-healed ulcers with osteomyelitis to count number of corresponding episodes. Additional tracker variables were also added to calculate health state percentages and validate that tunnel states were working correctly and that probabilities associated with permanent tracker variables were correct.
Monte Carlo simulations of 1,000,000 patients were run to provide a precision of ±0.1%. Model calibration started with the health state of dead after 53 cycles, followed by healed ulcer after 13 and 53 cycles, and infected non-healed ulcers, non-healed ulcers with cellulitis, and non-healed ulcers with osteomyelitis using trackers for these health states and number of infections after 13 cycles. This calibration sequence was repeated until all population targets were within specification. Calibration was required to achieve an accuracy of ±0.5% in regard to target population percentages for healed ulcers, and ±0.2% for absorbing states and infected ulcers (sum of ulcers previously or currently infected), or non-healed ulcers with cellulitis or osteomyelitis.
Final weekly cycle probability rates for all health states except healed ulcers () were: dead: group 1: 0.00121; group 2: 0.00133; amputation (cycles 13–52, all groups): 0.0105; infection: group 1: cycle 4: 0.048; cycle 6; 0.045; group 2: cycle 2: 0.042; cycles 3 and 4: 0.04; cycle 11: 0.035; cycles 13–52 (both groups): 0.009; cellulitis: group 2; cycle 6: 0.034; cycles 13–52 (both groups): 0.0015; osteomyelitis: group 2: cycle 8: 0.038; cycles 13–52 (both groups): 0.0015.
Table 6. Cycle probability rates for healing rates for both study groups. Note cycle 0 corresponds to the day of randomization in the trial; cycle 12 corresponds to week 12 in the trial.
Results
The distribution of the healed and non-infected non-healed ulcer health states by week showed considerable differences between the groups. At 4 weeks, 38.7% of ulcers had healed in group 1 versus 13.9% in group 2; at 12 weeks, the figures were 74.6% and 36.0%, respectively; at 1 year the figures were more comparable: 92.4% and 88.4%, respectively. In addition, the differences between the 2 groups by the end of 1 year in regard to other health states were also substantial with much higher rates of amputation in group 2 (4.9%) versus group 1 (1.3%). By the end of 1 year, 5.4%% of wounds had been infected once in group 1 compared to 15.0% in group 2; only 0.2% of wounds had been infected twice in group 1 compared to 1.1% in group 2.
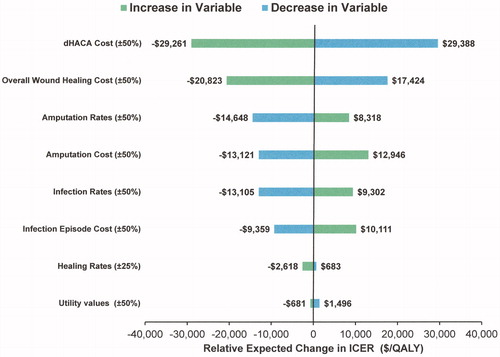
After 1 year, the calculated ICER was –$4,373 per QALY (($3,869.88 − 4,013.61)/(0.8095 − 0.7766)) with group 1 being dominant over group 2.dHACA cost had the most influence with a 50% increase resulting in a relative change in the ICER of –$29,261/QALY and a 50% decrease resulting in a relative change in the ICER of $29,388/QALY (). The actual ICERs were $24,888/QALY and –$33,761/QALY, respectively, showing that relatively large increases in dHACA cost substantially increase the ICER and vice versa. Overall wound healing costs also had a substantial influence resulting in relative changes to ICERs of –$20,823 to $17,424 per QALY. All other variables had smaller effects with changes in healing rates and utility values yielding little change to ICERs. Best and worst cases in regard to clinical practice yielded ICERs of –$21,342 and $41,844 respectively.
Figure 2. Tornado diagram showing influence of increasing or decreasing key cost and health state transition rate variables over the base case ICER using units of $/QALY (group 1 versus group 2). Note. units are expressed as the relative expected change in ICER.
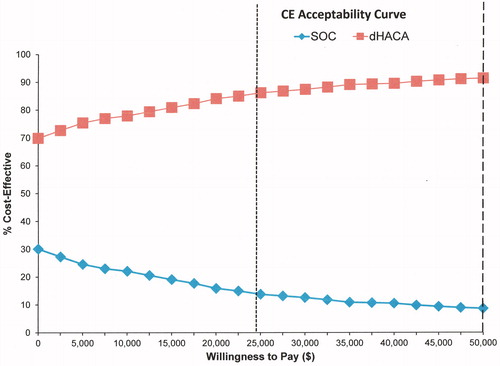
The ICE scatterplot showed that group 1 had lower cost values 69.2% of the time and increased positive incremental effectiveness for 94.9% of values (). Willingness to pay (WTP) analysis also demonstrated that about 70% of interventions were cost effective for group 1 when zero dollars were paid, increasing to 91% at a WTP of about $47,000/QALY (). Conversely, only about 30% of group 2 interventions were cost-effective when no money was paid reducing to 9% at $47,000/QALY.
Figure 3. ICE scatterplot. ICE scatterplot of group 1 versus group 2. The ellipse represents 95% confidence intervals (CI).
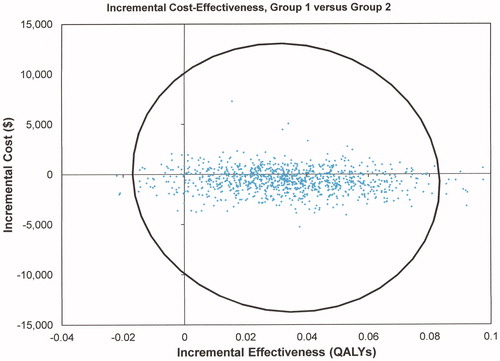
Figure 4. Willingness to pay curve with cost/QALY thresholds: £20,000/QALY based on June 2020 exchange rates (dotted vertical line) and $50,000/QALY (dashed line).
Discussion
In this health economics study, clinical trial data were projected out to 1 year to calculate the cost-utility of dHACA (+SOC) versus SOC alone. The baseline results showed that the ICER was –$4,373 per QALY with dHACA being dominant over SOC. This means that based on the model’s assumptions, using dHACA cost less and also provided an increase in effectiveness. Although established “benchmarks” for cost-effectiveness are arbitrary and need updatingCitation26,Citation27, currently $50,000/QALY is suggested as being extremely cost-effective. Consequently, despite changes to the base case in which key variables were increased by themselves separately or together, the calculated ICERs were still well below the $50,000/QALY threshold, suggesting that adding dHACA treatment to SOC is likely to remain very cost-effective over most scenarios. To exceed this threshold, treatment assumptions would have to be changed very considerably; for example, large DFUs (perhaps >15 cm2) or much more severe wounds. Moreover, assessing the healing of such wounds would require a new clinical trial.
The most influential cost variable by far was the cost of dHACA (). However, even if the cost were to increase by 50%, the results indicate that the CTP would still be cost-effective using most commonly accepted benchmarks. Costs of amputations and infection episodes are less influential and would need to be at least double to have possible adverse consequences on cost-effectiveness. Nevertheless, there is an argument to be made that results obtained from a randomized controlled trial are somewhat artificial as they may not be duplicated in the “real world”, especially in regard to healing rates. To address this concern, an additional sensitivity analysis was conducted in which healing rates were adjusted to make dHACA less efficacious and SOC rates more efficacious. In addition, changes in wound costs such as hourly clinician rates, visit frequencies, and costs of dressings were changed and bundled into the same analysis to either favor lower or higher wound healing costs. These changes simulated worst- and best-case scenarios. The results showed a large ICER variation: with unfavorable dHACA healing rates, better SOC healing rates, and lower costs, the incremental cost-effectiveness ratio was $41,844 but improved to –$21,342 with higher wound healing costs. Thus, in the worst-case scenario, although the ICER value is below the $50,000 ICER benchmark, there could be circumstances when the cost-utility of dHACA is not nearly so favorable as the base case. The corollary is that the product is even more dominant over standard of care when the cost of wound healing increases.
Probabilistic sensitivity analysis, which included uncertainty in regard to utility values of various health states confirmed that the majority of the time, the addition of dHACA to SOC decreased costs while increasing effectiveness. Indeed, nearly 92% of interventions for dHACA plus SOC would be categorized as extremely cost-effective using the $50,000/QALY threshold, reducing to about 87% for the UK’s NICE £20,000/QALY threshold (depending on exchange rates).
The choice of using a time-based activity-based cost approach rather than reimbursement costs, which have been traditionally used, is that CMS’ recent decisions have moved more to one-size-fits-all costs, which hide the complexity of services provided. In the case of DFUs, CMS reimbursement for the “high-cost” CTP category is relatively insensitive to wound area with a threshold of 25 cm2 required before additional billing codes can be employed. Consequently, if a CTP is available in a range of sizes (area) that can be matched to the area of the wound up to 25 cm2, the cost of any particular size of product cannot be taken into account. Compared to reimbursement mechanisms, the TBABC approach can also better approximate the true cost of treatment (i.e. it attempts to improve accuracy of costs at the expense of precision)Citation28, despite the challenges in estimating some unit costs and the indirect costs associated with the setting(s). In regard to cost uncertainty, while clinician input helped with elaboration of procedures and times to complete tasks, there will always be considerable heterogeneity in how wound care is carried out in different settings and management systems. Although it is difficult to find cost data for DFUs broken out by Wagner grade, Stockl et al.Citation29 conducted a retrospective analysis of medical and pharmacy claims in 4 U.S. states (2.7 million individuals) and calculated that the mean cost to treat Wagner 1 DFUs was $1,892 ($2,821 in 2019 terms). This about $1,200 lower than the base cost modeled for SOC but given the different cost methodologies the comparison suggests that the modeled figures are reasonable.
Although a plain Markov model could have been conducted and would have provided costs and QALY gains by health state, there are advantages to using a microsimulation as it increases the flexibility of the model. For example, microsimulation allows incorporation of randomness to permit Monte Carlo simulations to estimate stochastic uncertainty (describing the uncertainty in individual level models resulting from two individuals being in the same situation but, by chance, having different outcomes), and parametric uncertainty (in either population- or individual-level models and describing the uncertainty in the estimates of model parameters)Citation30.
While this study is the first of its kind to report microsimulation results of CTPs in wound care, model structure follows others reported in the literatureCitation31,Citation32 although handling of any kind of infection is considerably more complex. In addition, as the cost methodology used in this study is quite different to the few published cost-effectiveness investigations regarding treatment of DFUs involving CTPs, sometimes known as “skin substitutes”, direct comparisons are not possible.
A Markov model was based on a randomized controlled trial of the treatment of patients with DFUs using tri-layer porcine small intestine submucosa (SIS; Oasis Ultra) as an adjunct to standard of careCitation33,Citation34. We do not know the severity or depth of these wounds. The trial lasted 16 weeks and the Swedish-based Markov model projected the trial’s results out to 1 year using 2016 Medicare reimbursement costs, trial and other US clinician model inputs, and a variety of effectiveness units, including additional ulcer-free months. The model results showed that a 42% increase in the number of ulcer-free months could be expected with the concurrent use of SIS, a 32% increase in the probability of healing, a 3% decrease in the probability of developing complicated ulcers, and a 1% decrease in the probability of undergoing an amputation. When using SIS and standard care, total health-care costs were computed to be $105 less per patient compared to SOC alone.
A cost-utility model of patients with DFUs treated with a collagen-based dressing as an adjunct treatment to SOC was constructed using a UK setting and a horizon time of 4 monthsCitation35. The estimated ICER was dominant with £642 in cost savings (about $800 in 2020 exchange rates) and an increase in 0.007 QALYs.
Authors of a recent health economics study examining the cost-effectiveness of 8 common CTPs in the treatment of DFUs using 2018 Medicare reimbursement costs and efficacy rates from the associated RCTs reported that the percentage of wounds healed per $1000 expenditure with each patient ranged from 3.9–26.5 DFUs in the hospital outpatient department, and 4.3–36.4 DFUs in the physicians’ office settingCitation36. In addition, the authors noted that costs of each CTP did not necessarily correlate with healing efficacy.
Finally, the results of a much older cost-effectiveness investigation of Dermagraft and SOC versus SOC alone based on an RCT carried out in the USA but with costs adapted to a French setting and a horizon time of 1 year showed that it cost approximately $6,650 for each additional DFU healedCitation37.Strengths of this trial-based health economics study include using relatively sophisticated models that followed ISPOR’s best practices for Markov modeling, including transparency and validityCitation38,Citation39. In addition, the trial upon which the model is based had statistically significant and robust outcomes in regard to healing rates between treatment groups
This study also had a number of limitations. First, extension of trial results to 1 year is conjectural as it was predicated on several premises, especially wound healing rates, although these issues were partially mitigated by sensitivity analysis and incorporating healing endpoints from a large cohort study of diabetic foot ulcers similar in characteristics to the trial population. Second, while all wound-related complications in the trial were captured and successfully modeled, complications beyond 12 weeks had to use assumptions, even though sensitivity analysis provided results to test those assumptions. Third, the complexity of trial results had to be reduced to create a manageable model; for example, wound infection episodes were limited to a particular period of time with a simple probability distribution of infection resolution, and severity of infection modeled with only approximate costs. Another example is that fact that actual healing rates were used for the first 12 weeks instead of using an equation to “smooth” the changes. Fourth, lack of data meant that certain health states could only be modeled in a simplistic fashion; for instance, some cases of osteomyelitis lead to lower extremity amputation, but others do not. Fifth, means and standard deviations for the PSA parameters were based on data-driven preliminary results, acknowledging the fact that a framework for developing meaningful variance parameters for cost, probability, and utility variables in wound care health economics does not yet exist. Sixth, the study used the hospital outpatient setting. It is possible to use dHACA in physician office settings, and although the model does not cover this possibility directly, the reimbursement figures in this scenario are not so different that benefits of this CTP could not be realized. Seventh, because of the absence of other dHACA studies, this investigation had to be modeled using the results of a single RCT, thus precluding generalization to broader wound care populations—patients with more severe wounds and more serious comorbidities. Finally, the third-party payer perspective does not cover societal costs: those costs incurred by patients, their caregivers, and society; one example of this are the copays for treatments, which can be as much as 20% when the patient does not have the necessary additional insurance.
Conclusions
In conclusion, based on robust results from an RCT that investigated the outcomes of treating Wagner 1 DFUs, the cost-utility analysis showed that addition of dHACA to SOC compared to SOC alone resulted in lower costs and QALY gains and remained cost-effective even when the assumptions of the model were substantially changed. As our nation’s health care system moves from a fee-for-service, volume-based care payment methodology to a value-based care payment where outcomes, quality, and cost are more heavily weighted, third-party payers should consider these results as demonstrating that use of this particular CTP in the defined population may not only provide benefit to patients but could also reduce costs in many instances.
Transparency
Declaration of funding
This study was funded by MTF Biologics.
Declaration of financial/other relationships
The author is a paid consultant to MTF Biologics. JME peer reviewers on this manuscript have no relevant financial or other relationships to disclose.
Author contributions
The sole author of this study conceived it, developed the models and carried out the modeling, as well as drafting and polishing the manuscript.
Previous presentations
None.
Acknowledgements
The author would like to thank the trial investigators for their assistance.
References
- Jeffcoate WJ, Vileikyte L, Boyko EJ, et al. Current challenges and opportunities in the prevention and management of diabetic foot ulcers. Diabetes Care. 2018;41(4):645–652.
- Nussbaum SR, Carter MJ, Fife CE, et al. An economic evaluation of the impact, cost, and Medicare policy implications of chronic nonhealing wounds. Value Health. 2018;21(1):27–32.
- Everett E, Mathioudakis N. Update on management of diabetic foot ulcers. Ann NY Acad Sci. 2018;1411(1):153–165.
- Hingorani A, LaMuraglia GM, Henke P, et al. The management of diabetic foot: a clinical practice guideline by the Society for Vascular Surgery in collaboration with the American Podiatric Medical Association and the Society for Vascular Medicine. J Vasc Surg. 2016;63(2 Suppl):3S–21S.
- Martin J. Preparing for the transition to value-based reimbursement: what you need to know. J Med Pract Manage. 2017;32(5):313–316.
- DiDomenico LA, Orgill DP, Galiano RD, et al. Use of an aseptically processed, dehydrated human amnion and chorion membrane improves likelihood and rate of healing in chronic diabetic foot ulcers: a prospective, randomised, multi-centre clinical trial in 80 patients. Int Wound J. 2018;15(6):950–957.
- Langer A, Rogowski W. Systematic review of economic evaluations of human cell-derived wound care products for the treatment of venous leg and diabetic foot ulcers. BMC Health Serv Res. 2009;9:115.
- Beckert S, Witte M, Wicke C, et al. A new wound-based severity score for diabetic foot ulcers: a prospective analysis of 1,000 patients. Diabetes Care. 2006;29(5):988–992.
- Carter MJ. Why is calculating the “true” cost-to-heal wounds so challenging? Adv Wound Care. 2018;7(11):371–379.
- Coerper S, Beckert S, Küper MA, et al. Fifty percent area reduction after 4 weeks of treatment is a reliable indicator for healing-analysis of a single-center cohort of 704 diabetic patients. J Diabetes Complicat. 2009;23(1):49–53.
- Hicks CW, Canner JK, Mathioudakis N, et al. The society for vascular surgery Wound, Ischemia, and foot Infection (WIfI) classification independently predicts wound healing in diabetic foot ulcers. J Vasc Surg. 2018;68(4):1096–1103.
- Carter MJ, Gilligan AM, Waycaster CR, et al. Cost effectiveness of adding clostridial collagenase ointment to selective debridement in individuals with stage IV pressure ulcers. J Med Econ. 2017;20(3):253–265.
- National Center for Health Statistics, Centers for Disease Control and Prevention. National Vital Statistics System: Deaths: final data for 2013; [cited 2019 July 1]. Available from: https://www.cdc.gov/nchs/data/nvsr/nvsr64/nvsr64_02.pdf.
- Dowsett C, Newton H. Wound bed preparation: TIME in practice. Wounds UK. 2005;1:58–70.
- Carter MJ, Fife CE. Clinic visit frequency in wound care matters: data from the US wound registry. J Wound Care. 2017;26(Sup1):S4–S10.
- Wilcox JR, Carter MJ, Covington S. Frequency of debridements and time to heal: a retrospective cohort study of 312 744 wounds. JAMA Dermatol. 2013;149(9):1050–1058.
- Hill E. Time is on your side: coding on the basic of time. Fam Pract Manag. 2008;15(9):17–21.
- SalaryExpert. Wound care physician salary; [cited 2018 July 5]. Available from:https://www.salaryexpert.com/salary/job/wound-care-physician/united-states.
- Indeed. Wound care nurse salaries in the United States; [cited 2018 July 5]. Available from: https://www.indeed.com/salaries/Wound-Care-Nurse-Salaries.
- The Centers for Medicare and Medicaid Services. ASP Drug Pricing Files July 2019 Update; [cited 2019 July 5]. Available from:https://www.cms.gov/Medicare/Medicare-Fee-for-Service-Part-B-Drugs/McrPartBDrugAvgSalesPrice/2019ASPFiles.html.
- The Centers for Medicare and Medicaid Services. 2019. Clinical diagnostic laboratory fee schedule; [cited 2019 July 14]. Available from:https://www.cms.gov/Medicare/Medicare-Fee-for-Service-Payment/ClinicalLabFeeSched/Clinical-Laboratory-Fee-Schedule-Files-Items/19CLABQ1.html.
- Barshes NR, Chambers JD, Cohen J, et al. Cost-effectiveness in the contemporary management of critical limb ischemia with tissue loss. J Vasc Surg. 2012;56(4):1015–1024.e1.
- Akhavan S, Ward L, Bozic KJ. Time-driven activity-based costing more accurately reflects costs in arthroplasty surgery. Clin Orthop Relat Res. 2016;474(1):8–15.
- Centers for Medicare and Medicaid. Inpatient Charge Data, FY2016; [cited 2019 July 14]. Available from: https://www.cms.gov/Research-Statistics-Data-and-Systems/Statistics-Trends-and-Reports/Medicare-Provider-Charge-Data/Inpatient2016.html.
- Redekop WK, Stolk EA, Kok E, et al. Diabetic foot ulcers and amputations and estimates of health utility for use in cost-effectiveness analyses of new treatments. Diabetes Metab. 2004;30(6):549–556.
- Carter MJ. Cost-effectiveness research in wound care: definitions, approaches, and limitations. Ostomy Wound Manage. 2010;56(11):68–85.
- Neumann PJ, Cohen JT, Weinstein MC. Updating cost-effectiveness-the curious resilience of the $50,000-per-QALY threshold. N Engl J Med. 2014;371(9):796–797.
- Keel G, Savage C, Rafiq M, et al. Time-driven activity-based costing in health care: a systematic review of the literature. Health Policy. 2017;121(7):755–763.
- Stockl K, Vanderplas A, Tafesse E, et al. Costs of lower-extremity ulcers among patients with diabetes. Diabetes Care. 2004;27(9):2129–2134.
- Briggs AD, Wolstenholme J, Blakely T, et al. Choosing an epidemiological model structure for the economic evaluation of non-communicable disease public health interventions. Popul Health Metr. 2016;14:17. DOI:10.1186/s12963-016-0085-1
- Romero Prada M, Roa C, Alfonso P, et al. Cost-effectiveness analysis of the human recombinant epidermal growth factor in the management of patients with diabetic foot ulcers. Diabet Foot Ankle. 2018;9(1):1480249.
- Nherera LM, Woodmansey E, Trueman P, et al. Estimating the clinical outcomes and cost differences between standard care with and without cadexomer iodine in the management of chronic venous leg ulcers using a Markov model. Ostomy Wound Manage. 2016;62(6):26–40.
- Guest JF, Weidlich D, Singh H, et al. Cost-effectiveness of using adjunctive porcine small intestine submucosa tri-layer matrix compared with standard care in managing diabetic foot ulcers in the US. J Wound Care. 2017;26(Sup1):S12–S24.
- Cazzell SM, Lange DL, Dickerson JE, Jr, et al. The management of diabetic foot ulcers with porcine small intestine submucosa tri-layer matrix: a randomized controlled trial. Adv Wound Care. 2015;4(12):711–718.
- Guest JF, Singh H, Vowden P. Potential cost-effectiveness of using a collagen-containing dressing in managing diabetic foot ulcers in the UK. J Wound Care. 2018;27(3):136–144.
- Samsell B, McLean J, Cazzell S, et al. Health economics for treatment of diabetic foot ulcers: a cost-effectiveness analysis of eight skin substitutes. J Wound Care. 2019;28(Sup9):S14–S26.
- Allenet B, Parée F, Lebrun T, et al. Cost-effectiveness modeling of Dermagraft for the treatment of diabetic foot ulcers in the French context. Diabetes Metab. 2000;26(2):125–132.
- Siebert U, Alagoz O, Bayoumi AM, et al. State-transition modeling: a report of the ISPOR-SMDM Modeling Good Research Practices Task Force-3. Value Health. 2012;15(6):812–820.
- Eddy DM, Hollingworth W, Caro JJ, et al. Model transparency and validation: a report of the ISPOR-SMDM Modeling Good Research Practices Task Force-7. Value Health. 2012;15(6):843–850.