
 ?Mathematical formulae have been encoded as MathML and are displayed in this HTML version using MathJax in order to improve their display. Uncheck the box to turn MathJax off. This feature requires Javascript. Click on a formula to zoom.
Abstract
Aims
Six Delta is a six-dimensional independent platform for outcome-based pricing/contracting. The fifth dimension (δ5) estimates prices on the basis of the risk of efficacy failure of a drug. We describe this dimension’s methodology and present a proof-of-concept application to the treatment of non-small cell lung cancer (NSCLC) with EGFR mutation with osimertinib.
Materials and methods
The risk of efficacy failure pricing dimension utilizes a seven-step method: (1) defining risk; (2) extracting data; (3) predicting models; (4) performing Monte Carlo Simulation (MCS) to estimate risk of efficacy failure; 5) estimating ranges for a payback; (6) adjusting for medical inflation; and (7) performing Monte Carlo Simulation (MCS) to estimate the DSPRisk of efficacy failure. A proof-of-concept exercise with osimertinib in NSCLC was performed for two hypothetical outcome-based contracts: 1-year (2019–2020) and 2-year (2019–2021). We estimated the risk of efficacy failure for osimertinib in terms of overall and progression-free survival versus standard of care. We used the estimated risk to estimate the price reduction on the wholesale acquisition cost (WAC) for the two hypothetical contracts: a 1-year (2019–2020) and 2-year contract (2019–2021). From this we estimated the DSPRisk of efficacy failure.
Results
Based on the risk of OS and PFS efficacy failure for osimertinib in OS and PFS, in the 1-year contract, the DSPRisk of efficacy failure was estimated at $12,652 (or −13.44% the 2018 WAC) for a 30-day prescription. For the 2-year contract (2019–2021), the DSPRisk of efficacy failure was estimated at $13,019 (or −10.93% the 2018 WAC).
Conclusions
We demonstrated that pricing methods based on risk of efficacy failure methods can be integrated into our proposed Six Delta platform for outcome-based pricing/contracting.
Introduction
As already described in prior papers in this seriesCitation1–4, we aimed to develop a novel pricing platform of six dimensions for use in outcome-based contracting, in which drug prices are determined on the basis of clinical trials or in real-world studies. Previously, we provided methods validated by a proof-of-concept exercise to estimate the dimension-specific price (DSP) for four dimensions: dimension (1) cost-effectiveness analysis and cost-utility analysis-based pricingCitation1; dimension (2) willingness-to-pay-based pricingCitation2; dimension (3) reference-based pricingCitation3; dimension (4) safety-based pricingCitation4. In here, we continue our effort by developing methods and a proof-of-concept exercise for dimension 5 which is risk of efficacy failure-based pricing.
In this present paper, we focus on estimating the DSPRisk of efficacy failure which quantifies the financial consequences associated with treatment efficacy failure. As expressed in terms of the risk of the former as a function of the latter. Treatment efficacy failure is defined as the inability of a treatment to offer the clinical benefits expected from the efficacy results of clinical trials or from the effectiveness observed in real-world studies (herein, for simplicity of text, we use the term efficacy to refer to both efficacy and effectiveness)Citation5. We limit the definition of treatment efficacy failure not to losing the effect of treatment, but to losing the superiority of effect of this treatment relative to alternative treatments.
We propose a 7-step method to estimating the risk of treatment efficacy failure as another basis adjusting the drug price in outcome-based contracting negotiations . We then apply this methodology in a proof-of-concept exercise of osimertinib, a third-generation, irreversible EGFR tyrosine kinase inhibitor (TKI) in NSCLCCitation6. This is to estimate the DSPRisk of efficacy failure in two hypothetical outcome-based contracts: a 1-year contract (2019–2020) and a 2-year contract (2019–2021).
Methods
Risk of efficacy failure-based pricing ()
Step 1. Defining efficacy endpoints
Defining the efficacy endpoints of interest can be achieved by several methods, preferably in some combination rather than reliance on a single method data, literature review, evidence-based guidelines, consensus, and or expert opinion. For example, in cancer, OS and PFS are well defined and accepted efficacy measures. Thus, risk of efficacy failure, as per our definition, is when treatment A fails in terms of OS or PFS or both relative to treatment B.
Step 2. Extracting data
Traditional patient data from a clinical trial or real-world study are the ideal source of data. However, and assuming Kaplan-Meier (K-M) curves for drugs A and B as reported in a clinical trial are digitized and then replotted based on various parametric distributions, regression analyses are performed to identify the best fitting distribution with such metrics as the Akaike Information Criteria (AIC), Bayesian Information Criteria (BIC), or general linear models (GLM). The shape and scale coefficients for the selected distribution are used to replicate the OS and PFS K-M curves reported in the clinical trial.
Step 3. Predicting models (mean, lower, and upper curves for efficacy measures)
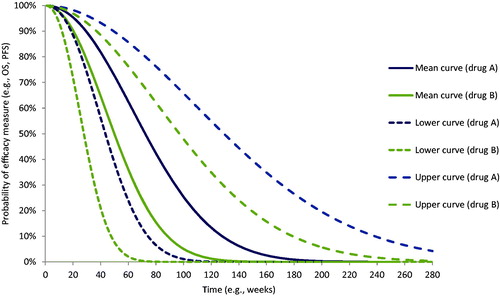
The three mathematical equations are applied to predict the mean curve, lower curve, and upper curve of efficacy measures (OS or PFS). The mean curve is predicted by using the mean estimates of the shape and scale coefficients of the distribution. The lower curve is predicted by using the upper estimates of shape and scale coefficients; and the upper curve by using the lower estimates of the shape and scale coefficients. This step is repeated for each of the efficacy measures of interest. shows an example of the curves generated for two hypothetical drugs A and B. The Y-axis represents the probability of effect and the X-axis represents the time function.
Figure 1. The 7-step method to estimate DSPRisk of efficacy failure in dimension 5. Abbreviation. MCS, Monte Carlo Simulation
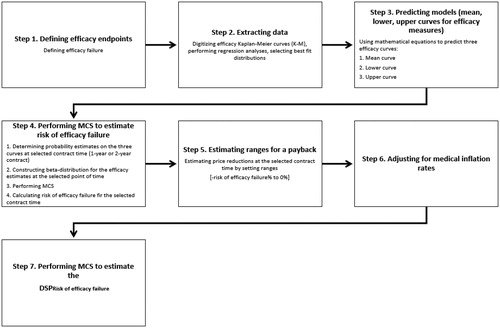
Figure 2. Model prediction for mean, lower, and upper curves for drug A versus B.
Step 4. Performing MCS to estimate risk of efficacy failure
Estimating risk of efficacy failure requires multiple sub-steps: first, on the generated curves for efficacy measures, points are taken for each treatment comparator(s) at a selected time. This time is the duration of the outcome-based contract that the drug manufacturer and payer have agreed to (e.g. 1-year contract, 2-year contract). As for our example for drug A and B, for simplicity, we provide an example in that shows the points taken in week 52 (hereafter, the 1-year contract) and week 104 (hereafter, the 2-year contract). Points are quantified in function of a 1-year contract and a 2-year contract for drug A under consideration of its presumed superiority over drug B (). The points are as follows:
Figure 3. Probability points on the predicted model for drug A versus drug B at 52 weeks and 104 weeks. Abbreviations. OS, overall survival; PFS, progression-free survival.
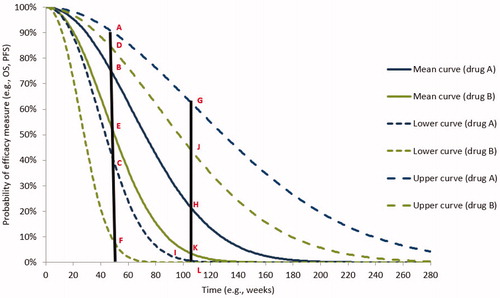
For the 1-year contract:
For drug A: points A, B, and C on the upper, mean, and lower curves, respectively.
For drug B: points D, E, and F on the upper, mean, and lower curves, respectively.
For the 2-year contract:
For drug A: points G, H, and I on the upper, mean, and lower curves, respectively.
For drug B: points J, K, and L on the upper, mean, and lower curves, respectively.
Second, using all the selected probability points—specified for each efficacy endpoint, for comparators, and at each contract duration—a beta distribution is specified. The beta distribution is selected because it represents a range of probabilities between 0 and 1. The beta distribution requires two parameters, alpha (ɑ) and beta (β)Citation7:
(1)
(1)
(2)
(2)
where ɑ is alpha > 0; β is beta > 0; P is the mean probability (B and E in 1-year contract; H and K in 2-year contract); and SD is the standard deviation, which is calculated by using the lower and upper probability points for each treatment for the 1-year contract and 2-year contract.
Third, MCS in which random probabilities for the selected efficacy measures are sampled for the selected treatment comparators (A and B). In our example for drug A and B, we perform MCS for each efficacy measure, for each contract duration. The MCS is performed to assess the stability of a drug’s efficacy within the typical probability range (0–1). The use of MCS in this context is to provide counts of efficacy failures for drug A relative to that of drug B during the 1-year contract and 2-year contracts.
Fourth, to estimate the risk of efficacy failure, the number of counts when only drug A is not superior to drug B are summed and divided by the total number of iterations. EquationEquation (3)(3)
(3) is used to estimate the risk of efficacy failure:
(3)
(3)
where PA is the probability of the efficacy measure for drug A at time T; PB is the probability of efficacy measure for drug B at time T; N is the number of iterations; and T is the duration of contract.
Step 5. Estimating ranges for a pay back
The risk of efficacy failure can be expressed as a percentage of payback which are then used to determine the price reductions that the drug A manufacturer provides to the payer. Moreover, this percentage represents the lower points on each curve and these the worst possible probability of events occurring. It predicts the risk of efficacy failure at the end of a specific contract time with no information about the drug performance during the contract time. Further, it is subject to systematic prediction error (e.g. in digitizing curves or estimating coefficients of fit) as well as random errors or errors of unknown cause. Therefore, we propose creating a dispersion for a payback percentage with a range from 0% up to the percentage of risk (i.e. 0% to risk of efficacy failure%). As a caution, minus sign should be added to the range to indicate price reductions. Thus, the range bounds are switched (−risk of efficacy failure% to 0%).
Step 6. Adjusting for medical inflation rates
The payback ranges determined in the step 5, are not adjusted for medical inflation. Any future contracting, should inflate price estimates based on the projected inflation rates as indicated by the medical consumer price index (mCPI) for prescriptions as published by the Bureau of Labor StatisticsCitation8. This is achieved by averaging the mCPI for previous years and using these averages in the inflation adjustments.
Step 7. Performing MCS to estimate the DSPRisk of efficacy failure
The inflated prices at a given contract time are averaged and integrated for MCS to generate the DSPRisk of efficacy failure for a specific contract. This by using the following functions for gamma distribution that is scaled from 0 to the positive infinity (0 to +∞)Citation7:
(4)
(4)
(5)
(5)
where ɑ is shape; β is scale; X̄ is average of all price reduction scenarios; and SD is standard deviation
Assumptions
Our 7-step method is based on these assumptions. First, drug comparators are assumed to be evaluated on the basis of the same clinical trial data. This ensures homogeneity of patient populations, clinical trial protocols, disease monitoring, drug administration, and follow-up. Second, in an outcome-based contract, the payer is paid back in the form of price reductions for those patients in which drug A may fail. Third, the payback ranges from − risk of efficacy failure% to 0%, based on the assumption that the estimated risk of efficacy failure, by MCS, is the upper bound for a range between 0% to risk of efficacy failure%: the points selected on all curves for each efficacy measure are the lowest possible values and can be considered as the worst possible probabilities of events to occur.
Validating the assumption for payback ranges
We introduce here the concept of restricted mean survival time (RMST) as an alternative basis for pricing. The RMST is referred to mean event time over a specific periodCitation9. The RMST is calculated by estimating the area under curve (AUC) under which a comparator treatment is yielding a better outcome than the treatment of interest. The RMST achieved by the comparator is captured at the 1-year and 2-year time points and can be used to represent the percentage of payback on the treatment of interest. We provide technical details about using the RMST as Supplemental Material.
Proof-of-concept: application to osimertinib in NSCLC with EGFR mutation
Background
The FLAURA clinical trial significantly favored osimertinib over the standard of care (SOC) in terms of OS and PFS: the hazard ratio for OS was 0.63 (95% confidence intervals, CI = 0.45–0.88) favoring osimertinib over SOC; the hazard ratio for PFS was 0.46 (95%CI = 0.37–0.57) favoring osimertinib over SOCCitation6. In our proof-of-concept exercise, we estimated the risk of efficacy failure for osimertinib, in terms of OS and PFS, versus the SOC. Then we used the estimated risk to estimate the paybacks on osimertinib wholesale acquisition cost (WAC) in two contracts: a 1-year contract (2019–2020) and a 2-year contract (2019–2021). In each contract, we estimated the DSPRisk of efficacy failure.
Model inputs
As shown in , we used the OS and PFS K-M curves from the FLAURA clinical trialCitation6 as inputs of OS and PFS for the DSPRisk of efficacy failure 2018 WAC for a 30-day prescription of osimertinib ($14,616)Citation10. The medical inflation rates were projected by averaging the mCPI over five years (2014–2018)Citation8. The inflation adjustment rates for drugs are 0.44% over the 1-year contract (2019–2020) and 0.72% over the 2-year contract (2019–2021).
Table 1. Model inputs.
Analysis
The analyses for the proof-of-concept exercise were performed in Microsoft Excel 365Footnotei MSO supporting visual basic coding for applications. Other supporting free-for-public programs were used in the validation (S1) to calculate the AUCs and estimating the RMSTs.
Results
Step 1. Defining efficacy endpoints
We focused on two efficacy endpoints as reported in the FLAURA trial, OS and PFSCitation6.
Step 2. Extracting data
The OS and PFS K-M curves for osimertinib and SOC from the FLAURA clinical trial were digitized and then re-simulated in three different parametric distributions (Weibull, Exponential, and Gompertz). For each, GLM regression analyses were performed to generate F statistics, R2, residual sum of squares, and (as applicable) shape and scale coefficients. The AIC, the main metric for determining the best fitting distribution, identified the Weibull distribution as the indicated parametric distribution for both OS and PFS.
Step 3. Predicting models (mean, lower, and upper curves for efficacy measures)
The OS and PFS Weibull regressions for osimertinib and SOC generated means and upper and lower 95%CIs bounds for the scale and shape coefficients. These metrics were used in three mathematical equations specified for the OS and PFS Weibull distributions ( and ) to determine the mean, lower, and upper OS and PFS curves. shows the three predicted OS Weibull curves for each treatment and comparator; shows the three predicted PFS Weibull curves for each treatment and comparator.
Figure 4. Prediction model of overall survival (OS) for osimertinib versus standard of care (SOC).
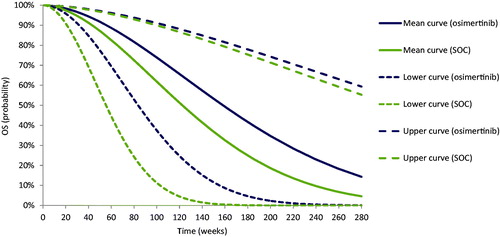
Figure 5. Prediction model of progression-free survival (PFS) for osimertinib versus standard of care (SOC).
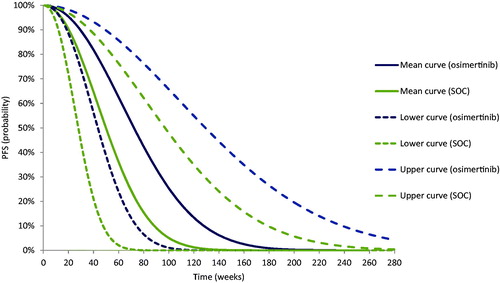
Table 2. Equations used to predict mean, lower, and upper Weibull curves for overall survival (OS).
Table 3. Equations used to predict mean, lower, upper Weibull curves for progression-free survival (PFS).
Step 4. Performing MCS to estimate risk of efficacy failure
In this step, points on OS and PFS Weibull distributions were quantified for 1-year contract and 2-year contract (). For the 1-year contract, in terms of OS, the mean probability quantified for osimertinib was 0.91, the lower was 0.76, and the upper was 0.97; the mean probability of OS quantified for SOC was 0.86, the lower was 0.54, and the upper was 0.96. In terms of PFS, the mean probability of PFS quantified for osimertinib was 0.71, the lower was 0.35, and the upper was 0.89; the mean probability of PFS quantified for SOC was 0.47, the lower was 0.06, and the upper was 0.81.
Table 4. Probability estimates for OS and PFS captured at 1 and 2 years for osimertinib and SOC.
For the 2-year contract, in terms of OS, the mean probability of OS quantified for osimertinib was 0.72, the lower was 0.35, and the upper was 0.90; the mean probability of OS quantified for SOC was 0.58, the lower was 0.09, and the upper was 0.89. In terms of PFS, the mean probability of PFS quantified for osimertinib was 0.22, the lower was 0.01, and the upper was 0.63; the mean probability of PFS quantified for SOC was 0.04, the lower was 1.78 × 10⁻⁶, and the upper was 0.45.
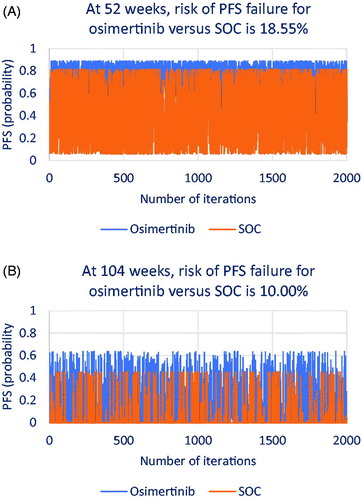
Using the probability points in MCS, we generated random OS and PFS probabilities within the beta distributions for osimertinib and SOC. The total of 2000 iterations was considered sufficient to find the risk of OS and PFS failure of osimertinib relative to SOC in the two hypothetical contracts. We provide technical details about how the number of iterations was determined as Supplemental Material. shows how osimertinib and SOC performed in terms of OS in the 1-year contract () and in the 2-year contract (). shows how both treatments performed in terms of PFS in the 1-year contract () and in the 2-year contract ().
Figure 6. Iterations that show risk of efficacy failure in overall survival (OS) for osimertinib versus standard of care (SOC).
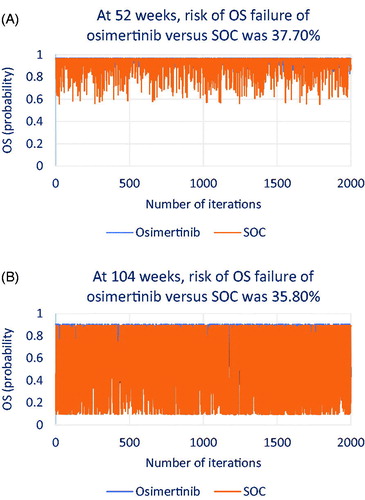
Figure 7. Iterations that show risk of efficacy failure in progression-free survival (PFS) for osimertinib versus standard of care (SOC).
For both and , the probabilities of OS and PFS failure for osimertinib relative to SOC were calculated for 1- and 2-year contracts using the following formulas as specified from equation [3]:
These equations were replicated for both contracts to estimate probability of failure at T = 1-year and T = 2-year.
As shown in , at 1 year, osimertinib may show OS failure in 37.70% of patients relative to SOC; at 2 years (), osimertinib may show OS failure in 35.80% of patients relative to SOC. As shown in , at 1 year, osimertinib may show PFS failure in 18.55% of patients relative to SOC; at 2 years (), osimertinib may show PFS failure in 10.00% of patients relative to SOC.
Step 5. Estimating ranges for a payback
As seen in , for OS, the range of payback was from −37.70% to 0% for the 1-year contract, and from −35.80% to 0% for the 2-year contract. For PFS, the range of payback was from −18.55% to 0% for the 1-year contract, and from −10.00% to 0% for the 2-year contract.
Table 5. Risk of efficacy failure-based pricing for 1-year contract (2019–2020) and 2-year contract (2019–2021).
In the Supplemental Material (S1), we provided compared the resulting ranges in this study with RMST% as a payback. This was by ensuring the percentage of price reduction on osimertinib represented in RMST achieved by SOC is located within our suggested ranges for OS and PFS in each contract as follows (Supplemental Material S1). For OS, for a 1-year contract, the RMST of SOC over osimertinib was 6.26 OS weeks suggesting −12.01% as a payback on osimertinib, which located within our range of payback on osimertinib [−37.70% to 0%]. For a 2-year contract, the RMST of SOC over osimertinib was 30.06 OS weeks suggesting −28.83% as a payback on osimertinib, which is also located within our range of payback on osimertinib [−35.80% to 0%]. For PFS, for a 1-year contract, the RMST of SOC over osimertinib was 2.87 PFS weeks suggesting −5.50% as a payback on osimertinib, which located within our range of payback on osimertinib [−18.55% to 0%]. For a 2-year contract, the RMST of SOC over osimertinib was 8.1 PFS weeks suggesting −7.77% as a payback on osimertinib, which located within our range [−10.00% to 0%] (Supplemental Material S1).
Step 6. Adjusting for medical inflation rates
Inflation rates of +0.44% and +0.72% were added to the ranges to estimate adjusted prices. As seen in , based on OS risk of failure, the estimated price range of osimertinib after adjusting for inflation rate is $9,170–$14,680 for 1-year contract (2019–2020), and from $9,489 to $14,721 for 2-year contract (2019–2021); based on PFS risk of failure, the estimated price range of osimertinib after adjusting for inflation rate is $11,969–$14,680 for 1-year contract (2019–2020), and from $13,259 to $14,721 for 2-year contract (2019–2021).
Step 7. Performing MCS to estimate the DSPRisk of efficacy failure
As shown in , for the 1-year contract, the average price of osimertinib was $12,625 (SD=$2,634), and the DSPRisk of efficacy failure was estimated at $12,652 or −13.44% the 2018 WAC. For the 2-year contract, the average price of osimertinib was $13,048 (SD=$2,471), and the DSPRisk of efficacy failure was estimated at $13,019 or −10.93% the 2018 WAC.
Discussion
We argue that outcome-based contracting should be based, at least in part, on sharing part of the risk of failure to the manufacturer. In this risk shifting, the drug manufacturer provides payback for any event, assessing between that the payer reasonably ensures that the drug was given as instructed and that the patient adhered to the contracted treatmentCitation11.
Our novel aspect of our proposed methodology to determining a price based on treatment efficacy failure is to include and estimate the RMST gained by a comparator treatment over the treatment of interest, where the latter is considered to be superior. The RMST method is conventionally known as a method to estimate the accumulated time gained by a specific treatment or by its comparator(s) (Supplemental Material S1). This is achieved by calculating the AUC under which the comparator treatment is yielding a better outcome than the treatment of interest. In our proof-of-concept, the RMST achieved by SOC was captured at the 1-year and 2-year timelines and was used to represent the percentage of price reduction on osimertinib over the 1-year and 2-year contracts. We showed that the price reduction on osimertinib as estimated from the RMST achieved by SOC over osimertinib in the 1-year and 2-year contracts were located within our suggested range for price reduction estimated from MCS (−risk of efficacy failure% to 0%).
We showed that the payback from the RMST method for OS and PFS, in the two hypothetical contracts, were located within the ranges resulting from the 7-step method. Our 7-step method yielded a higher level of price dispersion than the RMST method mainly because the payback ranges were wider at early stages of using the superior treatment but shrunk over time because the superior treatment lowers the risk risk of efficacy failure over time. In parallel, while the RMST provides for gradual increase in the payback this will eventually reach a steady state, especially when the efficacy curves are reaching zero and touching the x-axis over time.
Locating the RMST within the ranges of our proposed 7-step method is not required to provide payback ranges. The 7-step method generated ranges shrink overtime and the lower bound of payback (- of risk of efficacy failure%) may be equal to or higher than the RMST estimated payback certainly in long term contracting. In such case, the payback ranges are recommended to be using the RMST estimated payback as a lower bound to a range of RMST estimated payback % to zero%.
In the proof-of-concept exercise to osimertinib, in the 1-year contract, the percentage of OS risk failure of osimertinib versus SOC was up to 37.70%, meaning that if 100 patients received osimertinib, up to 37.70% might have benefited more from SOC than from osimertinib. Thus, the adjustment for the price of osimertinib was made as a deduction of −37.70% to 0%. This range was also subjected to inflation of 0.44% projected over the 1-year contract (2019–2020). In the 2-year contract, the risk captured at the end of 2 years was up to 35.85%. This means that the price adjustment was made as a deduction from −35.85% to 0% and inflated by 0.72%.
In the 1-year contract, the percentage of PFS risk failure of osimertinib versus SOC was up to 18.55%, meaning that if 100 patients received osimertinib, up to 18.55% might have benefited more from SOC than from osimertinib. Thus, adjustment for the price of osimertinib was made as a deduction of −18.55% to 0% and inflated by 0.44% projected over 1-year contract (2019–2020). In 2-year contract, the risk captured at the end of 2 years was up to 10.00%. Thus, adjustment for the price of osimertinib was made as a deduction of −10.00% to 0% and inflated by 0.72%.
Our proof-of-concept exercise has four important implications for our general concept of pricing based on treatment efficacy failure. First, considering the two efficacy measures, osimertinib was subjected to a greater price reduction when OS data rather than with PFS data were compared. The probability of OS is higher than the probability of PFS, hence osimertinib holds a higher risk of efficacy failure in OS than in PFS; PFS is a combined probability that includes probabilities of preventing any case from progression or death, whereas OS includes only the probability of preventing any case from death. Second, the risk of efficacy failure declines over time for OS and PFS which is related to superior OS and PFS rates for osimertinib over the SOC. Indirectly, this confirms the statistically significant hazard ratios of OS and PFS reported in the FLAURA trialCitation6. Osimertinib was associated with higher risk of efficacy failure in the early stages of treatment, but this risk declined as treatment continued for longer durations. Third, this reduction in the risk of osimertinib efficacy failure overtime translates into a declining payback overtime for this treatment. Fourth, from a payer perspective, despite lower payback over time for osimertinib, using this approach for outcome-based contracting for osimertinib may offer better price points. This also could be of value from the manufacturer perspective, as in this case contracting over two years might be associated with higher revenue than with shorter durations.
The importance of our proposed method of treatment failure-based pricing-independently or, preferably, as part of our six-dimentional platform for outcome-based contracting-is underscored by the intense debate about novel and appropriate approaches to reconcile financial risk with clinical benefitCitation12. The payback suggested in our method is evidence based, not volume-based. Our methodology accommodates the pricing freedom in the US, which also being applicable in more homogenous pharmaceutical markets. It focuses on a treatment of interest as an advance over the prevailing methods of treatment and not on two presumably similar treatments where cost rather than efficacy in the differentiator. In addition to applying statistical method from engineering to quantify treatment failureCitation13,Citation14, we also approached all cost and benefit estimations probabilistically using MCS. This enabled us to step away from the overgeneralization of treatment superiority and incorporate the uncertainty associated with both patient and heterogeneity and inherent randomness.
Our study has several strengths. Our concepts are plausible, and our methods are transparent. The concept of financial risk associated with the decision to reduce a price of a treatment is clearly represented in the methods. The statistical methods have been used in other applications but were innovatively reformulated to provide more information about the treatment risk of losing superiority. We introduced the term “risk of superiority failure” on the basis for our proposed method for evidence-based price assessment. We focused on a treatment’s efficacy value relative to the prevailing treatment, not on between treatment alternatives of similar efficacy. We validated our 7-step method by estimating the integral-based RMST for comparator treatment as a basis for price adjustment. Lastly, our methodology integrates well into our six-dimensional platform for outcome-based contracting.
Some limitations are acknowledged. The method of pricing based on selected efficacy endpoints may be affected by selection bias. Using surrogate endpoints like the PFS in our proof-of-concept may be debatable; though, arguably, surrogate endpoints complement primary endpoints. We suggest considering expert opinion when specifying inclusion and exclusion criteria (Supplemental Material). Our proof-of-concept used clinical trial data and needs to be replicated in time with real-world data. Using data from varying sources may provide additional information needed to support prices. The DSPRisk of efficacy failure estimates are likely to be influenced by the distribution curves used to predict efficacy measures. In the proof-of-concept exercise, we used Weibull distribution; however, our 7-step method can integrate other DSPsRisk of efficacy failure as additional scenarios.
Conclusion
In this era of outcome-based contracting, methods of pricing based on the financial risk associated with the risk of treatment efficacy failure are critical. We proposed a 7-step method to assess the risk of treatment efficacy failure by quantifying the risk of losing superiority and using that magnitude as a basis for a payback. Using other dimensional prices, as per our platform, might offer additional insights to the information needed about drug pricing.
Transparency
Declaration of funding
The work reported herein was performed without sponsorship or grant funding.
Declaration of funding/other interests
The authors have no financial relationships to declare.
JME peer reviewers on this manuscript have no relevant financial or other relationships to disclose.
Author contributions
All named authors meet the International Committee of Medical Journal Editors (ICMJE) criteria for authorship of this manuscript.
JME-2020-0097-RT.R1_SUPPLEMENT_CATS.docx
Download MS Word (4 MB)Acknowledgements
We thank Elmira Torabzadeh, Dillon Aberasturi, Yingying Lu, Jian Dai, from the College of Public Health, University of Arizona, for validating the mathematical equations and performing independent revisions for the assumptions, equations, and calculations. Sandipan Bhattacharjee is now at the University of Texas at Austin.
Notes
i Microsoft Excel 365 is a registered trademark of Microsoft Research Lab, Redmond, Washington, DC, USA.
References
- Alkhatib NS, Erstad B, Ramos K, et al. Pricing methods in outcome-based contracting-δ1: cost-effectiveness analysis and cost utility analysis-based pricing. J Med Econ. 2020;23(11):1215–1222.
- Alkhatib NS, Ramos K, Erstad B, et al. Pricing methods in outcome-based contracting-δ2: willingness-to-pay-based pricing. J Med Econ. 2020;23(11):1223–1229.
- Alkhatib NS, Erstad B, Ramos K, et al. Pricing methods in outcome-based contracting-δ3: reference-based pricing. J Med Econ. 2020;23(11):1230–1236.
- Alkhatib NS, Bhattacharjee S, McBride A, et al. Pricing methods in outcome-based contracting-δ4: safety-based pricing. J Med Econ. 2020;23(11):1237–1245.
- Aldous JL, Haubrich RH. Defining treatment failure in resource-rich settings. Curr Opin HIV Aids. 2009;4(6):459–466.
- Soria J, Ohe Y, Vansteenkiste J, et al. Osimertinib in untreated EGFR-mutated advanced non–small-cell lung cancer. N Engl J Med. 2018;378(2):113–125.
- Briggs A, Claxton K, Sculpher M. Decision modelling for health economic evaluation. New York (NY): Oxford University Press; 2011.
- U.S. Bureau of Labor Statistics. Prescription drugs in U.S. city average, all urban consumers, seasonally adjusted; [cited 2020 Aug 26]. Available from: https://data.bls.gov/timeseries/CUSR0000SEMF01?output_view=pct_3mths [Last accessed December 2019].
- Kim DH, Uno H, Wei LJ. Restricted mean survival time as a measure to interpret clinical trial results. JAMA Cardiol. 2017;2(11):1179–1180.
- RedBook Online [subscription database online]. Greenwood Village, CO: Truven Health Analytics, Inc. updated periodically; [cited 2020 Aug 26]. Available from: http://micromedex.com/products/product-suites/clinical-knowledge/redbook [Last accessed December 2019].
- Garrison LP, Towse A, Briggs A, et al. Performance-based risk-sharing arrangements-good practices for design, implementation, and evaluation: report of the ISPOR good practices for performance-based risk-sharing arrangements task force. Value Health. 2013;16(5):703–719.
- Kaltenboeck A, Bach P. Value-based pricing for drugs: theme and variations. JAMA. 2018;319(21):2165–2166.
- Chang F. AUC estimation under various survival models; [cited 2019 Dec 01]. Available from: http://fau.digital.flvc.org/islandora/object/fau%3A4067/datastream/OBJ/view/AUC_estimation_under_various_surrvival_models.pdf.
- Kundu D, Gupta RD. Estiumation of P[Y < X] for Weibull distribution; [cited 2019 Dec 01]. Available from: http://home.iitk.ac.in/∼kundu/paper112.pdf.