
 ?Mathematical formulae have been encoded as MathML and are displayed in this HTML version using MathJax in order to improve their display. Uncheck the box to turn MathJax off. This feature requires Javascript. Click on a formula to zoom.
Abstract
Aim
To assess the long-term cost-effectiveness of an atrial fibrillation disease management program (i.e. the SAFETY program) from the Australian healthcare system perspective.
Methods
A multistate Markov model was developed based on patient-level data from the SAFETY randomized controlled trial. Predicted long-term survival, dependent on hospital admission history, was estimated by extrapolating parametric survival models. Quality-adjusted life years (QALY) and life years (LY) were the primary and secondary outcome measures used to estimate the incremental cost-utility/effectiveness ratio (ICUR/ICER). Both deterministic and probabilistic sensitivity analyses (PSA) were undertaken.
Results
The SAFETY program was associated with both higher costs ($94,953 vs. $78,433) and benefits [QALY (3.99 vs 3.60); LY (5.86 vs 5.24)], with an ICUR of $42,513/QALY or ICER of $26,356/LY, compared to standard care. Due to the extended survival, the SAFETY was associated with a greater number of hospitalizations (14.85 vs 11.65) and higher costs for medications ($25,084 vs $22,402) and outpatient care ($12,904 vs $11,524). The cost per hospitalization for an average length of stay, analytical time horizon, and cost of medication are key determinants of ICUR. The PSA showed that the intervention has a 70.4% probability of being cost-effective at a threshold of $50,000/QALY.
Conclusions
The SAFETY program has a high probability of being cost-effective for patients with atrial fibrillation. It is associated with uncertainty that further research could potentially eliminate; implementation with further evidence collection is recommended.
Introduction
Atrial fibrillation (AF) is the most common form of cardiac arrhythmia observed in medical practiceCitation1 and is associated with detrimental consequences, including heart failure (HF), ischemic stroke, and mortality. It also imposes a great economic burden on society. For example, in Australia, it affects approximately 400,000 people, with aging as a prominent risk factor. In 2014–2015, there were 58,608 hospitalizations for AF as a principal diagnosis (National Hospital Morbidity database), and ∼ 20–25% of patients with AF are admitted to hospital annually. Caring for AF costs the Australian economy over AU$1.25 billion per year through medical costs, long-term care costs for those with a stroke-related disability, and lost productivity outputCitation2,Citation3. Internationally, the Global Burden of Disease studyCitation4 estimated that, in 2010, there were 33.5 million patients with AF in the world, constituting ∼ 0.5% of the total world populationCitation5. The projected worldwide population ageing, combined with an accumulation of cardiovascular diseases and lifestyle risk factors, ensures a likely and dramatic increase in the number of patients with AF (primarily the non-valvular AF, NVAF) in the coming years. Given its prevalence and the severe complications associated with it, AF is considered one of the major threats to cardiovascular healthCitation6.
Management of NVAF includes five components that target different sections of the heart: acute stabilization of patients who present with NVAF complications or hemodynamic compromise; detection and treatment of underlying and accompanying cardiovascular conditions; stroke risk assessment and oral anticoagulation for stroke prevention; rate control; and rhythm control therapy. However, adherence to treatment is generally considered suboptimal. For example, an Australian study found that nearly half of the patients with NVAF did not adhere to the prescribed treatmentCitation7–9, rendering them at higher risk of developing cardiovascular complications, including stroke.
A nurse-coordinated multidisciplinary program has significant potential to promote the management of patients with NVAF, with the role of a NVAF nurse outlined in the most recent European guidelinesCitation10. It could involve a home-based, NVAF-specific management strategy (including greater clinical surveillance and longer-term support) with an aim to optimize antiplatelet/thrombotic treatment, preserve cardiac function, and improve clinical stabilityCitation11. A randomized controlled trial (RCT) of a multidisciplinary disease management program aiming to improve NVAF patients’ adherence to treatment reported that this multicomponent service was associated with proportionately more days alive and out of hospital but observed no impact on all-cause mortality relative to standard management, and a potential to improve poor health outcomes in patients admitted with chronic NVAFCitation12. A within-trial economic analysis was undertaken to assess the short-term cost-effectiveness of this disease management program and showed that, compared with standard management, this intervention is a potentially dominant strategy for NVAF patients (i.e. –$4,375 and 0.02 quality-adjusted life year gains per patient)Citation13. Given that lifetime management is foreseeable for patients with NVAF, ascertaining the long-term cost-effectiveness of this service program would complement its economic credentials and provide a more comprehensive examination of the long-term costs and benefits, which is required if it is to be scaled up to the national level and seek public subsidy.
This study aimed to undertake a modelled economic evaluation for the disease management program that targeted patients with NVAF to assess its long-term cost-effectiveness by extrapolating the patient-level data collected from the SAFETY RCTCitation12.
Methods
SAFETY program
The details of the SAFETY program were reported elsewhereCitation12. Briefly, the SAFETY program was a structured post-discharge intervention delivered by a senior specialist nurse consisting of a home visit 7–14 days after discharge ensued by a series of repeated home visits, scheduled clinical reviews, and telephone follow-up. The aim of the program was to optimize both drug treatment and non-pharmacological management.
Model structure
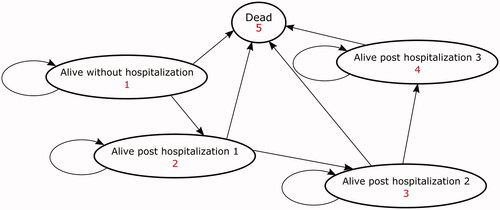
A multi-state Markov model, consisting of five Markov health states, was developed to simulate the long-term health outcome and costs associated with the NVAF disease management program (i.e. the SAFETY program). The five health states were: alive without hospitalization, alive post first hospitalization, alive post second hospitalization, alive post third hospitalization, and dead.
All patients entered the model in the alive without hospitalization state and could then (i) remain event-free; (ii) be hospitalized, or (iii) die due to all causes in quarterly (3-month) cycles. Patients experiencing more than three hospitalizations were aggregated into the “alive post-third hospitalization” health state.
Given that patients requiring frequent hospital care are indicative of persistent and refractory NVAF that can predict the long-term prognosisCitation14, the alive post n number of hospitalizations states (i.e. one, two, or three) were modelled separately to account for this difference. A half-cycle correction was applied to adjust for both costs and benefits (i.e. all transitions were assumed to occur in the middle of the cycle; if patients died during a cycle, only half of the costs and benefits would be accrued). Costs and benefits were discounted at a rate of 5% according to the Australian guideline for preparing submission (including economic evaluation) to the Pharmaceutical Benefits Advisory Committee (the national agency for pharmaceutical reimbursement)Citation15. The model structure is illustrated in . TreeAge software was utilized for the modelling analysis (TreeAge Pro 2019, TreeAge Software, Williamstown, MA).
Figure 1. Illustration of multi-state Markov model.
Modelled population
The modelled population were Australian patients diagnosed with chronic NVAF but not chronic heart failure, according to international guidelinesCitation16. The population characteristics were the same as of those recruited in the RCT: equal proportions of male and female participants with a mean age of 72 years and 90% experiencing persistent NVAF, 64% being managed by a rate-control strategy, and 33% having a co-morbid coronary heart diseaseCitation12. The time horizon was set at 10 years, given the average age of the population modelled. The comparator was the standard care (i.e. current clinical practice in Australia, including routine medical care, hospital care, and pharmacotherapy) for patients with NVAF, which is consistent with the pivotal RCTCitation12. For the standard care arm, patients were managed predominantly by a General Practitioner (GP) in consultation with a specialist doctor and received medications including warfarin, antiplatelet agents, antiarrhythmic drugsCitation12. More recent oral anticoagulants (e.g. apixaban) were not available in Australia during the study period (2010–2012).
Model inputs
Transition probabilities
All the transition probabilities – including probabilities of first hospitalization, recurrent hospitalization, and death due to all causes dependent on number of re-hospitalizations (i.e. overall survival) – were generated from time-to-event analyses using individual patient data (IPD) from the pivotal RCT. For the derivation of transition probabilities over the trial duration (i.e. the minimum follow-up of 2 years), the Kaplan-Meier survival analysis was adopted to estimate the survival function for the first 900 days. Finally, parametric survival analysis was undertaken to base extrapolation of transition probabilities beyond the trial follow-up period.
A multi-state time to event modelling approachCitation17 was adopted to statistically estimate the following transition probabilities:
No further event to first hospitalization;
No further event to death;
Post first hospitalization to second hospitalization;
Post first hospitalization to death;
Post second hospitalization to third hospitalization;
Post second hospitalization to death;
Post third hospitalization to death.
A multistate modelling technique was chosen because (1) it is often used to model complex disease profiles by accounting for competing events at each transition (i.e. a single patient faces the risks of rehospitalization and death simultaneously) and (2) it allows the use of patient-level data, offers flexibility to extrapolate each transition by a variety of parametric models, and possibly enables parameter sharing across transitions. Specifically, the STATA code provided by Crowther and LambertCitation17 was adapted to derive the aforementioned transition probabilities over the SAFETY trial duration.
For the time to death/hospitalization analysis (i.e. transition probabilities i to vii), exponential, Weibull, loglogistic, lognormal, and Gompertz distributions were fitted to the IPD with respect to the particular dataset. The best fit distribution was selected based on predefined criteriaCitation18,Citation19. To estimate the transition probabilities for the within-trial period, the following formula was employed using estimates from Kaplan-Meier survival functionsCitation20:
After 900 days, the SAFETY program and standard care groups were assumed to have identical transition probabilities (i.e. no treatment). All IPD-level analysis was performed by STATA version 15 (StataCorp. Statistical Software: Release 15, College Station, TX: StataCorp LP).
Costs and utility weights
Costs and utility weights were sourced from the trial data, from the perspective of costs to the Australian healthcare system. Correspondingly, those incorporated in the model included costs relating to hospitalization, medications, outpatient care (i.e. visits to primary care physician/specialist, examinations, etc.), and disease management services. The cost due to hospitalization was adjusted by the probability of prolonged/average length of stay (LoS). Since there is no significant between-group difference in the hospitalization cost, the same cost per hospitalization (based on hospitalization presentation diagnostic related group) was applied. Particularly, the average LoS and cost of hospitalization thereof were calculated across the entire sample regardless of randomization status. Then, the probability of prolonged LoS (i.e. proportion of individuals with LoS longer than the average LoS) was derived from the IPD by randomized groups (given that this is significantly different between the groups), whereas the average cost of hospitalization for a prolonged LoS was computed across all individuals with prolonged LoS irrespective of their group status. All costs were valued in the year 2018 and corresponding consumer price indices (CPI) from the health sector were used to inflate the costs not derived from 2018.
Disutility associated with hospitalization was derived from the trial data. In order to derive the utility decrement associated with repeated rehospitalizations, a regression analysis of utility at 24 months was undertaken with number of rehospitalizations as the predictor (i.e. entered as dummy variable) regardless of randomized groups. The quality-adjusted life years (QALY) were then estimated based on the utility weights attached to the health states multiplied by the time spent in each health state. The life years (LY) gained were also calculated. Since no adverse effects associated with this management program intervention were reported, no costs in relation to adverse effects were included in the model. The unit costs and utility weights are summarized in .
Table 1. Costs and utility weight used in the model.
Cost-utility and cost-effectiveness analysis
Cost utility analysis was undertaken by calculating the incremental cost-utility ratio (ICUR) from the difference in costs divided by the difference in QALY for the SAFETY program vs the standard care. Similarly, the incremental cost-effectiveness ratio (ICER) was also estimated using LY gain as the outcome measure. The often-quoted willingness-to-pay per QALY/LY of $50,000 in Australia was utilized to assess the cost-effectiveness of the interventionCitation21.
Sensitivity analysis
Deterministic (DSA) and probabilistic sensitivity analyses (PSA) were performed to test the robustness of base case results. For DSA, a series of one-way sensitivity analyses were undertaken by varying key model parameters within a range (based on the best available evidence or assumptions). The results from the one-way sensitivity analyses are shown as Tornado diagrams, sequentially graphing the variable with the largest impact on the cost-utility results. PSA was performed to assess the overall impact of uncertainty in the model by defining distributions for the key parameters (i.e. variables regarding transition probabilities, utilities, and costs). The uncertainty around parameters (i.e. lambda for an exponential distribution; lambda and gamma for a Gompertz distribution) defining the parametric survival functions was also examined by incorporating the distribution for these parameters. Finally, 5,000 iterations (i.e. second-order Monte Carlo simulation) were run to construct a mean and 95% credible interval (CI) for the corresponding cost and benefit, and the results were plotted on a cost-effectiveness plane and cost-effectiveness acceptability curve.
Value of perfect information
The uncertainty in the results was further examined using the value of information technique to quantify the expected value of perfect information (EVPI). The EVPI denotes a theoretical monetary value from future research that would remove all measured uncertainty included in the analysis (e.g. parameter uncertainty around transition probability, cost, and utility weights)Citation22. The EVPI per person is calculated as the difference between the net monetary benefit (NMB, which represents the value of an intervention in monetary terms with a positive value indicating the intervention being cost-effective) of the proposed intervention across all iterations (i.e. all sampled iterations from PSA) and the NMB of each individual iteration (i.e. one sampled iteration). For example, if 5,000 iterations (i.e. 5,000 sampled estimates per parameter from a single distribution) are run for the PSA and the NMB from one single iteration is the same as the overall average NMB (i.e. mean of all iterations), its EVPI value is zero. However, when these two NMBs are not identical, there is some value to eliminating the uncertainties being simulated (i.e. the difference between the iteration NMB and the mean NMB). The total EVPI is then estimated by multiplying the per-person EVPI by the estimated number of incident NVAF hospital admissions (i.e. 35,000 in Australia per annumCitation3,Citation23) and the useful life of the new technology (in this case, the assumed minimum number of years the NVAF disease management program is likely to be standard practice, 4 years) with the value that accrues in future years discounted at 5%Citation21.
Results
Transition probabilities and costs
The transition probability over the trial duration was directly calculated from the corresponding Kaplan-Meier curve (Supplementary Figures S1–S3). As to the long-term extrapolation, except for transition probability ii (where the Gompertz distribution was selected), the exponential distribution was chosen to extrapolate the long-term transition probabilities. Details on the parametric survival analysis and model selection for extrapolation are provided in and and Supplementary Figures S4–S7. Intervention membership-specific transition probabilities were employed regardless of significance in between-group differences. The transition probabilities for the trial duration are detailed in Supplementary Table S1.
Table 2. Results of model fitness for the parametric survival analyses.
Table 3. Parameters for the parametric survival models applied for the long-term extrapolation.
Cost-utility and cost-effectiveness analysis
The base case result showed that the SAFETY program was associated with both higher costs ($16,520) and greater benefits (0.39 QALY and 0.62 LY gains, respectively), compared to the standard care group. The total cost of care for patients with NVAF was $94,953 in the SAFETY program vs $78,433 in standard care groups, which included total cost of hospitalizations ($56,377 vs $44,506), medications ($25,084 vs $22,402), and outpatient care ($12,904 vs $11,524). With regard to the outcome measure, subjects from the SAFETY program arm achieved both greater QALY (3.99 vs 3.60) and LY (5.86 vs 5.24) gains. However, due to the marginally longer quality-adjusted survival (i.e. 0.63 LY ≈ 7.6 months), patients assigned to the SAFETY program are likely to have more hospitalizations (≈ 3 hospitalizations). Finally, the ICUR and ICER are $42,513/QALY and $26,356/LY, respectively, which suggests the SAFETY program is cost-effective for patients with NVAF from an Australian healthcare perspective over a life-time horizon ().
Table 4. Results of base case and probabilistic sensitivity analyses.
Sensitivity analysis
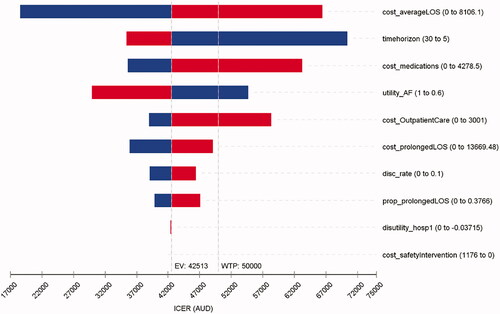
The DSA showed that the ICUR was sensitive to the cost of hospitalization due to average LoS, time horizon, cost of medication, and outpatient care. Utility of NVAF, utility decrement of hospitalization, and discount rate also contributed to the variation in ICUR to a lesser extent (). The DSA for the effectiveness outcome (i.e. LY) suggested that the ICER was most sensitive to the cost of hospitalization due to average LoS and the time horizon (Supplementary Figure S8).
Figure 2. Tornado diagram for a series of one-way deterministic sensitivity analysis (QALY as the outcome measure).
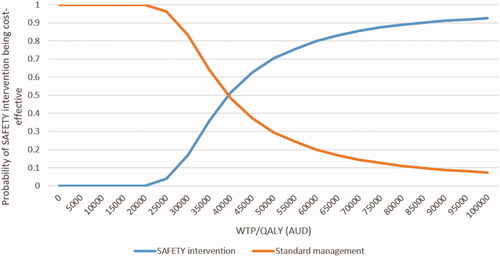
Generally, the results from the PSA were comparable to the base case analysis (). The incremental cost-effectiveness plane () showed that the SAFETY program has a probability of 70.4% of being cost-effective compared to the standard care at a WTP/QALY threshold of $50,000. The cost-effective acceptability curve () suggested that if the WTP/QALY threshold is greater than $75,000 the intervention has a high likelihood (>90.7%) of being a cost-effective intervention for patients with NVAF.
Figure 3. Incremental cost-effectiveness plane for QALY as the outcome measure.
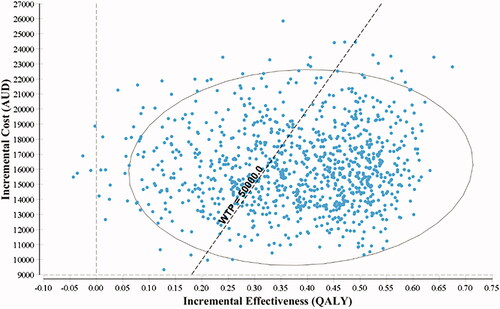
Figure 4. Cost-effectiveness acceptability curve (QALY as the outcome measure). Abbreviations. AUD, Australian dollar; QALY, quality adjusted life year; WTP, willingness to pay.
Value of perfect information
By incorporating all parameter uncertainty in terms of transition probabilities, costs and utility weights, the total value of perfect information for the SAFETY program amounted to $217 million and, in contrast, the NMB was $14 billion over the same period. Where the cost of further research is likely to be less than $217 million, it is suggestive that further research is warranted. However, given the positive and large NMB (including the opportunity cost associated with delaying implementation of a service that provides patient survival gain), implementation with further evidence collection is the recommended strategyCitation24.
Discussion
The results from this modelled economic evaluation show that the SAFETY program has a high probability (>70.4%) of being cost-effective in patients with NVAF from the Australian healthcare system perspective. Its implementation is associated with both higher cost and greater benefits. Due to the increased life expectancy, which may be attributed to better management of NVAF via improved prescription of evidence-based treatment and compliance to the treatment plan (similarly to a disease management program that benefited patients with HFCitation25) patients who received the SAFETY program are likely to incur greater costs in terms of hospitalization, medication, and outpatient care. The total estimated NMB is $14 billion through monetizing the increased health benefits (i.e. QALY), which shows the significant potential gains for society via implementation of this health service in Australia. Meanwhile, the estimated value of perfect information is $217 million, which indicates the potential gain from further research to reduce the uncertainty in the current results. Although there is value in undertaking further research to eliminate this uncertainty, delaying access to the favorable intervention might also undermine the health benefits of potential patients. In this regard, even though the uncertainty of the estimates is not negligible and warrants future research, the opportunity cost of delaying or, indeed, not actioning these measures (i.e. loss of extended survival) could justify their immediate implementation.
For a modelled economic analysis, an intervention’s effect and the extrapolation of that effect beyond the trial duration (which underpins the transition probability across modelled health states) is a key determinant of the modelled outcome. Conventionally, the transition probability is derived from the aggregated outcome of the trial and then extrapolated or assumed to be constant beyond the trial durationCitation19. The transition probabilities among health states presented in this study were based on the individual patient-level information and made the maximum use of trial data. The unobserved and unknown covariance between variables are inherently captured in such data; thus, the derived transition probability has taken competing risks into consideration (i.e. the patient faces the risk of rehospitalizations and death simultaneously). In addition, patients can have a time-varying mortality after each hospitalization event. For example, if the patient remains hospitalization-free, the mortality of that health state should vary with time (decreasing with time initially and then eventually increasing with time and age). Use of the trial-based individual patient-level data confers the advantage of taking this into account. For the first 900 days, all the transition probabilities were derived from the trial by counting the number of patients that had transitted to a certain health status at various time points. Survival beyond those 900 days was estimated with the parametric survival analysis method. Likewise, the model parameters for cost and utility weights were also generated from the SAFETY trial data. This achieved the best outcome in terms of internal validity.
Given the ageing population worldwide, the prevalence of NVAF is expected to escalate over time. Multidisciplinary management programs that promote the prescription of and adherence to evidence-based treatment are needed, as the management of NVAF is complex and multilayeredCitation26. Whilst the SAFETY program was only delivered after the index hospitalization, the intervention’s effect was measured at a minimum follow-up time of 24 months. If such an intervention is implemented in the real world, it is highly likely that the patients discharged from another hospitalization will receive the SAFETY program again, which, in theory, could further improve the cost-effectiveness of this intervention. The main benefit from the SAFETY program is the extended survival but not avoided hospitalizations, and such a trend was observed during the trial period (supplementary figures A1 and A2 of Stewart et al.Citation12) An interesting finding from the DSA is that the more the cost of prolonged hospitalization decreased, the higher the resultant ICUR would be. This is because the SAFETY program was associated with a lower probability of extended hospital stay (see table 1 of Stewart et al.Citation12) Medicare Australia has dedicated items (item numbers 721 and 723) for chronic disease management to enable a GP to plan and coordinate multidisciplinary, team-based healthcare. However, this is not specifically designed for the management of patients with atrial fibrillation and there are still gaps in the care provision to improve the outcome of people with NVAF.
We believe this is the first modelled economic evaluation assessing the long-term cost-effectiveness of a multidisciplinary management program for patients with NVAF. An Australian study reported cost saving of weight and risk-factor management programs in patients with NVAF where the focus was not to improve adherence to NVAF-related treatmentCitation27. In contrast, economic evaluations of services for patients with HF are plentiful. These services include remote monitoring programs involving a HF nurse, HF nurse-led clinics, and HF disease management programs. In terms of the cost-effectiveness of these services, Gohler et al.Citation28 found that HF disease management programs increased quality-adjusted life expectancy by an average of 0.19 years and increased the lifetime costs by €1,700, with a corresponding ICER of €8,900/LY. Another study reported that HF programs extended the average life expectancy by 0.55 years with an additional cost of US$5,300 per patient (ICER of US$9,700/LY) and the PSA calculated the mean ICER as US$12,882/LYCitation29. The service components incorporated into these programs targeted for HF and NVAF are highly similar. For example, they unanimously included promotion of pharmacological treatment as per guidelines and non-pharmacological management, provision of post-discharge care, prescription of repeat examinations, and review management plansCitation5. Although these results are not directly comparable (since the applied populations are different), they indeed suggest that disease management programs could be a cost-effective approach to patients with chronic heart conditions and ongoing care needs.
There are other integrated care models for NVAF like the Atrial fibrillation Better Care (ABC) pathway program that included stroke avoidance, symptom management, and cardiovascular and other comorbidities managementCitation30–33. On the other hand, the SAFETY program which aimed to optimize the pharmacological treatment and management post-hospital discharge with a transitional care focus differs to the ABC pathway that provides an integrated care model for ongoing management. However, these two care models can potentially be synchronized to provide continuity in the care of patients with NVAF post-discharge and for ongoing management.
This study is not without limitations. First, the trial only followed patients for a median of 905 days (interquartile range = 773–1050). Extrapolation is necessary for post-intervention survival for different health states. However, the recommended approaches were adopted to undertake this analysis and the comparable results between the modelled and observed overall survival can ease this concern to some extent. Second, the utility weight of NVAF was derived from the SAFETY trial and may not be the true utility weight due to an insufficient sample size. Sensitivity analysis was performed to examine this uncertainty. Third, perhaps most importantly, the transition probability for the fourth and subsequent rehospitalization was not estimated and was assumed to be the same for the remaining time horizon. This is due to the insufficient number of patients experiencing more than four hospitalizations during the observation period, which did not permit a reliable estimation of these transitions. However, since the non-group-specific transition probabilities were applied beyond the fourth rehospitalization, this is considered conservative and not to favor the SAFETY program. Last, the almost-3-year trial did find a trend in survival gain between SAFETY and standard care; the longer-term modelled results projected that patients who received the SAFETY program were likely to have better survival than those managed by the standard care. However, the projected survival benefit warrants confirmation via longer-term study. Given the clinical need for better management of patients with AF, the SAFETY program can be implemented in real-world practice, but the key area of uncertainty (i.e. what is identified from sensitivity analyses) requires continuous monitoring and evaluation.
Conclusions
The SAFETY program has a high probability of being a cost-effective program to manage patients with NVAF in the Australian healthcare system. Although it is associated with uncertainty that further research could potentially eliminate, the current clinical needs warrant its implementation with further evidence collected, particularly as it has the potential to extend a patients days alive and out of hospital.
Transparency
Declaration of funding
The SAFETY Study was funded by a National Health and Medical Research Council of Australia Program Grant [519823].
Declaration of financial/other interests
All authors confirm that there is nothing to declare.
JME peer reviewers on this manuscript have no relevant financial or other relationships to disclose.
Supplemental Material
Download MS Word (289.3 KB)Acknowledgements
None reported.
Related Research Data
References
- Ball J, Thompson DR, Ski CF, et al. Estimating the current and future prevalence of atrial fibrillation in the Australian adult population. Med J Aust. 2015;202(1):32–35.
- Atrial Fibrillation Association Australia. Atrial Fibrillation (AF) Patient Information. 2013.
- PricewaterhouseCoopers. The Economic Costs of Atrial Fibrillation in Australia. 2010.
- Chugh SS, Havmoeller R, Narayanan K, et al. Worldwide epidemiology of atrial fibrillation: a Global Burden of Disease 2010 Study. Circulation. 2014;129(8):837–847.
- Kirchhof P. The future of atrial fibrillation management: integrated care and stratified therapy (vol 390, pg 1873, 2017). Lancet. 2017;390(10105):1832–1873.
- World Health Organisation. Global action plan or the prevention and control of noncommunicable diseases 2013–2020. 2013; [cited 2019 Feb 25]. Available from: http://apps.who.int/iris/bitstream/10665/94384/1/9789241506236_eng.pdf.
- Obamiro KO, Chalmers L, Lee K, et al. Adherence to oral anticoagulants in atrial fibrillation: an australian survey. J Cardiovasc Pharmacol Ther. 2018;23(4):337–343.
- Potpara TS, Lane DA, Lip GY. Optimizing stroke prevention in atrial fibrillation: better adherence and compliance from patients and physicians leads to better outcomes. Europace. 2015;17(4):507–508.
- Andrade JG, Macle L, Nattel S, et al. Contemporary atrial fibrillation management: a comparison of the current AHA/ACC/HRS, CCS, and ESC guidelines. Can J Cardiol. 2017;33(8):965–976.
- Hindricks G, Potpara T, Dagres N, et al. 2020 ESC Guidelines for the diagnosis and management of atrial fibrillation developed in collaboration with the European Association of Cardio-Thoracic Surgery (EACTS): The Task Force for the diagnosis and management of atrial fibrillation of the European Society of Cardiology (ESC) Developed with the special contribution of the European Heart Rhythm Association (EHRA) of the ESC. Euro Heart J. 2020;ehaa612.
- Maru S, Byrnes J, Whitty JA, et al. Systematic review of model-based analyses reporting the cost-effectiveness and cost-utility of cardiovascular disease management programs. Eur J Cardiovasc Nurs. 2015;14(1):26–33.
- Stewart S, Ball J, Horowitz JD, et al. Standard versus atrial fibrillation-specific management strategy (SAFETY) to reduce recurrent admission and prolong survival: pragmatic, multicentre, randomised controlled trial. Lancet. 2015;385(9970):775–784.
- Byrnes J, Ball J, Gao L, et al. Within trial cost-utility analysis of disease management program for patients hospitalized with atrial fibrillation: results from the SAFETY trial. J Med Econ. 2019;22(9):945–952.
- Altman RK, Proietti R, Barrett CD, et al. Management of refractory atrial fibrillation post surgical ablation. Ann Cardiothorac Surg. 2014;3(1):91–97.
- Pharmaceutical Benefits Advisory Committee. Guidelines for preparing submissions to the Pharmaceutical Benefits Advisory Committee (PBAC). (Version 5.0), 2016. Canberra: Commonwealth of Australia; 2016.
- Camm AJ, European Heart Rhythm A, European Association for Cardio-Thoracic S, et al. Guidelines for the management of atrial fibrillation: the Task Force for the Management of Atrial Fibrillation of the European Society of Cardiology (ESC). Eur Heart J. 2010;31(19):2369–2429.
- Crowther MJ, Lambert PC. Parametric multistate survival models: flexible modelling allowing transition-specific distributions with application to estimating clinically useful measures of effect differences. Stat Med. 2017;36(29):4719–4742.
- Latimer NR. Survival analysis for economic evaluations alongside clinical trials-extrapolation with patient-level data: inconsistencies, limitations, and a practical guide. Med Decis Making. 2013;33(6):743–754.
- Williams C, Lewsey JD, Mackay DF, et al. Estimation of survival probabilities for use in cost-effectiveness analyses: a comparison of a multi-state modeling survival analysis approach with partitioned survival and markov decision-analytic modeling. Med Decis Making. 2017;37(4):427–439.
- Briggs A, Sculpher M, Claxton K. Decision modelling for health economic evaluation. Oxford: OUP; 2006.
- Wang S, Gum D, Merlin T. Comparing the ICERs in medicine reimbursement submissions to NICE and PBAC-does the presence of an explicit threshold affect the ICER proposed? Value Health. 2018;21(8):938–943.
- Hubbard D. How to measure anything: finding the value of intangibles in business. Hoboken: John Wiley & Sons; 2007.
- Katzenellenbogen JM, Teng TH, Lopez D, et al. Initial hospitalisation for atrial fibrillation in Aboriginal and non-Aboriginal populations in Western Australia. Heart. 2015;101(9):712–719.
- Chalkidou K, Lord J, Fischer A, et al. Evidence-based decision making: when should we wait for more information? Health Aff. 2008;27(6):1642–1653.
- Huynh QL, Whitmore K, Negishi K, et al. Influence of risk on reduction of readmission and death by disease management programs in heart failure. J Card Fail. 2019;25(5):330–339.
- Hendriks JML, de Wit R, Crijns HJGM, et al. Nurse-led care vs. usual care for patients with atrial fibrillation: results of a randomized trial of integrated chronic care vs. routine clinical care in ambulatory patients with atrial fibrillation (vol 33, pg 2692, 2012). European Heart Journal. 2013;34(6):408–408.
- Pathak RK, Evans M, Middeldorp ME, et al. Cost-effectiveness and clinical effectiveness of the risk factor management clinic in atrial fibrillation: the CENT study. JACC: Clin Electrophysiol. 2017;3(5):436–447.
- Gohler A, Conrads-Frank A, Worrell SS, et al. Decision-analytic evaluation of the clinical effectiveness and cost-effectiveness of management programmes in chronic heart failure. Eur J Heart Fail. 2008;10(10):1026–1032.
- Chan DC, Heidenreich PA, Weinstein MC, et al. Heart failure disease management programs: a cost-effectiveness analysis. Am Heart J. 2008;155(2):332–338.
- Proietti M, Lip GYH, Laroche C, et al. Relation of outcomes to ABC (Atrial Fibrillation Better Care) pathway adherent care in European patients with atrial fibrillation: an analysis from the ESC-EHRA EORP Atrial Fibrillation General Long-Term (AFGen LT) Registry. Europace. 2020;euaa274.
- Proietti M, Romiti GF, Olshansky B, et al. Improved outcomes by integrated care of anticoagulated patients with atrial fibrillation using the simple ABC (Atrial Fibrillation Better Care) pathway. Am J Med. 2018;131(11):1359–1366.e6.
- Lip GYH. The ABC pathway: an integrated approach to improve AF management. Nat Rev Cardiol. 2017;14(11):627–628.
- Proietti M, Romiti GF, Olshansky B, et al. Comprehensive management with the ABC (Atrial Fibrillation Better Care) pathway in clinically complex patients with atrial fibrillation: a post hoc ancillary analysis from the AFFIRM trial. JAHA. 2020;9(10):e014932.