
Abstract
Aims
To describe healthcare resource utilization (HRU) and costs in patients with myelodysplastic syndromes (MDS) treated with hypomethylating agents (HMA) based on HMA-treatment response.
Materials and methods
SEER-Medicare data (January 2006–December 2016) were used to identify adults diagnosed with MDS (SEER: January 2009–December 2015) initiated on HMA (index date). HMA-treatment success (indicators: ≥7 HMA cycles, stem cell transplantation, and transfusion independence) or failure (indicators: acute myeloid leukemia [AML], AML-like treatment, and death) was determined using a claim-based algorithm. HRU and costs were assessed from the index date to 1-year post-index, overall and stratified by HMA-treatment success or failure. Among patients with HMA-treatment failure, HRU and costs were also assessed from failure to 1-year post-failure.
Results
The study included 3,046 patients (mean age: 77.4 years; females: 36.8%). Rates of HMA-treatment success and failure were 44.4% and 76.2%, respectively (20.6% had HMA-treatment success then failure). Overall, patients had 15.2 inpatient admissions per-100-patients-per-month (median follow-up: 5.9 months). Patients with HMA-treatment success had 7.5 inpatient admissions per-100-patients-per-month (median follow-up: 12.0 months), while those with HMA-treatment failure had 20.4 and 35.3 admissions per-100-patients-per-month pre- and post-HMA-treatment failure, respectively (median follow-up: 4.3 and 1.8 months, pre- and post-HMA-treatment failure, respectively). Mean total healthcare costs were $12,494 per-patient-per-month overall, $8,069 per-patient-per-month among patients with HMA-treatment success, and $13,809 and $19,242 per-patient-per-month pre- and post-HMA-treatment failure, respectively. Outpatient costs (68.3%) were the main contributor of total healthcare costs overall, while inpatient costs (80.3%) were the main cost driver post-HMA-treatment failure.
Limitations
Without available laboratory test results, clinical indicators observed in claims were used to assess HMA-treatment response.
Conclusions
Over 75% of patients with MDS failed HMA-treatment within 6 months of initiation and were observed with more inpatient admissions than those with HMA-treatment success, translating into substantially higher healthcare costs. HMA-treatment failure results in an important economic burden in MDS patients.
JEL classification codes:
- H51 – Government Expenditures and Health
- H5 – National Government Expenditures and Related Policies
- H – Public Economics
- I11 – Analysis of Health Care Markets
- I1 – Health
- I – Health
- Education
- and Welfare
- I15 – Health and Economic Development
- I1 – Health
- I – Health
- Education
- and Welfare
- I10 – General
- I1 – Health
- I – Health
- Education
- and Welfare
Introduction
Myelodysplastic syndromes (MDS) are a heterogeneous group of disorders that result in various degrees of cytopenias, bone marrow failure, and a risk of progression to acute myeloid leukemia (AML)Citation1. Following diagnosis, the World Health Organization (WHO) criteria are used to classify MDS into histologic subtypes, and prognostic staging assigns a risk score that is used to guide treatment (with the Revised International Prognostic Scoring System [IPSS-R] being one of the most widely used prognostic scoring systems)Citation2,Citation3. Patients diagnosed with MDS, particularly those with intermediate- to very-high-risk MDS disease (based on the IPSS-R; collectively classified as a higher-risk group), have a dismal overall survival of approximately 1 yearCitation4,Citation5, and once the disease progresses to AML, the prognosis is unfavorable, with an overall survival as short as 9 monthsCitation6. The prevalence of MDS increases with age, and it is most commonly diagnosed in individuals over 70 yearsCitation7,Citation8.
Allogeneic stem cell transplantation (SCT) is the only curative option for MDS, and is strongly recommended by the National Comprehensive Cancer Network (NCCNFootnotei) for eligible patientsCitation9. However, given that MDS primarily affects the elderly, factors such as comorbidities, age, and donor availability limits eligibility for an SCT procedure for a significant proportion of patientsCitation10,Citation11. In patients with higher-risk MDS ineligible for SCT, the standard of care is currently the hypomethylating agents (HMA), azacitidine and decitabineCitation9, based on clinical trials that show an improvement in overall survivalCitation6,Citation12–14. However, the rate of HMA-treatment response remains lowCitation14,Citation15 with less than 17% of patients reported to achieve complete remission following HMA treatmentCitation12,Citation13,Citation16, and the majority of responders subsequently experience a loss of response and disease progressionCitation17.
Previous studies have demonstrated the significant economic burden associated with MDSCitation18,Citation19, and the magnitude of MDS-related 5-year costs was estimated to be higher than the previously reported costs for any of the 18 most comparable prevalent cancers in the United States (US)Citation19. The mean total healthcare costs were estimated to be $17,361 per-patient-per-month (PPPM; 2015 US dollars [USD]) in higher-risk MDS patients receiving MDS-related treatment in commercial data, and costs for patients who progressed to AML or died were twice those observed in patients without evidence of progression or deathCitation20. Moreover, another study assessed costs related to MDS treatment failure in patients using HMA and estimated that the mean MDS/AML-related total cost of care was $76,945 during the first 6 months post-failure from 2009 to 2012Citation21.
While HMA remain the standard of care for patients with MDS, new treatments are currently under investigation. Given the limited response in patients with MDS treated with HMA, a comprehensive understanding of the most recent available real-world data on HMA-treatment outcomes, including the healthcare resource utilization (HRU) and costs based on HMA-treatment success or failure in patients with MDS, is necessary. This study builds on a previous model suggested by Cogle et al.Citation21 and refines the algorithm used for identifying HMA-treatment success and failure based on claims data, with additional consideration for the presence and sequence of important indicators of treatment success and failure derived from observations in clinical practice. This assessment will provide important context for identifying opportunities to evaluate the potential benefits of upcoming treatment options for MDS.
Methods
Data source
The study was conducted among Medicare beneficiaries using two databases linked at the patient level, the Surveillance, Epidemiology, and End Results (SEER)-Medicare database, which is composed of the US National Cancer Institute SEER database containing cancer cases (data spanning from 1st January 2006 to 31st December 2015) and the Medicare claims database including Parts A and B (data spanning from 1st January 2006 to 31st December 2016); since HMA treatment is administered in an outpatient (OP) setting, Part D (drug events) eligibility was not required for this study to maximize the sample size considering that approximately 40% of Medicare beneficiaries are not covered by Part DCitation22,Citation23. The SEER Program is frequently used to study population-level outcomes as it collects data from population-based cancer registries covering approximately 35% of the US populationCitation24 and 95% of individuals ≥65 years old reported by the SEER registries are matched with Medicare enrollment recordsCitation25. Given that 80% of patients with MDS in the US are ≥65 years oldCitation7,Citation26, the SEER-Medicare database provides a large data source for the assessment of HRU and costs among patients with MDS and has a wide generalizability as analyses are able to capture a representative sample of patients from various census regions in the US. An exemption from the Institutional Review Board was obtained by the New England Independent Review Board.
Study design
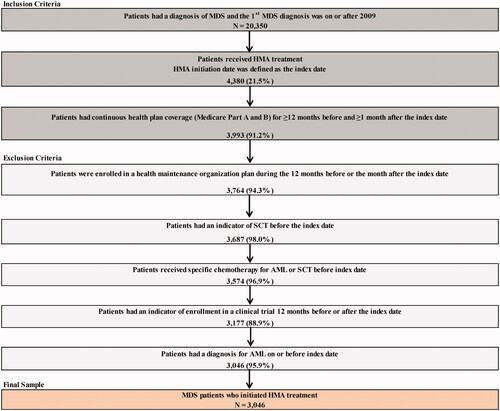
This study used a retrospective cohort design and included adult patients with a confirmed diagnosed of MDS between 1st January 2009 and 31st December 2015 in the SEER database (i.e. following the 2008 updated WHO criteria for classification of MDS in collaboration with the European Association of Hospital Pharmacists), who were initiated on HMA treatment with azacitidine or decitabine in the Medicare claims (). The date of HMA-treatment initiation was termed the index date. The 12 months preceding the index date was defined as the baseline period, and the follow-up period spanned the time from the index date to the earliest of the start of HMO coverage (i.e. Medicare Part C), end of health plan enrollment (i.e. Medicare Parts A and B), end of data availability (i.e. 31st December 2016), or death. This study was conducted prior to the approval of the oral combination decitabine-cedazuridine for the treatment of higher-risk MDSCitation22, and therefore does not capture the impact of the use of this novel therapeutic option for MDS.
Figure 1. Sample selection. Abbreviations. AML, Acute Myeloid Leukemia; EAHP, European Association of Hospital Pharmacists; HMA, Hypomethylating Agent; MDS, Myelodysplastic Syndromes; SCT, Stem Cell Transplantation. Data Source. SEER-Medicare data databases: Available from Q1/2006 to Q4/2015 for the SEER database and from Q1/2006 to Q4/2016 for Medicare database. Note: Only patients first diagnosed after 1st January 2009 were included to take into account the incorporation of important revisions made by the WHO (in collaboration with EAHP) to the MDS and AML classification in 2008 (i.e. 20% blast threshold).
Outcomes
In order to assess the study objectives, a claims-based algorithm was developed to classify patients in terms of HMA-treatment success or failure. Indicators of clinical HMA-treatment success or failure, selected based on observations from clinical practice, were observed up to 12 months post-index or until the first event between SCT or the end of follow-up period (). Indicators of clinical HMA-treatment success, mainly related to potential manifestations denoting response to HMA, included ≥7 cycles of any HMA, SCT, or blood transfusion independence, defined as transfusion interruption ≥56 consecutive daysCitation16. Indicators of clinical HMA-treatment failure, mainly related to disease progression, management of disease progression, or potential manifestations that the patient stopped responding to HMA, included initiation of chemotherapy other than HMA for MDS (AML-like treatment, such as hydroxyurea, cytarabine, or gemcitabine), diagnosis of AML, death, resumption of blood transfusion post blood transfusion independence, or HMA-treatment discontinuation, defined as ≥60 consecutive days without any HMA treatment and no other indicators.
Figure 2. HMA-treatment Success OR failure status among patients with MDS. Abbreviations. AML, Acute Myeloid Leukemia; HMA, Hypomethylating Agent; MDS, Myelodysplastic Syndromes; SCT, Stem Cell Transplantation.
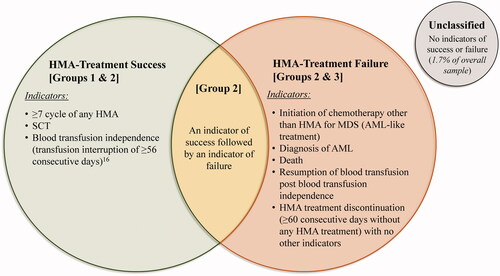
Based on the sequence of indicators of clinical HMA-treatment success and/or failure observed during the 12 months post-index, and on observations from the clinical practice when such patterns are observed, patients were classified into the following subgroups: (A) HMA-treatment success: patients with only indicators of clinical treatment success (indicative of patients with a potential response; Group 1), or an initial indicator of success followed by indicator(s) of failure (indicative of patients with a potential relapse; Group 2); or (B) HMA-treatment failure: patients with at least one indicator of clinical treatment failure, regardless of the presence of indicators of clinical treatment success (Group 3, also including Group 2). The proportion of unclassified patients with no clinical HMA-treatment indicators was marginal and accounted for only 1.7% of the overall sample.
HRU outcomes, including inpatient (IP) admissions, emergency department (ED) visits, and days with OP services, were reported as a monthly incidence rate (IR) per-100-patients. Direct all-cause medical costs, including total medical (any setting), IP, OP, and ED costs, were reported from the payer’s perspective PPPM. Costs were adjusted for inflation using the US Medical Care Consumer Price Index from the US Bureau of Labor Statistics for 2019 USD.
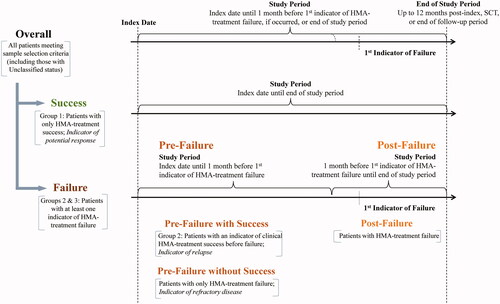
HRU and cost analyses were reported for the overall sample and were measured up to 12 months post-index or until the first event among SCT, the end of follow-up period, or 1 month before the first indicator of clinical treatment failure, if occurred (). Subsequently, these analyses were stratified by HMA-treatment success or failure status. Among patients with only clinical indicators of HMA-treatment success (i.e. Group 1), HRU and costs were measured up to 12 months post-index or until the first event between SCT or the end of the follow-up period. For patients with at least one indicator of HMA-treatment failure (i.e. Groups 2 and 3), HRU and costs were summarized pre-failure (i.e. up to 1 month before the first indicator of clinical treatment failure) and post-failure (i.e. up to 12 months after the first indicator of clinical treatment failure, including any medical services incurred during the month prior to the first indicator of clinical treatment failure). Furthermore, HRU and costs observed during the pre-failure period were reported separately for patients with at least one indicator of clinical treatment success before failure (i.e. pre-failure with success; Group 2) and patient with no indicators of clinical HMA-treatment success before failure (i.e. pre-failure without success, indicative of patients with potentially refractory disease; Group 3 excluding Group 2). Given that the study period was censored at SCT, if observed, SCT-related costs were excluded from this analysis.
Figure 3. Stratification of HRU and cost analyses by HMA-treatment success or failure. Abbreviations. HMA, Hypomethylating Agent; SCT, Stem Cell Transplantation.
Statistical analysis
The estimated HMA-treatment success rate was calculated as the sum of patients with HMA-treatment success (i.e. Groups 1 and 2) divided by all patients with at least one clinical HMA-treatment indicator, while the estimated HMA-treatment failure rate was calculated as the sum of patients with HMA-treatment failure (i.e. Groups 2 and 3) divided by all patients with at least one clinical HMA-treatment indicator. Descriptive statistics were reported for HRU and costs whereby continuous variables were summarized using means, standard deviations (SD), and medians, and categorical variables were summarized using frequencies and proportions.
Results
Patient characteristics
A total of 3,046 patients with MDS using HMA met the sample selection criteria (). Azacitidine was the first HMA for 77.4% of patients and decitabine was the first HMA for 22.6% of patients. Only 7.7% patients switched to the alternative HMA over the course of MDS treatment. The mean age at the index date was 77.4 years, 36.8% were female, 88.4% were non-Hispanic White, and 5.3% had disability or ESRD Medicare coverage. The mean Charlson Comorbidity Index (CCI) score was 2.1 (SD = 2.0), and 57.2% of patients had a CCI score ≥2. Pancytopenia (59.0%) was commonly observed among MDS patients during the pre-index period, and 47.6% had MDS with histologic subtypes of refractory anemia with excess blasts-1 or 2 (RAEB-1/RAEB-2) at the index date. Given the significant proportion of patients ≥75 years of age (65.9%), the majority of patients (72.2%) were considered unfit for SCT; an indicator of SCT was observed in only 3.5% of patients overall at any time post-index. The mean duration of available follow-up post-index was 16.3 months (SD = 15.4), and nearly half of the patients (48.7%) had 12 months of follow-up or more.
Table 1. Description of characteristics of patients with MDS using HMA.
HMA-Treatment success and failure
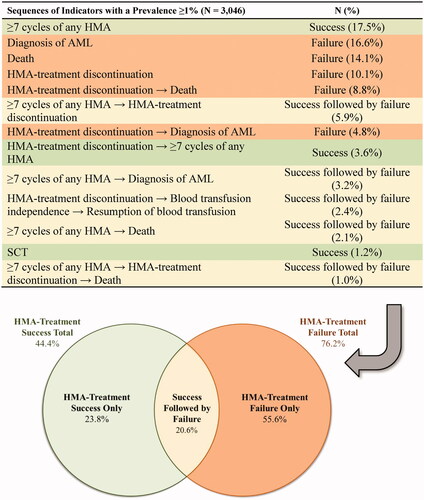
Sequences of indicators of clinical success or failure with a prevalence ≥1% are described in . Notably, 17.5% of patients completed ≥7 cycles of any HMA and 1.2% underwent SCT in the 12 months post-index (indicators of success), while 16.6% of patients had a diagnosis of AML, 14.1% died, and 10.1% had an indicator of HMA-treatment discontinuation in the 12 months post-index (indicators of failure). In addition, 9.7% of the patients achieved transfusion-independence and 69.2% of these patients eventually resumed transfusions within the 12 months post-index. The total estimated HMA-treatment success rate was 44.4% and the total estimated HMA-treatment failure rate was 76.2%; 20.6% of patients were included in both rates since indicators of clinical success followed by failure were observed in these patients.
Figure 4. Rates of HMA-treatment success and failure among patients with MDS. Abbreviations. AML, Acute Myeloid Leukemia; HMA, Hypomethylating Agent; MDS, Myelodysplastic Syndromes; SCT, Stem Cell Transplantation. Note: Sequence of indicators observed up to 12 months post-index or until the first event among SCT, diagnosis of AML, or the end of follow-up period.
HRU and medical costs
Overall, HRU and medical costs were measured during a period with an average of 6.3 months post-index (SD = 4.2; median = 5.9). Patients with only indicators of HMA-treatment success were observed during a post-index period with a mean of 11.3 months (SD = 2.2; median = 12.0). Among patients with at least one indicator of HMA-treatment failure, the pre-failure period was 4.7 months on average (SD = 3.3; median = 4.3); those with an indicator of success during the pre-failure period were observed for a mean of 8.1 months (SD = 2.1; median = 8.4) pre-failure, while those without indicators of success during the pre-failure period were observed for a mean of 3.3 months (SD = 2.6; median = 2.9) pre-failure. The post-HMA-treatment failure period was 3.6 months on average (SD = 3.4; median = 1.8).
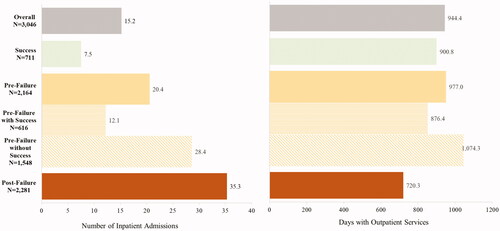
Overall, patients had an IR of 15.2 IP admissions and 944.4 OP visits per-100-patients-per-month (). Patients with only indicators of HMA-treatment success had an IR of only 7.5 IP admissions and 900.8 OP visits per-100-patients-per-month. During the pre-failure period among patients with at least one indicator of HMA-treatment failure, patients had an IR of 20.4 IP admissions and 977.0 OP visits per-100-patients-per-month. Those with and without an indicator of success pre-failure had and IR of 12.1 and 28.4 IP admissions per-100-patients-per-month, respectively, and 876.4 and 1,074.3 OP visits per-100-patients-per-month, respectively. Finally, patients post-HMA-treatment failure had the highest IR of 35.3 IP admissions, and an IR of 720.3 OP visits per-100-patients-per-month.
Figure 5. Monthly incidence rate per 100 patients.
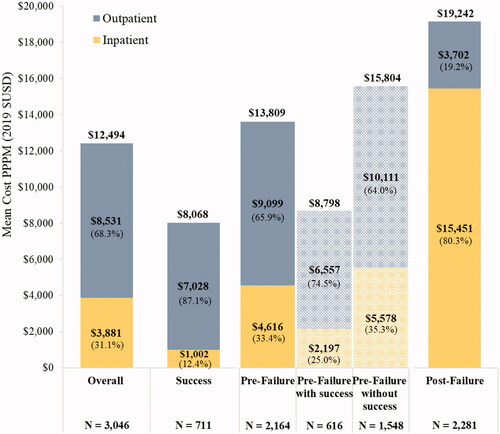
Overall, the mean total all-cause medical costs were $12,494 PPPM (SD = $10,838; from the payer’s perspective; ); in addition, the mean patients’ out-of-pocket costs were $2,521 PPPM (SD = $2,192). Patients with only indicators of HMA-treatment success had the lowest mean total all-cause medical costs at $8,069 PPPM (SD = $3,974). During the pre-failure period among patients with at least one indicator of HMA-treatment failure, patients had a mean total all-cause medical cost of $13,809 PPPM (SD = 11,902), which was $8,798 (SD = $6,554) and $15,804 PPPM (SD = $12,923) among patients with and without an indicator of success pre-failure, respectively. Patients incurred the highest mean total all-cause medical cost of $19,242 PPPM (SD = $32,561) post-HMA-treatment failure. Among patients with HMA-treatment success, OP costs were the main contributor of total healthcare costs (87.1%), while IP costs were the main driver post-HMA-treatment failure (80.3%).
Figure 6. All-cause medical service costsa,b. Abbreviations. PPPM, Per Patient Per Month; USD, United States Dollars. Notes: aCosts were assessed among patients with ≥1 month of follow-up. bEmergency room costs were <1%.
Discussion
This real-world observational study identified patients with MDS using SEER-Medicare data and highlighted some important findings related to their HMA-treatment outcomes, including incurred HRU and costs observed in patients with HMA-treatment success or failure. More than 75% of patients included in this study were found to have failed HMA treatment within 6 months. While OP costs were the main contributor of total healthcare costs, the number of IP admissions was the highest post-HMA-treatment failure, and ultimately translated into medical costs that were quadruple those observed in patients with HMA-treatment success.
In this study, an algorithm was developed to identify HMA-treatment success and failure based on events related to potential manifestations of response to HMA and evidence of disease progression observed in claims. Some elements of this algorithm may be less directly associated with success, such as the inclusion of achieving ≥7 cycles of HMA as an indicator of success which may include a mix of responders (complete or partial responders, those with stable disease, or those with a lack of alternative treatment optionsCitation21). This criterion was included based on the indication of HMA usage for a minimum of ≥4–6 cycles, and that complete or partial response may require additional cyclesCitation23,Citation27. SCT was also included as an indicator of success in these patients since the majority received ≥4 cycles of HMA and, given that most of these patients are in the higher-risk MDS group, transplantation was likely considered at diagnosis. In addition, to construct this algorithm, the model proposed by Cogle et al. to capture HMA-treatment failure focusing on front line therapy was reviewedCitation21. Our proposed approach differs from this original model by adding success pathways, including blood transfusion independence, and by considering the sequence of indicators over the entire course of the HMA treatment to assess HMA-treatment success and failure rates.
In this study population, azacitidine was the index HMA for 77.4% of patients and decitabine was the index HMA for 22.6% of patients, resembling previously reported patient distributionsCitation28; the demographic characteristics of MDS patients receiving each of the two index HMA were largely similar. As expected, a large proportion of patients was not eligible for SCT (72.2%). In the overall sample, only 3.5% of patients had an indicator for SCT at any time. In this study, over 3 out of 4 patients treated with HMA failed to achieve clinical improvement within 6 months of HMA-treatment initiation. This observation is in line with clinical trials which have shown that <30% of patients receiving azacitidine treatment had any evidence of remissionCitation13, with a median time to azacitidine-treatment failure ranging from 7 to 9 monthsCitation14,Citation29. A meta-analysis of clinical trials evaluating azacitidine-treatment outcomes for MDS patients demonstrated that only 10–17% of patients experienced complete remission on treatmentCitation16, while trials of decitabine for high-risk MDS patients reported that 9–13% achieved complete remissionCitation6,Citation12. Together, this evidence suggests that the effect of HMA treatment is limited and transient, and that most patients with MDS have important unmet treatment needs.
In patients with higher-risk MDS, and for whom HMA are the current standard of care, HMA-treatment failure yields dismal outcomes, with a median survival after HMA failure of ∼5 months, and an estimated 12-month survival rate of ∼30%Citation30–32. Studies show that following initial HMA-treatment failure, a switch from one HMA to another results in a limited response, with an overall response rate to subsequent therapy of <30%Citation30,Citation33. Furthermore, a cost effectiveness analysis showed that switching HMA agents in patients with high-risk MDS who did not respond to or failed first-line HMA therapy was more costly and less efficacious than other treatment options, particularly low-intensity chemotherapyCitation34. One study indeed showed that nearly 50% of patients with MDS in whom first-line HMA-treatment failed subsequently initiated chemotherapy other than HMA (e.g. AML-like treatment) within 6 monthsCitation21.
The overall HRU and costs reported in this study were similar to previous findings from a retrospective cohort study by Bell et al. with a mean overall cost of $17,361 PPPM (adjusted to 2015 USD) in patients with higher-risk MDSCitation20. Importantly, in our study, the observed monthly IR per-100-patients was the highest (35.3) during the post-failure follow-up period (3.6 months), in line with a study by Cogle et al. which assessed resource burden in patients with MDS who failed first-line HMA-treatment and observed at least one hospitalization event in 32.6% of patients during the first 6 months after HMA-treatment failureCitation21. In the current study, the frequency of OP and ED visits did not substantially differ between those who experienced HMA-treatment success or failure, but patients with HMA-treatment failure were observed with significantly more hospitalizations. The higher hospitalization costs accounted for 80% of the total costs associated with HMA-treatment failure; inpatient costs were four times higher among patients with HMA-treatment failure. While the findings of this study are generally consistent with the literature, the estimated mean total all-cause medical costs post-HMA-failure (approximately $115,500 per patient during a 6-month period) appear to be higher than those reported in Cogle et al. who estimated $76,945 in mean total costs among commercially insured patientsCitation21. However, this estimate is limited to MDS/AML-related costs incurred during the first 6 months after first-line HMA-treatment failure from 2009 to 2012. Nonetheless, these findings highlight the substantial economic burden observed in patients with MDS, particularly among those who failed HMA treatment, indicating possible value for future new therapies that would reduce the rate of failure to treatment and increase the duration of response.
Limitations
This study was subject to common limitations inherent to claims databases such that diagnostic and procedure codes are recorded for reimbursement purposes, and may be subject to coding errors or data omissions. In the absence of laboratory testing results, clinical indicators were used to assess response to HMA treatment in order to estimate the rate of HMA-treatment success and failure via a claims-based algorithm. Nevertheless, all data investigation to develop this algorithm were developed and reviewed in collaboration with a clinical expert and consistent with observations from a clinical practice perspective. The study sample was limited to US Medicare-insured individuals with MDS and Medicare Part D was not required as part of the study inclusion criteria; as a result, healthcare costs were likely underestimated and limited to the medical costs.
Conclusion
Results from this US real-world observational study using administrative claims and cancer-linked data highlight the unmet clinical needs and substantial economic burden of HMA-treated patients with MDS, particularly for those who do not respond to HMA treatment, which correspond to over three quarters of the study population. These patients had the highest rates of IP admissions post-HMA-treatment failure, which resulted in medical costs that were four times higher than those observed among patients with HMA-treatment success, and which accounted for 80% of the overall costs observed in patients with HMA-treatment failure.
Transparency
Declaration of funding
This study was sponsored by Novartis Pharmaceuticals Corporation. The study sponsor was involved in several aspects of the research including the study design, the interpretation of data, the writing of the manuscript, and the decision to submit the manuscript for publication.
Declaration of financial/other interests
EMS provided paid consulting services to Novartis Pharmaceuticals Corporation. GB, IS, and XC are employees and stockholders of Novartis Pharmaceuticals Corporation. DLV, SS, AG, and EQW are employees of Analysis Group, Inc, a consulting company that has provided paid consulting services to Novartis Pharmaceuticals Corporation. The authors have no other relevant affiliations or financial involvement with any organization or entity with a financial interest in or financial conflict with the subject matter or materials discussed in the manuscript apart from those disclosed.
Author contributions
All authors contributed significantly to the conception, design, analyses, and interpretation of the study results, and have reviewed and approved the final content of this manuscript. All authors, therefore, agree to be accountable for all aspects of the work.
Previous presentations
This work has not been previously published nor is it being considered for publication elsewhere. Parts of the results were presented at the ISPOR Virtual Annual Meeting held on 16–20 May 2020, and at the EHA Virtual Meeting held on 11–14 June 2020.
Acknowledgements
We would like to thank Carmine Rossi, PhD, an employee of Analysis Group, Inc, for his contribution to this study. Medical writing support was provided by a professional medical writer, Loraine Georgy, PhD, an employee of Analysis Group, Inc, which has received funding from Novartis Pharmaceuticals Corporation.
Notes
i. National Comprehensive Cancer Network is a registered trademark located at Plymouth Meeting, PA, USA.
References
- Hong M, He G. The 2016 Revision to the World Health Organization classification of myelodysplastic syndromes. J Transl Int Med. 2017;5(3):139–143.
- Della Porta MG, Tuechler H, Malcovati L, et al. Validation of WHO classification-based Prognostic Scoring System (WPSS) for myelodysplastic syndromes and comparison with the revised International Prognostic Scoring System (IPSS-R). A study of the International Working Group for Prognosis in Myelodysplasia (IWG-PM). Leukemia. 2015;29(7):1502–1513.
- Greenberg PL, Tuechler H, Schanz J, et al. Revised international prognostic scoring system for myelodysplastic syndromes. Blood. 2012;120(12):2454–2465.
- Zeidan AM, Sekeres MA, Garcia-Manero G, et al. Comparison of risk stratification tools in predicting outcomes of patients with higher-risk myelodysplastic syndromes treated with azanucleosides. Leukemia. 2016;30(3):649–657.
- Zeidan AM, Davidoff AJ, Long JB, et al. Comparative clinical effectiveness of azacitidine versus decitabine in older patients with myelodysplastic syndromes. Br J Haematol. 2016;175(5):829–840.
- Lubbert M, Suciu S, Baila L, et al. Low-dose decitabine versus best supportive care in elderly patients with intermediate- or high-risk myelodysplastic syndrome (MDS) ineligible for intensive chemotherapy: final results of the randomized phase III study of the European Organisation for Research and Treatment of Cancer Leukemia Group and the German MDS Study Group. J Clin Oncol. 2011;29(15):1987–1996.
- Rollison DE, Howlader N, Smith MT, et al. Epidemiology of myelodysplastic syndromes and chronic myeloproliferative disorders in the United States, 2001–2004 using data from the NAACCR and SEER programs. Blood. 2008;112(1):45–52.
- Sekeres MA. The epidemiology of myelodysplastic syndromes. Hematol Oncol Clin North Am. 2010;24(2):287–294.
- National Comprehensive Cancer Network. Clinical Practice Guidelines in Oncology: Myelodysplastic Syndromes, Version 3.2021. 2020 [cited 2021 Jan 25]. Available from: www.NCCN.org
- Giralt SA, Horowitz M, Weisdorf D, et al. Review of stem-cell transplantation for myelodysplastic syndromes in older patients in the context of the Decision Memo for Allogeneic Hematopoietic Stem Cell Transplantation for Myelodysplastic Syndrome emanating from the Centers for Medicare and Medicaid Services. J Clin Oncol. 2011;29(5):566–572.
- Lim Z, Brand R, Martino R, et al. Allogeneic hematopoietic stem-cell transplantation for patients 50 years or older with myelodysplastic syndromes or secondary acute myeloid leukemia. J Clin Oncol. 2010;28(3):405–411.
- Kantarjian H, Issa JP, Rosenfeld CS, et al. Decitabine improves patient outcomes in myelodysplastic syndromes: results of a phase III randomized study. Cancer. 2006;106(8):1794–1803.
- Fenaux P, Mufti GJ, Hellstrom-Lindberg E, et al. Efficacy of azacitidine compared with that of conventional care regimens in the treatment of higher-risk myelodysplastic syndromes: a randomised, open-label, phase III study. Lancet Oncol. 2009;10(3):223–232.
- Silverman LR, Demakos EP, Peterson BL, et al. Randomized controlled trial of azacitidine in patients with the myelodysplastic syndrome: a study of the cancer and leukemia group B. J Clin Oncol. 2002;20(10):2429–2440.
- Itzykson R, Thepot S, Quesnel B, et al. Prognostic factors for response and overall survival in 282 patients with higher-risk myelodysplastic syndromes treated with azacitidine. Blood. 2011;117(2):403–414.
- Silverman LR, McKenzie DR, Peterson BL, et al. Further analysis of trials with azacitidine in patients with myelodysplastic syndrome: studies 8421, 8921, and 9221 by the Cancer and Leukemia Group B. J Clin Oncol. 2006;24(24):3895–3903.
- Uy N, Singh A, Gore SD, et al. Hypomethylating agents (HMA) treatment for myelodysplastic syndromes: alternatives in the frontline and relapse settings. Expert Opin Pharmacother. 2017;18(12):1213–1224.
- Zeidan AM, Wang R, Davidoff AJ, et al. Disease-related costs of care and survival among Medicare-enrolled patients with myelodysplastic syndromes. Cancer. 2016;122(10):1598–1607.
- Wang R, Gross CP, Frick K, et al. The impact of hypomethylating agents on the cost of care and survival of elderly patients with myelodysplastic syndromes. Leuk Res. 2012;36(11):1370–1375.
- Bell JA, Galaznik A, Blazer M, et al. Economic burden of patients treated for Higher-Risk Myelodysplastic Syndromes (HR-MDS) in routine clinical care in the United States. Pharmacoecon Open. 2019;3(2):237–245.
- Cogle CR, Kurtin SE, Bentley TG, et al. The incidence and health care resource burden of the myelodysplastic syndromes in patients in whom first-line hypomethylating agents fail. Oncologist. 2017;22(4):379–385.
- U.S. Food and Drug Administration. FDA approves new therapy for Myelodysplastic Syndromes (MDS) That Can Be Taken at Home; [cited 2020 November 26]. Available from: https://www.fda.gov/news-events/press-announcements/fda-approves-new-therapy-myelodysplastic-syndromes-mds-can-be-taken-home.
- Food and Drug Administration. VIDAZA (azacitidine): highlights of prescribing information; 2020. Available from: https://www.accessdata.fda.gov/drugsatfda_docs/label/2020/050794s032lbl.pdf
- National Cancer Institute. Overview of the SEER Program; [cited 2020 Jun 6]. Available from: https://seer.cancer.gov/about/overview.html.
- Warren JL, Klabunde CN, Schrag D, et al. Overview of the SEER-Medicare data: content, research applications, and generalizability to the United States elderly population. Med Care. 2002;40(8 Suppl):IV–I3-18.
- Ma X, Does M, Raza A, et al. Myelodysplastic syndromes: incidence and survival in the United States. Cancer. 2007;109(8):1536–1542.
- Food and Drug Administration. DACOGEN (decitabine): highlights of prescribing information; 2020. Available from: https://www.accessdata.fda.gov/drugsatfda_docs/label/2020/021790s025lbl.pdf
- Mukherjee S, Cogle CR, Bentley TG, et al. editors. Treatment patterns among patients with myelodysplastic syndromes: observations of 1st-line therapy, discontinuation and the need of additional therapies. San Francisco: American Society of Hematology; 2014.
- Duong VH, Lin K, Reljic T, et al. Poor outcome of patients with myelodysplastic syndrome after azacitidine treatment failure. Clin Lymphoma Myeloma Leuk. 2013;13(6):711–715.
- Jabbour E, Garcia-Manero G, Batty N, et al. Outcome of patients with myelodysplastic syndrome after failure of decitabine therapy. Cancer. 2010;116(16):3830–3834.
- Prebet T, Gore SD, Esterni B, et al. Outcome of high-risk myelodysplastic syndrome after azacitidine treatment failure. J Clin Oncol. 2011;29(24):3322–3327.
- Kotsianidis I, Papageorgiou SG, Pappa V, et al. Azacytidine failure revisited: an appraisal based on real-life data from the mds registry of the Hellenic Myelodysplastic Syndrome Study Group (HMDS). Mediterr J Hematol Infect Dis. 2019;11(1):e2019045.
- Harel S, Cherait A, Berthon C, et al. Outcome of patients with high risk Myelodysplastic Syndrome (MDS) and advanced Chronic Myelomonocytic Leukemia (CMML) treated with decitabine after azacitidine failure. Leuk Res. 2015;39(5):501–504.
- Cogle CR, Ortendahl JD, Bentley TG, et al. Cost-effectiveness of treatments for high-risk myelodysplastic syndromes after failure of first-line hypomethylating agent therapy. Expert Rev Pharmacoecon Outcomes Res. 2016;16(2):275–284.