
Abstract
Objective
Home medication review (HMR) programs could minimise patients’ health-related costs and burdens, thereby enhancing the quality of life and well-being. The aim of this economic evaluation is to determine if home medication review by community pharmacists (HMR-CP) for patients with type 2 diabetes mellitus (T2DM) is a cost-effective intervention from the Malaysian healthcare provider perspective.
Methods
The economic evaluation was conducted alongside the randomised controlled trial (RCT) to estimate the intermediate cost-effectiveness of HMR-CP for patients with T2DM. A Markov model was then constructed to project the lifetime cost-effectiveness data beyond the RCT. The primary outcomes for the economic evaluation were HbA1c and quality-adjusted life-years (QALYs).
Results
The intervention and health services costs throughout the 6-month HMR-CP trial were RM121.45 (USD28.64) [95%CI: RM115.89 to 127.08 (USD27.33–29.97)] per participant. At a 6-month follow-up, a significant reduction in HbA1c of 0.902% (95% CI: 0.388% to 1.412%) was noted in the HMR-CP group compared to the control group. The ICER of HMR-CP intervention versus standard care was RM178.82 (USD 42.17) [95%CI: RM86.77–364.03 (USD20.46–85.86)] per reduction of HbA1c. HMR-CP intervention [RM12,764.82 (USD3010.57)] was associated with an incremental cost of RM83.34 (USD19.66) over control group [RM12,682.95 (USD2,991.26)] with an additional of 0.07 QALY gained. The ICER associated with HMR-CP intervention was RM1,190.57 (USD280.79) per QALY gained, which was below the ICER threshold in Malaysia, indicating that HMR-CP was a cost-effective option.
Conclusion
HMR-CP was a cost-effective intervention that had significantly reduced the HbA1c among the T2DM patients, although associated with higher mean total costs per participant.
JEL classification codes:
Introduction
The healthcare system in Malaysia has experienced considerable transformation since its independence in 1957. From a single provider system, Malaysian healthcare has evolved to a 2-tier system consists of public and private sector providers interacting with one another, as well as with third-party financiers. The public healthcare sector system is funded by the government and the Ministry of Health (MOH), as the largest healthcare service provider. The government provides major healthcare and healthcare-related facilities, financing through central taxation.
Community pharmacists are the most accessible point of contact within the healthcare system and play an essential role in the delivery of primary healthcare given to their location, accessibility (via retail pharmacies) and expertise. Accordingly, they are ideally positioned to improve patient outcomes through home-based pharmacy programsCitation1. In Malaysia, home medication review (HMR) was initiated by the Pharmaceutical Services Division, Ministry of Health (MOH) Malaysia in 2011Citation2, primarily for chronic disease patients who are taking multiple drugs (e.g. warfarin, dabigatran, inhaler, and insulin) that require close supervision, have had significant changes in chronic disease treatment after hospital discharge, with little or inadequate family support in medicine management and/or with a mental or physical disability. During home medication review by community pharmacists (HMR-CP), a community pharmacist involves actively in the provision of care, monitoring and counselling to ensure medicine is used safely and effectively. This new intervention (i.e. HMR-CP) could be reimbursed by the government to community pharmacists via a similar pathway as in Australia using Pharmacy Program Administrator PortalCitation3.
The efficiency of HMR programs in reducing HbA1c, identifying and resolving the drug-related problem (DRP) could minimise disease complications including cardiovascular disease (CVD) and burden, thereby enhancing the quality of life and well-beingCitation4. This is of importance given that CVD is a common condition affecting approximately 32.2% of T2DM patients, and it is found to be the primary cause of mortality among people with T2DMCitation5. Part of CVD, coronary artery disease and stroke were the significant contributorsCitation5. Given that T2DM is a known independent, controllable risk factor for CVD, the current economic model attempted to translate the clinical benefits of HMR-CP intervention in reducing the long-term CVD risk factors into the cost from the healthcare provider perspective (i.e. MOH, Malaysia).
Methods
Setting and location
The randomised controlled trial (RCT) was conducted in Bandar Pasir Mas, north-western Kelantan, Malaysia, from March until December 2018. A total of 166 adult T2DM patients (age of 18-year-old and above), attended Bandar Pasir Mas Health Clinic, who fulfilled the inclusion criteria were enrolled. Bandar Pasir Mas Health Clinic is a secondary public healthcare centre under MOH in which access to healthcare service is available to everyone. The base case population for this study was chosen based on the fact that 99.3% of the T2DM patients in Malaysia are 18 years old and aboveCitation6. Informed consent was signed by all participants, and they were randomly assigned to an intervention group (i.e. receiving HMR-CP) or a control group (i.e. not receiving HMR-CP). All patients were followed up for six months. The study was approved by the Medical Research & Ethics Committee (MREC), MOH [Reference number: NMRR-17-2348-37624(IIR)], and UiTM Research Ethics Committee in 2018 [Reference number: REC/224/18]. This RCT has been registered at the Australian-New Zealand Clinical Trial Registry (ANZCTR) (ACTRN12618000839202). Details and findings of the RCT were previously describedCitation7.
Comparators
The study intervention (i.e. HMR-CP) involved both community pharmacist HMR visits and family medicine physician reviews. The community pharmacists were trained to perform HMR, and they visited participants' houses every three (3) months (i.e. baseline, at 3-month, and 6-month). Each HMR visit lasted between 20–45 min and the community pharmacists provided tailored counselling to the participants on medication adherence, lifestyle modification, and self-monitoring blood glucose monitoring at home. After each HMR visit, the community pharmacists wrote a report to provide feedback (including detected drug-related problems) to the family medicine physicians so that adjustments in medication regimen could be made if necessary. Participants who were randomised to the control group continued with usual care without any active study intervention (i.e. HMR-CP). The control group received routine diabetes care and treatment in the health clinic and were contacted through phone by the researcher to remind them about their visits to the health clinic for blood sampling and data collection.
Study design
This economic evaluation was performed to assess the costs and cost-effectiveness of management of T2DM with HMR-CP versus without HMR-CP. The economic evaluation was conducted alongside the RCT to estimate the intermediate cost-effectiveness (i.e. cost per HbA1c reduction). A Markov model was then developed to project the lifetime cost-effectiveness data beyond the RCT. All costs were expressed in 2019 Ringgit Malaysia (RM). To detect a cost difference of RM25 (USD5.90) in the annual cost per patient that was considered as significant at 80% power and 5% significanceCitation8, a minimum sample size of 126 patients (i.e. 63 patients per group) was required. All costs were converted to reflect 2020 US$using Campbell and Cochrane Economics Methods Group-the Evidence for Policy and Practice Information (CCEMG–EPPI, https://eppi.ioe.ac.uk/costconversion/default.aspx)-Centre Cost Converter softwareCitation9.
Estimation of resource use and costs
Cost inputs
Activity-based costing (ABC) is the most suitable method that can be used in analysing an actual cost for a specific programme or activity. ABC can track expenses at the level of detail that will allow differentiating the cost of providing the same service to different patientsCitation10. The concept of ABC is to include direct costs of an activity or action that results in the consumption of resources, which are a quantitative reflection of the costCitation11.
The study was performed from the perspective of the healthcare provider. Therefore, only two main cost categories, including the cost of implementing the intervention and the costs associated with the use of healthcare services by participants in both groups, were included. Of note, protocol-driven costs (i.e. development of training module and materials) were not included as recommended by the International Society for Pharmacoeconomics and Outcomes Research (ISPOR) task force guidelineCitation12. The cost of implementing the intervention included i) training activities for community pharmacists on HMR; ii) training activities for family medicine consultant on HMR report review; iii) the number of hours spent by community pharmacists on HMR, and iv) the cost of transportation for community pharmacists to perform HMR.
The costs associated with the use of healthcare services by T2DM patients were calculated using the patient-level utilisation rate of each healthcare resource at baseline, 3-month, and 6-month. These included the following cost centres: monitoring, clinic consultations, and drugs (see Supplementary Table 1). All cost centres included various cost activities such as personnel costs, medication costs, and monitoring test costs.
Personnel cost
A time-motion study was conducted to assess the time taken by each personnel category and their costs. The clinical processes involved various healthcare personnel, such as medical consultants and community pharmacists. The time spent was based on the mean time spent (minute) by each person for each activity and was then multiplied by the wage rate (per minute) of the respective personnel. The unit cost of personnel time (i.e. wage rate per minute) was estimated from the wages rate of MOH staff for work performed during usual work hours. It included the base salaries and fixed allowances in accordance with the average pay scale of the Federal Civil Service Officers under the System of minimum and maximumCitation13. For the community pharmacists, the hourly wages of community pharmacists were calculated from the average salary of community pharmacists, which was RM73,250 (USD17,275.94) per yearCitation14.
Monitoring, clinic consultation and drug costs
The cost of monitoring tests (i.e. HbA1c and RBS/FBG) was calculated by multiplying the number of tests performed with the unit cost of the testsCitation15. The cost of outpatient clinic visits was calculated by multiplying the number of the visit with the unit cost of outpatient treatment by a family medicine consultant, costing RM 120 (USD28.30) per visitCitation16. The costs of drugs were obtained from the Pharmacy Information System (PHIS) in Bandar Pasir Mas Health Clinic. The 6-month medication costs of each patient were calculated by multiplying the quantity of medication dispensed with the drug acquisition cost.
Measurement of effectiveness
The primary outcomes for the economic evaluation were HbA1c and quality-adjusted life-years (QALYs). The Intention-to-treat population was used for the primary analysis. The five-level EuroQoL five-dimensional questionnaire (EQ-5D-5L) was administered at baseline, 3-month, and 6-month follow-up, and QALYs were estimated using the changes in utility values, assuming a linear change between these three time-points. The English and Malay-translated versions of EQ-5D-5L were validated tools provided by EuroQoL to be used in Malaysia, and the recently published Malaysian EQ-5D-5L value set was employed for health state valuationCitation17.
Statistical analysis
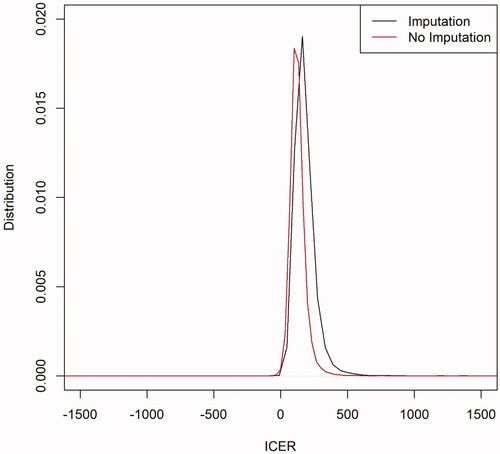
All collected data were analysed using statistical software IBM SPSS version 24 (IBM Corp, Chicago, Illinois, USA) and R version 3.6.0 (R Foundation for Statistical Computing, Vienna, Austria). ITT population analysis was performed on a complete set of data with those missing data imputed using the last observation carried forward (LOCF) method. For economic analysis, cost differences were expressed using the arithmetic mean (not medians) as this allows budgetary assessment of treatment, and it is the statistic of interest for healthcare policy decisions. However, cost data are usually right-skewed and do not conform to the assumptions for parametric statistical tests for comparing differences in arithmetic means. Therefore, non-parametric bootstrapCitation18 is often used to compare the mean and calculate the confidence interval. To incorporate uncertainty into the main outcome of the economic evaluation (i.e. the ICER), the ICER 95% confidence interval (CI) was determined via non-parametric bootstrappingCitation19,Citation20. For each of the 10,000 iterations, the statistical means of cost and effectiveness for each group (HMR-CP and control) were estimated, allowing the calculation of the 10,000 corresponding ICERs. The distribution of 10,000 bootstrapped ICERs for both analyses, with or without imputations, was then plotted ().
Figure 1. Distribution of 10,000 bootstrapped ICERs for analyses with or without imputations.
Intermediate cost-effectiveness analysis
The mean percentage of HbA1c and the mean cost of both groups were used to estimate the intermediate cost-effectiveness. The use of HbA1c is a gold standard in the clinical management of T2DM, allowing comparability among the published studies. In cost-effectiveness analysis (CEA), an incremental cost-effectiveness ratio (ICER) is used in making an informed decision about interventions that are more costly and more effective than the comparatorsCitation21. The ICER was calculated by dividing the difference in cost between the intervention group and the control group with the difference in their effectiveness. An estimated ICER threshold for Malaysia of RM19,929 to RM28,470 (USD4700.24 − 6714.62) was used as a referenceCitation22. A treatment option is considered cost-effective if the ICER per additional severe exacerbation avoided was below RM28,470 (USD6714.62). ICER will not be calculated if the intervention is more effective at a lower cost, indicating it is a dominant strategy.
For the intermediate cost-effectiveness analysis, the incremental cost per additional reduction in HbA1c was determined for each group. The ICER, which provided a point estimate of the mean cost per HbA1c reduction, was then presented.
Lifetime cost-effectiveness analysis
Model structure
The ICER per QALY was used to report the lifetime cost-effectiveness. Markov modelling beyond the time horizon of the trial is essential for projecting the lifetime cost-effectiveness data related to intervention for patients with chronic diseasesCitation23. A cohort of T2DM patients (age of 61.9 years old and above) over an 18-year time horizon, with a 6-month Markov model, was developed using TreeAge Pro-Health 2019 (TreeAge Software Inc, Williamstown, MA) to estimate the lifetime cost-effectiveness of HMR-CP compared to the control group by stimulating CVD events and death risk for both groups. The model applied hypothetical of cycles. A half-cycle correction was performed. The model intended to extrapolate the efficacy data from the local RCT data to an 18-year cost-effectiveness outcome. It was assumed that the T2DM patients would receive therapy for a maximum of 18 years, which corresponds to the life expectancy rate of males (i.e. 72.7 years old) and females (i.e. 77.4 years old) in Malaysia for the year 2017Citation24.
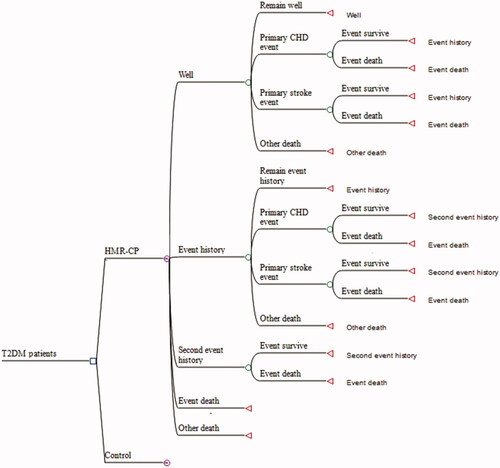
The health states of the Markov model, as depicted in Citation12 All patients in both groups entered the model in the “well” state. After that, the patients can either remain free of events, develop the first coronary heart disease (CHD) or stroke, develop recurrent CHD or stroke (either fatal or nonfatal), or die from the events or other natural causes in any cycle. Depending on the total time spent in the different health states, the model estimated the expected survival for patients in each treatment arm, and it was combined with cost and quality of life (QoL) data to determine the relative lifetime cost-effectiveness.
Figure 2. Markov Model. Abbreviations. T2DM, Type 2 diabetes mellitus; HMR-CP, Home medication review by community pharmacists.
Model inputs
Clinical inputs for CVD risk prediction and transition probabilities
All clinical data used for estimation of CVD risk were collected from the abovementioned RCTCitation7. The baseline characteristic of the participants from each group (i.e. HMR-CP group and control group) were summarised in Supplementary Table 2. There was no significant difference between the two groups at baseline except for FBG; therefore, FBG was included in the Generalised Estimating Equations (GEE) model for adjustment in the analysis. For each group, the CVD risks were estimated by the United Kingdom Prospective Diabetes Study (UKPDS) Risk EngineCitation25 (version 2.0) with the clinical outcomes (i.e. HbA1c, SBP, TC, HDL) (Supplementary Table 3) and demographic characteristics at the individual patient level (i.e. age, gender, ethnicity, smoking status, duration of diabetes) collected in the local RCT as the inputsCitation7. The UKPDS outcomes model has been previously used in the Malaysian settingCitation26.
The mean estimated absolute 18-year risks of fatal and nonfatal CHD and stroke for each group were then derived and populated into the Markov model as the transition probabilities of various CVD events (Supplementary Table 4). Of note, the estimated risks for CHD and stroke (both nonfatal and fatal) were lower in the HMR-CP group when compared to the control group after 6-month of follow-up. The 6-monthly risk increased as the patients aged over 18 years in each group, along with the absolute risk reduction (ARR) between the HMR-CP group and the control group, increased over time. For example, the ARR in the nonfatal CHD risk in year 1 was 0.2% (1.99% vs. 2.19%), whereas the ARR increased to 2.12% in year 18 (46.14% vs. 48.26%) in favour of the HMR-CP group. Likewise, the ARR between the HMR-CP group and the control group was calculated as 0.11% (1.42% vs. 1.53%) for fatal CHD in year 1 and increased to 1.04% (38.80% vs. 39.84%) in year 18. Other transition probabilities include age- and gender-adjusted non-cardiovascular mortality rates, which were derived from the local life tableCitation27.
Cost inputs and utility values
All cost inputs, utilisation of medical resources, and utility values were derived from published literature or the abovementioned RCT. All data were summarised in . The utility values at 6-month post-intervention for both groups were employed as the inputsCitation7. Cost inputs that were not reported in the year 2019 were inflated using the consumer price indexCitation28.
Table 1. Baseline inputs for the model including ranges and distribution.
Time horizon and discount rate
The trial had six months of follow-up, and as for the within-trial assessment of costs and outcomes (i.e. intermediate cost-effectiveness analysis), no discounting of outcomes or costs was performed given the short time horizon. For lifetime cost-effectiveness data, an annual discount rate of 3% was adopted for both costs and outcomes, as recommended by the Malaysian pharmacoeconomic guidelineCitation29. Sensitivity analysis with higher and lower discount rates (for example, 0% and 5%) was performed to determine the robustness of the economic model.
Model assumptions
The current model assumed that:
A nonfatal CHD or stroke event has been associated with an increased risk of mortality, as measured by the relative risk (RR) of death after the event. The RR for death after CHD and stroke was estimated to be 2.820Citation30 and 2.300Citation31 (), respectively.
The risk of death after a single CHD or stroke event was the same for subsequent events, and both groups were at the same risk of subsequent events.
Patients who had experienced their first CHD or stroke event would continue to be exposed to the risk of having subsequent CHD or stroke events, and both groups were at the same risk of following events. The RR for subsequent CHD or strokes event was estimated to be 2.224 and 1.889 (), respectivelyCitation12,Citation32.
The utility value for "event history" health state and "second event history" health state was assumed the same as to utility value for CHD event.
The cost of managing the first CHD event was assumed the same as the subsequent events. It was the mean hospitalisation cost due to percutaneous coronary intervention at the general hospital in Malaysia. Cost per event was inflated from 2014 [(i.e. RM 12,117.00) (USD2857.78)] to 2019 [(i.e. RM 13,375.16) (USD3154.52)].
The cost of managing the first stroke event was assumed the same as the subsequent events. It was the average cost of treating an acute ischaemic stroke (including both major and minor events) and follow-up (i.e. outpatient visits and rehabilitation sessions) at a teaching hospital in Malaysia. Cost per event was inflated from 2010 [(i.e. RM 6,920.00) (USD1632.08)] to 2019 [(i.e. RM7,638.53) (USD1801.54)].
Sensitivity analysis
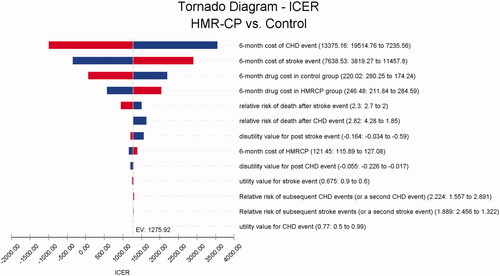
Sensitivity analysis was used to test the robustness of the outcome in the model. Deterministic sensitivity analysis was performed by modifying the variables used in the model within the plausible ranges from the base case values, as specified in . Where a standard error or confidence intervals were not published for variables, ±30%-50% from the base case values were explored. The ICER value was compared with the ICER threshold from Lim et al. study, ranging between RM19,929 (USD4700.24) to RM28,470 (USD6714.62) Citation22. The variables that had the most influence on the model were determined as well (). The probabilistic sensitivity was analysed by using the Monte Carlo simulation of 10,000 patients. Variables related to relative risks were assigned to log-normal distribution, utilities were assigned to beta or triangular distribution, and costs were assigned to a gamma distribution. The cost-effectiveness acceptability curve (Supplementary Figure 1) and the cost-effectiveness plane (Supplementary Figure 2) were used to estimate the probability of HMR-CP being a cost-effective option over a range of maximum willingness to pay (WTP).
Figure 3. Tornado diagram.
Results
Intervention and health services costs throughout the 6-month HMR-CP trial and intermediate cost-effectiveness analysis
The findings for intervention and health services costs throughout the 6-month HMR-CP trial and the intermediate cost-effectiveness analysis are presented in and , respectively. With imputation (), the mean intervention costs that included training workshop on HMR, HMR visit by community pharmacists and transportation fee was RM121.45 (USD28.64) [95%CI: RM115.89 to 127.08 (USD27.33 − 29.97)] per participant. The health services costs throughout the 6-month trial were RM640.14 (USD 150.97) [95%CI: RM605.37-678.04 (USD142.77 − 159.91)] and RM614.10 (USD144.83) [95%CI: RM567.84-672.51 (USD133.92 − 158.61)] in the HMR-CP and the control groups, respectively.
Table 2. Intervention and health services costs throughout the 6-month HMR-CP trial.
Table 3. Cost and effectiveness outcome measures and intermediate ICERs.
As shown in , with imputation, the mean total costs per participant were higher in the HMR-CP group; RM762.26 (USD179.77) [95%CI: RM726.66-800.42 (USD171.38 − 188.77)] in the HMR-CP group and RM614.10 (USD144.83) [95%CI: RM567.84-672.51 (USD133.92 − 158.61)] in the control group, with an incremental cost of RM148.16 (USD34.94) [95%CI: RM80.37-208.44 (USD18.96 − 49.16)]. At a 6-month follow-up, a significant reduction in HbA1c of 0.902% (95%CI: 0.388% to 1.412%) was noted in the HMR-CP group when compared to the control group. The ICER of HMR-CP intervention versus standard care was RM178.82 (USD 42.17) [95%CI: RM86.77-364.03 (USD20.46 − 85.86)] per reduction of HbA1c.
Likewise, without imputation (), the mean total costs per participant remained higher in the HMR-CP group; RM762.59 (USD179.86) [95%CI: RM725.41-803.34 (USD171.09 − 189.47)] in the HMR-CP group and RM630.94 (USD148.81) [95%CI: RM571.43-706.56 (USD134,77 − 166.64)] in the control group, with an incremental cost of RM131.65 (USD31.05) [95%CI: RM48.87-203.75 (USD11.53 − 48.05)]. At a 6-month follow-up, a significant reduction in HbA1c of 1.105%, 95%CI: 0.481% to 1.716%) was noted in the HMR-CP group when compared to the control group. The ICER of HMR-CP intervention versus standard care was RM129.96 (USD30.65) [95%CI: RM48.09-261.97 (USD11.34 − 61.79)] per reduction of HbA1c. No significant difference in ICER was noted in both distributions, with or without imputations ().
Lifetime cost-effectiveness analysis
Base case analysis
HMR-CP intervention [RM12,764.82 (USD3,010.57)] was associated with an incremental cost of RM83.34 (USD19.66) over control group [RM12,682.95 (USD2,991.26)]. Likewise, HMR-CP intervention was associated with greater QALYs (i.e. 0.98) when compared to the control group (i.e. 0.91), affording 0.07 QALY gained. The ICER associated with HMR-CP intervention was RM1,190.57 (USD280.79) per QALY gained, which was below the ICER threshold in Malaysia, indicating that HMR-CP was a cost-effective option.
Probabilistic sensitivity analysis
The mean cost of HMR-CP intervention was RM8,816.52 (USD2079.37) [95% CI: RM3,875.02-16,201.03 (USD913.92 − 3,820.00)] while the control group afforded a lower mean cost of RM8,810.83 (USD2,078.03) [95% CI: RM3,746.91-16,407.19 (USD883.71 − 3,869.62)]. The mean QALY associated with HMR-CP intervention and control group was 0.74 (95%CI: 0.54-0.87) and 0.68 (95%CI:0.47-0.83), respectively. The probability of HMR-CP intervention being a cost-effective option was above 75.41% (Supplementary Figure 1 and 2).
Sensitivity analysis
One-way sensitivity analysis () revealed that the model outcome was most sensitive to changes in the 6-month cost of the CHD event, followed by the 6-month cost of the stroke event. These resulted in an ICER range of RM56.85-3,258.72 (USD13.41 − 768.57) per QALYs gained, indicating HMR-CP remained the preferred option. The model outcome was robust to the uncertainty in the annual discount rate of 0% and 5% as well, with the ICER remaining at RM1,389.00 (USD327.59) and RM1,156.43 (USD272.74) per QALYs gained, respectively, in favour of HMR-CP intervention. When replacing the utility value for both health states (i.e. event history and second event history) as to utility value for stroke event, the model outcome remained robust, with an ICER of RM1,397.33 (USD329.56) per QALY gained.
Discussion
Pharmacist-led medication review has been shown to improve patients outcomes in numerous studiesCitation33–35. However, very limited studies have looked into the cost-effectiveness of pharmacist-led medication review in particular performed by the community pharmacists at the patients’ home setting. In the current study, we evaluated the cost-effectiveness of the newly developed partnership programme between the government and private sector in providing HMR for patients with T2DM and have no prior history of CVD. The current analysis showed that HMR-CP could help to reduce the long-term risk of CVD in T2DM patients while minimally increase in cost and QALY in the intervention group; however, the ICER per QALY gained was well below the ICER threshold, and hence, it is considered as a cost-effective programme to be implemented in the Malaysian setting. As this study is the first in evaluating the cost-effectiveness of the HMR-CP programme toward T2DM patients, we do not have any study to directly compare with our study findings.
Pharmacist-led intervention studies have shown a variety of economic outcomes depending on the type of patient's underlying diseases, as revealed in the study findings of the cost- or cost-effectiveness analyses. For instance, the study by Yu et al.Citation36 in which the intervention programme delivered by pharmacists at the outpatient primary care setting for diabetes patients has reduced the overall cost of disease management while improving the clinical outcomes like HbA1c, blood pressure, and cholesterol level. A reduction of 1% HbA1c is associated with a 21% risk reduction of death related to diabetes, 37% risk reduction for microvascular complications, 21% risk reduction of diabetes related-end point and 14% risk reduction of myocardial infarctionCitation37. Hence, a 1% reduction in HbA1c is considered to be clinically relevant in reducing cost for management of comorbidities and translated into saving for healthcare provider perspective. Successful management of diabetes by community pharmacists, which was performed in the pharmacy premises, has produced significant clinical and economic outcomes, as seen in the Asheville projectCitation38. The 5-year Asheville project was associated with clinically meaningful improvements in lipid profile by 50% of patients, the HbA1c reduction by 1.0 percentage point, and cost per patient per year decreased by USD1,200 to USD1,872Citation38. Likewise, another community pharmacist-led intervention study that focused on asthma patientsCitation39 has shown cost reduction in the intervention group with improved clinical outcomes (i.e. better asthma controlled when the patients in the intervention group have shifted from uncontrolled asthma toward partial-controlled and controlled asthma).
A systematic review on the cost-effectiveness of interventions (i.e. multi-component interventions for diabetic risk factor control, comprehensive foot care, intensive lifestyle interventions, annual screening for diabetic retinopathy) by multi-disciplinary healthcare providersCitation40 concluded that the majority of these interventions intended to prevent or control diabetes are either cost-saving or cost-effective. One of the studies found that the intervention group experienced a mean decrease of 1.1 ± 2.8 mmol/L in fasting plasma glucose level at 6 months when dietitians are involved in active decision making about intervention alternatives based on the patient's needs, reducing a total cost of USD1.12 for the intervention groupCitation41. A recent study by Odnoletkova et al.Citation42, that involved diabetes education through nurse-led tele-coaching was considered as highly cost-effective in the Belgian healthcare system, with a mean of ICER at €7,858 (USD8,503) in the subgroup of HbA1c ≥7.0% when compared with their GDP (i.e. €42,139; USD45,598)Citation43.
In our study, the mean total cost per participant was higher in the HMR-CP group than the control group, mainly driven by the higher mean subtotal intervention cost and cost of health services per participant in the HMR-CP group. The incremental cost upon implementation of HMR-CP was from the salary and transportation allowance paid to the community pharmacist for each visit. Sensitivity analysis showed that the model outcome was most sensitive to changes in the 6-month cost of the CHD event, followed by the 6-month cost of the stroke event. This is due to the high variation in both costs, as reported in .
Pharmacist-led intervention studies have shown a variety of QALY gain for different types of patient's diseases as well. With the model's time horizon set at 18 years, the incremental QALY gain was only 0.07 (0.91 vs. 0.98). The study by Yu et al.Citation36, in which the QALY gained was 0.49 over 10 years. Another community pharmacist-led intervention program by Bosmans et al.Citation44 that was focused on patients with anti-hypertensive medication, the QALY gained was merely 0.01 over 9 months while pharmacist-led intervention programme focussed on asthma patients by Tinelli et al.Citation39 has shown a QALY gained of 0.09–0.29 for different groups of patients. The difference in the QALY gained across studies that involved pharmacist-led medication review might be due to different patient cohorts with different types of chronic disease; the acceptance of the intervention could be different, and thus, leading to variation in QALY gainedCitation36,Citation39,Citation44,Citation45. The nature of the disease also may contribute to the varying range of QALY gained and for patients with certain diseases such as mental health or cancer, the measurement of QALY are incredibly subjectiveCitation46–Citation48.
As the model inputs were derived from an RCT conducted in the Malaysian settingCitation7, the current model outcomes reflected the local scenario and with minimal assumptions to be made. Another strength of our modelling study was the use of the UKPDS Risk Engine in the projection of cardiovascular outcomes over the long term based (18 years) on short-term clinical surrogates for T2DM patients. The Risk Engine was obtained from UKPDS data and was intended to reflect a change in the general T2DM population. Consequently, it provides progressively applicable than the prediction of CHD using risk factor categories, as reported in a previous studyCitation49. Unlike Yu et al.Citation36, we estimated absolute 18-year risks of fatal and nonfatal CHD and stroke for each patient, rather than assuming the cohort of simulated patients in both HMR-CP and control groups achieved the mean values of clinical outcomes (i.e. HbA1c, SBP, TC, HDL) observed at the end of the 6-month follow-up period of the local RCTCitation7. This will diminish the possibility that not all patients would achieve the observed average outcomes, preventing the over-estimation of the economic findings.
There are several limitations to this study. This study relies on our RCT that was only performed at a single primary health clinic. Hence, future RCT, which includes multiple sites (i.e. primary health clinics and hospitals) from different states with more participation of community pharmacists, is anticipated to enhance the generalisability of the data. The second limitation was the perspective chosen for the analysis. Only the payer perspective was taken into consideration, and thus, future studies should expand to societal perspective. The field of pharmacoeconomics also needs to acknowledge the limitations of this perspective when it comes to essential questions of research and development costs, and incentives for innovationCitation50. The cost of hospitalisation was not included in this study as the incidence of hospitalisation was not captured in the health clinic setting, and thus, could be a limitation. The intervention was performed in Malaysia, where different countries may have different health financial or payment schemes, and thus, the findings may not be generalisable to other countries.
Conclusions
HMR-CP was a cost-effective intervention that had significantly reduced the HbA1c among the T2DM patients, although associated with higher mean total costs per participant.
Transparency
Declaration of funding
This manuscript was not funded.
Author contributions
MRR and CFN constructed the economic model and involved in data analysis. DCBW and CFN are involved in model validation. MRR and CFN drafted the manuscript. CFN, DCBW and MK assisted with the manuscript revision. All authors read and approved the final manuscript.
Reviewer disclosures
Peer reviewers on this manuscript have no relevant financial or other relationships to disclose.
Previous presentations
Part of the preliminary findings of this research was presented at the 2019 International Congress of Diabetes and Metabolism, South Korea.
Supplemental Material
Download MS Word (228.8 KB)Acknowledgements
A PhD scholarship to MRR by the Ministry of Health Malaysia is gratefully acknowledged.
Declaration of financial/other relationships
The authors have no relevant affiliations or financial involvement with any organization or entity with a financial interest in or financial conflict with the subject matter or materials discussed in the manuscript. This includes employment, consultancies, honoraria, stock ownership or options, expert testimony, grants or patents received or pending, or royalties.
References
- Papastergiou J, Zervas J, Li W, et al. Home medication reviews by community pharmacists: reaching out to homebound patients. Can Pharm J). 2013;146(3):139–142.
- Home Medication Review Protocol. In: Division PS, editor. 1st ed. Malaysia: Ministry of Health; 2011.
- Administrator PP. Program Rules Home Medicines Review. In: Health Do, editor. Australia: Australian Government; 2019.
- Gudi SK, Kashyap A, Chhabra M, et al. Impact of pharmacist-led home medicines review services on drug-related problems among the elderly population: a systematic review. Epidemiol Health. 2019;41:e2019020.
- Einarson TR, Acs A, Ludwig C, et al. Prevalence of cardiovascular disease in type 2 diabetes: a systematic literature review of scientific evidence from across the world in 2007–2017. Cardiovasc Diabetol. 2018;17(1):83.
- Chandran A, Abdullah MN, Abdul F. National Diabetes Registry Report 2013–2019. In: Section NCD, editor. Malaysia: Ministry of Health; 2020.
- Mehmood S, Hasan SMF, Razzakova CM, et al. Abstracts from the 1st JoPPP Conference on Pharmaceutical Policy and Practice. J of Pharm Policy and Pract. 2020;13(S1):3.
- Thanimalai S, Shafie AA, Ahmad Hassali MA, et al. Cost-effectiveness of warfarin medication therapy adherence clinic versus usual medical clinic at Kuala Lumpur Hospital. Value Health Reg Issues. 2018;15:34–41.
- CCEMG - EPPI-Centre Cost Converter. 2019. [cited 23 Sep 2020]. Available from: https://eppi.ioe.ac.uk/costconversion/default.aspx
- Service lines and activity-based costing reveal true cost of care for UPMC [Internet]. Health Catalyst. 2016. [cited 20 Jun 2019]. Available from: https://www.healthcatalyst.com/success_stories/activity-based-costing-in-healthcare-upmc
- Michalska J, Szewieczek D. The improvement of the quality management by the activity-based costing. J Achiev Mater Manuf Eng. 2007;21(1):91–94.
- Ramsey SD, Willke RJ, Glick H, et al. Cost-effectiveness analysis alongside clinical trials II-an ISPOR good research practices task force report. Value Health. 2015;18(2):161–172.
- Indeks jadual gaji minimum-maksimum perkhidmatan awam Malaysia [Malaysian public service minimum-maximum salary schedule index]. In: Malaysia JPA, Government of Malaysia. Malaysia; 2016.
- Average retail pharmacist salary [Internet]. PayScale, Inc. 2019. [cited 23 Dec 2019]. Available from: https://www.payscale.com/research/MY/Job=Pharmacist/Salary
- Fees (Medical) (Amendment) order [Internet]. Attorney General's Chamber. 2017. [cited 27 Nov 2019]. Available from: https://docplayer.net/55666838-Perintah-fi-perubatan-pindaan-2017-fees-medical-amendment-order-2017.html
- Fees (Medical)(Cost of Services) order [Internet]. Attorney General's Chamber 2014. [cited 27 Nove 2019]. Available from: http://www.federalgazette.agc.gov.my/outputp/pua_20141231_P.U.%20(A)%20363_Perintah%20Fi%20(Perubatan)%20(Kos%20Perkhidmatan)%202014.pdf
- Shafie AA, Vasan Thakumar A, Lim CJ, et al. EQ-5D-5L valuation for the Malaysian population. Pharmacoeconomics. 2019;37(5):715–725.
- Doshi JA, Glick HA, Polsky D. Analyses of cost data in economic evaluations conducted alongside randomized controlled trials. Value Health. 2006;9(5):334–340.
- Nixon RM, Wonderling D, Grieve RD. Non-parametric methods for cost-effectiveness analysis: the central limit theorem and the bootstrap compared. Health Econ. 2010;19(3):316–333.
- Briggs AH, Wonderling DE, Mooney CZ. Pulling cost-effectiveness analysis up by its bootstraps: a non-parametric approach to confidence interval estimation. Health Econ. 1997;6(4):327–340.
- Savitz LA, Savitz ST. Can delivery systems use cost-effectiveness analysis to reduce healthcare costs and improve value. F1000Res. 2016;5:2575.
- Lim YW, Shafie AA, Chua GN, et al. Determination of cost-effectiveness threshold for health care interventions in Malaysia. Value Health. 2017;20(8):1131–1138.
- Saha S, Gerdtham UG, Johansson P. Economic evaluation of lifestyle interventions for preventing diabetes and cardiovascular diseases. Int J Environ Res Public Health. 2010;7(8):3150–3195.
- Abridged life tables, Malaysia, 2015–2017 [Internet]. Department of Statistics, Malaysia. 2017. [cited 18 Nov 2019]. Available from: https://www.dosm.gov.my/v1/index.php?r=column/pdfPrev&id=dkdvKzZ0K1NiemEwNlJteDBSUGorQT09
- The UKPDS risk engine: a model for the risk of coronary heart disease in Type II diabetes (UKPDS 56) [Internet]. University of Oxford. 2001. [cited 20 Apr 2020]. Available from: https://www.dtu.ox.ac.uk/riskengine/ukpds56.pdf
- Shafie AA, Ng CH. Cost-effectiveness of insulin glargine and insulin detemir in the basal regimen for naïve insulin patients with type 2 diabetes mellitus (T2DM) in Malaysia. Clinicoecon Outcomes Res. 2020;12:333–343.
- Abridged life tables, Malaysia, 2016–2018. [Internet]. Department of Statistics Malaysia. 2018. [cited 20 Feb 2020]. Available from: https://www.dosm.gov.my/v1/index.php?r=column/pdfPrev&id=aDV6TWxoU0NlNVBYN1hXM1Y0L2Jadz09
- Consumer price index Malaysia February 2020 [Internet]. Department of Statistics. 2020. [cited 14 Apr 2020]. Available from: https://www.dosm.gov.my/v1/index.php?r=column/pdfPrev&id=MFc0djV4akVKUlVUVU4ydVRDSE9PZz09
- Pharmacoeconomic Guidelines for Malaysia 2nd edition [Internet]. Ministry of Health. 2019. [cited 28 Jun 2020]. Available from: https://www.pharmacy.gov.my/v2/sites/default/files/document-upload/pharmacoeconomic-guidelines-malaysia-malaysia-second-edition-2019-final-page-adjustment.pdf
- Wannamethee SG, Shaper AG, Whincup PH, et al. Impact of diabetes on cardiovascular disease risk and all-cause mortality in older men: influence of age at onset, diabetes duration, and established and novel risk factors. Arch Intern Med. 2011;171(5):404–410.
- Dennis MS, Burn JPS, Sandercock PAG, et al. Long-term survival after first-ever stroke: the oxfordshire community stroke project. AHA J. 1993;24(6):796–800.
- Haffner SM, Lehto S, Ronnemaa T, et al. Mortality from coronary heart disease in subjects with type 2 diabetes and in nondiabetic subjects with and without prior myocardial infarction. N Engl J Med. 1998;339(4):229–234.
- Alias NEB. The impact of home medication review in patients with type 2 diabetes mellitus living in rural areas of kuantan [master’s thesis]. Malaysia: International Islamic University Malaysia; 2015.
- Chow EP, Hassali MA, Saleem F, et al. Effects of pharmacist-led patient education on diabetes-related knowledge and medication adherence: A home-based study. Health Educ J. 2016;75(4):421–433.
- Jokanovic N, Tan EC, Sudhakaran S, et al. Pharmacist-led medication review in community settings: an overview of systematic reviews. Res Social Adm Pharm. 2017;13(4):661–685.
- Yu J, Shah BM, Ip EJ, et al. A Markov model of the cost-effectiveness of pharmacist care for diabetes in prevention of cardiovascular diseases: evidence from kaiser permanente northern california. JMCP. 2013;19(2):102–114.
- Stratton IM, Adler AI, Neil HAW, et al. Association of glycaemia with macrovascular and microvascular complications of type 2 diabetes (UKPDS 35): prospective observational study. BMJ. 2000;321(7258):405–412.
- Cranor CW, Bunting BA, Christensen DB. The Asheville Project: long-term clinical and economic outcomes of a community pharmacy diabetes care program. J Am Pharm Assoc. 2003;43(2):173–184.
- Tinelli M, White J, Manfrin A. novel pharmacist-led intervention secures the minimally important difference (MID) in Asthma Control Test (ACT) score: better outcomes for patients and the healthcare provider. BMJ Open Resp Res. 2018;5(1):e000322.
- Li R, Zhang P, Barker LE, et al. Cost-effectiveness of interventions to prevent and control diabetes mellitus: a systematic review. Diabetes Care. 2010;33(8):1872–1894.
- Franz MJ, Splett PL, Monk A, et al. Cost-effectiveness of medical nutrition therapy provided by dietitians for persons with non–insulin-dependent diabetes mellitus. J Am Diet Assoc. 1995;95(9):1018–1024.
- Odnoletkova I, Ramaekers D, Nobels F, et al. Delivering diabetes education through nurse-led telecoaching. Cost-effectiveness analysis. PLOS One. 2016;11(10):e0163997.
- Belgium GDP [Internet]. Trading Economic. 2016. [cited 25 Jun 2020]. Available from: https://tradingeconomics.com/belgium/gdp-per-capita
- Bosmans JE, van der Laan DM, Yang Y, et al. The cost-effectiveness of an intervention program to enhance adherence to antihypertensive medication in comparison with usual care in community pharmacies. Front Pharmacol. 2019;10:210.
- Wallerstedt SM, Bladh L, Ramsberg J. A cost-effectiveness analysis of an in-hospital clinical pharmacist service. BMJ Open. 2012;2:e000329.
- Pettitt DA, Raza S, Naughton B, et al. The limitations of QALY: a literature review. J Stem Cell Res Ther. 2016;06(04):334
- Knapp M, Mangalore R. The trouble with QALYs. Epidemiol Psichiatr Soc. 2007;16(4):289–293.
- Garau M, Shah KK, Mason AR, et al. Using QALYs in cancer: a review of the methodological limitations. Pharmacoeconomics. 2011;29(8):673–685.
- Wilson PWF, D’Agostino RB, Levy D, et al. Prediction of coronary heart disease using risk factor categories. AHA J. 1998;97(18):1837–1847.
- Garrison LP, Mansley EC, Abbott TA, et al. Good research practices for measuring drug costs in cost-effectiveness analyses:a societal perspective: the ISPOR drug cost task force report—part II. ISPOR. 2010;13(1):8–13.
- Gage BF, Cardinalli AB, Albers GW, et al. Cost-effectiveness of warfarin and aspirin for prophylaxis of stroke in patients with nonvalvular atrial fibrillation. JAMA 1995;274(23):1839–1845.
- Lampe FC, Whincup PH, Wannamethee SG, et al. The natural history of prevalent ischaemic heart disease in middle-aged men. Eur Heart J. 2000;21(13):1052–1062.
- Brennan VK, Mauskopf J, Colosia AD, et al. Utility estimates for patients with Type 2 diabetes mellitus after experiencing a myocardial infarction or stroke: a systematic review. Expert Rev Pharmacoecon Outcomes Res. 2015;15(1):111–123.
- Clarke P, Gray A, Holman R. Estimating utility values for health states of type 2 diabetic patients using the EQ-5D (UKPDS 62). Med Decis Making. 2002;22(4):340–349.
- Lee KY, Wan Ahmad WA, Low EV, et al. Comparison of the treatment practice and hospitalization cost of percutaneous coronary intervention between a teaching hospital and a general hospital in Malaysia: a cross sectional study. PLoS One. 2017;12(9):e0184410.
- Aznida FAA, Azlin NMN, Amrizal MN, et al. The cost of treating an acute ischaemic stroke event and follow-up at a teaching hospital in Malaysia: a casemix costing analysis. BMC Health Services Research 2012;12(1):P6.