
Abstract
Background
This US claims-based study aimed to identify and characterize temporal trends in diagnostic pathways for patients likely to have neuromyelitis optica spectrum disorder (NMOSD).
Methods
Patients were identified from IBM MarketScan Commercial Databases if, within 1 year, they had two NMOSD claims separated by ≥ 60 days; two transverse myelitis (TM) or optic neuritis (ON) claims separated by ≥ 60 days, and one additional symptom (TM, ON, or area postrema syndrome); or one NMOSD claim and one additional symptom. The first NMOSD or TM/ON claim was the index date, and the second claim was the diagnosis date. Similar methodology was used in temporal trend and incidence and prevalence analyses.
Results
Among 1,901 patients with NMOSD, 34.2% were identified by two NMO claims, 53.2% by ON or TM +1 symptom, and 12.6% by one NMOSD claim +1 symptom. Anti–aquaporin-4 immunoglobin G (AQP4-IgG) autoantibody tests and magnetic resonance imaging was used for 23.0% and 71.9% of cases, respectively. Across cohorts, 21.4–49.1% had multiple sclerosis (MS) diagnosis claims prior to index date, and 37.3–60.6% had an MS diagnosis, 14.9–31.0% had MS disease-modifying therapy (DMT) claims and 6.3–44.8% had immunosuppressive therapy (IST) claims <1 year after diagnosis. Over time, there were slight changes in MS diagnosis claims, AQP4-IgG autoantibody testing, and DMT and IST use before and after NMOSD diagnosis.
Limitations
This study is limited by the information available in US claims databases, which included the potential for misclassification of NMOSD based solely on claims codes and lack of reimbursement for AQP4-IgG testing by insurance companies.
Conclusions
Among patients likely to have NMOSD, low AQP4-IgG testing rates, IST use, frequent MS diagnosis claims, and DMT use highlight the need for a diagnostic algorithm and timely treatment of NMOSD.
Introduction
Neuromyelitis optica spectrum disorder (NMOSD) is a rare autoimmune disease of the central nervous system, characterized by inflammatory lesions predominantly affecting the optic nerve(s) and spinal cordCitation1–3. In the US, approximately 15,000 patients have NMOSD, although the prevalence may be greater due to diagnostic challengesCitation1,Citation4–6. NMOSD has a similar presentation to multiple sclerosis (MS), with up to 40% of patients with NMOSD misdiagnosed with MSCitation1,Citation4,Citation7. The high potential for diagnostic overlap between NMOSD and MS may lead to the inappropriate use of MS disease-modifying therapies such as β interferons, natalizumab, fingolimod, and alemtuzumab, increasing the potential for aggravation of NMOSDCitation7,Citation8. Delays in diagnosis and inappropriate treatment arising from the rarity and diagnostic complexity of NMOSD can exact an immense toll on the patientCitation5,Citation6,Citation9,Citation10.
Detection of aquaporin-4 immunoglobulin G (AQP4-IgG) autoantibodies can differentiate NMOSD from MSCitation4,Citation11. The AQP4-IgG biomarker test demonstrates high specificity (>99%) for diagnosing NMOSD and the diagnostic guidelines for NMO were revised in 2015 to include AQP4-IgG serology testing and adoption of the broader term of “NMOSD” for patients with limited symptomsCitation12–14. Core clinical characteristics contributing to NMOSD diagnosis in the presence of AQP4-IgG include unilateral or bilateral acute optic neuritis (ON), longitudinally extensive transverse myelitis (TM), and area postrema syndrome (APS)Citation2,Citation12,Citation13. Further stringent clinical criteria are required when diagnosing AQP4-IgG–seronegative NMOSD or when serological testing has not been performedCitation12.
Insurance claims databases offer the opportunity to provide a real-world overview of diagnostic and clinical outcomes as well as healthcare utilizationCitation15. However, similar to other rare conditions, not all patients with NMOSD receive a diagnosis code on insurance claims for NMO (claims descriptions only use the term NMO) or any of the six core clinical characteristics of NMOSDCitation2. This confounds evaluation of the disease burden, treatment patterns, and healthcare resource utilization of NMOSD in US claims databases.
Without a validated claims-based algorithm to identify patients with NMOSD or NMO, it is potentially valuable to evaluate patients who were not coded as NMOSD, but experienced NMOSD-like clinical features, to understand if treatment patterns and healthcare resource utilization are similar to those for the NMOSD-coded population. These non-coded populations are potentially mis-coded NMOSD or may have a similar patient journey to those with NMOSD. Trends in the NMOSD diagnostic pathway since the introduction of consensus guidance are also lackingCitation13,Citation16,Citation17. We describe the results from a retrospective US claims-based study using diagnosis codes for NMO and core clinical symptoms to characterize temporal trends in diagnostic pathways for patients likely to have NMOSD, as well as quantify the potential misclassification of these patients.
Methods
Data source
Insurance claims data were extracted from the IBM MarketScan Commercial Claims and Encounters (CCAE) database between 2001–2017. The MarketScan CCAE database includes information on inpatient and outpatient medical and prescription claims, clinical utilization, and healthcare expenditure for individuals with employer-sponsored health insurance, as well as their spouses and dependentsCitation15. For incidence and prevalence analyses, the CCAE database and the Medicare Supplemental database from 2000–2019 were used. The commercial database consists of medical and drug data from employers and health plans for over 203 million individuals, encompassing employees, their spouses, and dependents who are covered by employer-sponsored private health insurance in the US. For the commercial database in the last 3 years (2015–2017) they have ∼40.7 million covered lives, all in the US, projectable to the US population covered by employer-sponsored insurance (58% of US population). For the Medicare supplemental database in the last 3 years (2015–2017) they have covered ∼2.6 million lives, all in the US (no percentage of population provided).
Separate patient selection criteria were applied to investigate NMOSD patient identification, temporal trends in NMOSD diagnosis, and incidence and prevalence of NMOSD. The index date was defined as the date of the first NMO or core NMOSD symptom claim, whereas the diagnosis date was the date of the second relevant claim. Patients were required to be enrolled continuously (medical and pharmacy coverage) for 1 year before and 1 year after the index date for the CCAE and Medicare Supplemental databases. Data were de-identified and comply with the Health Insurance Portability and Accountability Act and the Helsinki Declaration and its later amendments or comparable ethical standards.
Patient identification
Patients with a likely diagnosis of NMOSD were identified between 2001–2017 according to ICD 9 and/or the ICD 10 diagnostic codes (shown in Supplementary Table S1, note claims descriptions only use the term NMO) and grouped into the following cohorts if within 1 year they had (1) two NMO claims separated by ≥60 days; (2a) two claims for TM separated by ≥60 days and a claim for one additional symptom (TM, ON or APS); (2b) two claims for ON separated by ≥60 days and a claim for one additional symptom (TM, ON, or APS); and (3) one NMO claim and a claim for one additional symptom (TM, ON, or APS). The 60-day interval was used to provide greater confidence and rule out misdiagnosis, since the patient would be seen at least twice over at least 2 months (shown in Supplementary Figure S1a).
Temporal trends
Patients were identified as having NMOSD if they had two claims between 2001–2017 for NMO or one NMO and one NMOSD core symptom (TM, ON, or APS) claim within 1 year (shown in Supplementary Figure S1b).
Incidence and prevalence
Patients were identified as having NMOSD between 2000–2019 if they had ≥1 NMO inpatient claim and ≥1 NMO inpatient or outpatient claim separated by ≥60 days; or ≥2 NMO outpatient claims separated by ≥60 days or two claims for TM ≥6 months apart and a claim for ON anytime (shown in Supplementary Figure S1c). Patients could not have received disease-modifying therapy at any time or had a claim for MS between the index date and end of study period.
Study variables
For the patient identification and temporal trend analyses, baseline characteristics were extracted from identified patient claims data as well as AQP4-IgG autoantibody test, brain or spine magnetic resonance imaging (MRI), MS diagnosis, MS disease-modifying therapy, and immunosuppressant therapy (IST). MRI and AQP4-IgG autoantibody testing were measured within 30 days prior to and 6 months after the index date (initial claim). Claims for an MS diagnosis and use of disease-modifying therapy and IST were assessed in the year prior to the index date and the year after the diagnosis (second claim) date.
MS disease-modifying therapies included interferon β1a, interferon β1b, glatiramer acetate, natalizumab, alemtuzumab, ocrelizumab, dimethyl fumarate, fingolimod, and teriflunomide. ISTs comprised azathioprine, rituximab, mycophenolate mofetil, mitoxantrone, methotrexate, tocilizumab, and cyclophosphamide.
Statistical analysis
Descriptive statistics were calculated for all study variables across patient cohorts. Outcomes were assessed for the overall analysis period (2001–2017) and by time periods corresponding to changes in diagnostic criteria (2001–2005, 2006–2014 and 2015–2017). Prevalence and incidence rates were evaluated between 2001–2019 because incident patients required at least one year of baseline follow-up to be considered at risk. Prevalence was evaluated for all patients with continuous medical and pharmacy coverage, without gaps, for the year of interest. Incidence was evaluated for all patients with medical and pharmacy coverage, without gaps, for the year of interest and one-year clean period (i.e. no claims meeting the criteria for NMOSD) of continuous enrolment prior to the index year (applies to both medical and pharmacy enrolment). Results were summarized as counts and percentages for all categorical variables. All analyses were completed using SAS.
Results
Patient identification: characteristics
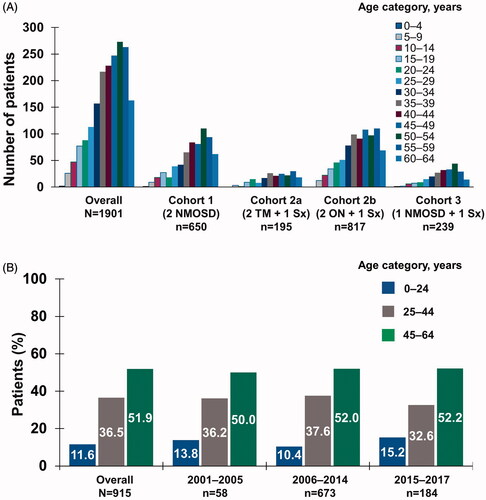
Overall, 1,901 patients were identified with a potential diagnosis of NMOSD between 2001 and 2017. Of these, 34.2% (Cohort 1, n = 650) were identified by two NMO ICD codes, 10.3% and 43.0% (Cohort 2a, n = 195 and Cohort 2 b, n = 817, respectively) by two TM or ON codes and one additional symptom, and the remaining 12.6% (Cohort 3, n = 239) by one NMO ICD code and one symptom. More than half of all patients (53.2%; n = 1,011) identified as potentially having NMOSD did not have an NMO claim.
Patients with an NMO claim had a mean age of 42.4 years and were mainly female (76.5%). There were no marked differences in mean age (41.6–43.5 years) or the proportion of females (73.2–78.3%) between cohorts, consistent with other findings (shown in )Citation18.
Figure 1. Age distribution at index date by (a) inclusion criteria cohort in patient identification analysis and (b) time period in temporal trend analysis. Abbreviations. NMOSD, neuromyelitis optica spectrum disorder; ON, optic neuritis; Sx, symptom; TM, transverse myelitis.
Patient identification: diagnostic tests and treatment patterns
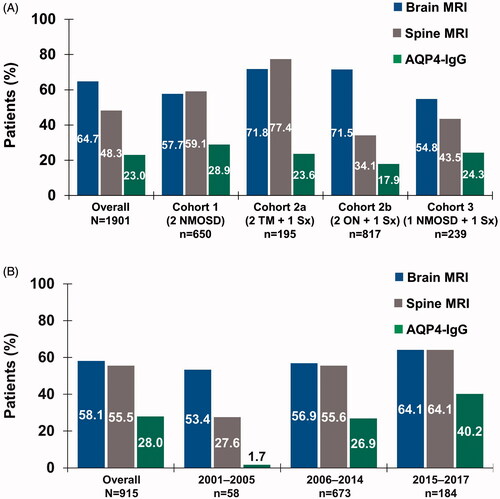
Of patients with a likely diagnosis of NMOSD or NMOSD core clinical features, AQP4-IgG biomarker testing frequency was low overall at 23.0% (shown in ). Overall, 64.7% of patients underwent a brain MRI, with the highest frequency in Cohort 2a (71.8%) and 2b (71.5%). Spine MRI was used for 48.3% of patients overall (shown in ).
Figure 2. Use of diagnostic testing by (a) inclusion criteria cohort in patient identification analysis and (b) time period in temporal trend analysis. Abbreviations. AQP4-IgG, aquaporin-4–immunoglobulin G; MRI, magnetic resonance imaging; NMOSD, neuromyelitis optica spectrum disorder; ON, optic neuritis; Sx, symptom; TM, transverse myelitis.
The proportions of patients receiving IST were 8.8% before diagnosis and 21.1% after diagnosis (shown in and Supplementary Table S2). Across cohorts, IST use increased more after diagnosis among patients with two NMO claims (14.8% prior to the index date vs 44.8% after diagnosis).
Figure 3. (a) IST and (b) disease-modifying therapy use by inclusion criteria cohort, before index date and after NMOSD diagnosis in patient identification analysis. (c) IST and (d) disease-modifying therapy use by time period in temporal trend analysis. Abbreviations. IST, immunosuppressive therapy; NMOSD, neuromyelitis optica spectrum disorder; ON, optic neuritis; Sx, symptom; TM, transverse myelitis.
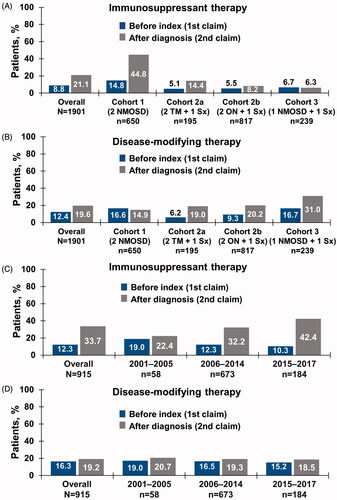
Claims for an MS diagnosis occurred in 34.6% of patients prior to the index date and in 48.2% after NMOSD diagnosis, demonstrating a similar trend in all cohorts (1: 49.1% and 60.6%, respectively; 2a: 29.2% and 46.2%; 2b: 21.4% and 37.3%; 3: 44.4% and 53.1%). DMT use corresponded to the patterns of MS diagnosis before and after NMOSD diagnosis across cohorts, with the highest use observed among patients with one NMO claim in Cohort 3 (16.7% and 31.0%) ().
Temporal trends: diagnosis and treatment
Overall, 915 patients had a likely diagnosis of NMOSD; 6.3% (n = 58) from 2001–2005, 73.6% (n = 673) from 2006–2014, and 20.1% (n = 184) from 2015–2017. Age range was 45–64 years throughout the time periods (shown in ).
Overall, 72.1% of patients had an MRI and/or an AQP4-IgG autoantibody test (30 days prior to through 6 months after the index date), with brain MRI being the most common overall until 2015–2017, when spine MRI reached an equivalent frequency (64.1%) (shown in , Supplementary Table S2). The diagnostic AQP4-IgG autoantibody test was 28.0%, with increased use over time to 40.2% from 2015–2017.
IST therapy was administered to 12.3% and 33.7% of patients overall prior to the index date and after diagnosis, respectively (shown in , Supplementary Table S2). Use of IST up to 1 year before diagnosis decreased slightly over time (19.3% to 10.3%), whereas use within 1 year after diagnosis of NMOSD progressively increased from 22.4% from 2001–2005 to 42.4% from 2015–2017 (shown in , Supplementary Table S2).
Slightly fewer than half of all patients had an MS diagnosis claim prior to NMOSD diagnosis (47.0%), whereas more than half of all patients had a claim for an MS diagnosis after NMOSD diagnosis (58.3%) (shown in Supplementary Table S2). The proportion of patients with MS diagnosis claims within a year prior to the NMOSD index date remained stable between 2001–2005 and 2015–2017 (44.8% and 45.7%, respectively), whereas MS diagnosis claims up to 1 year after the NMOSD diagnosis date slightly decreased from 58.6% to 55.4% during the same time period (shown in Supplementary Table S2). Use of MS disease-modifying therapy did not change before or after an NMOSD diagnosis. Disease-modifying therapy usage prior to the index date slightly decreased from 17.2% from 2001–2005 to 15.2% from 2015–2017 (shown in and Supplementary Table S2). The frequency of disease-modifying therapy use decreased after NMOSD diagnosis, with 20.7% from 2001–2005 to 18.5% from 2015–2017. In 2015–2017, the most common disease-modifying therapies were dimethyl fumarate (4.9%), glatiramer acetate (4.3%), and natalizumab (2.7%).
Temporal trends: incidence and prevalence
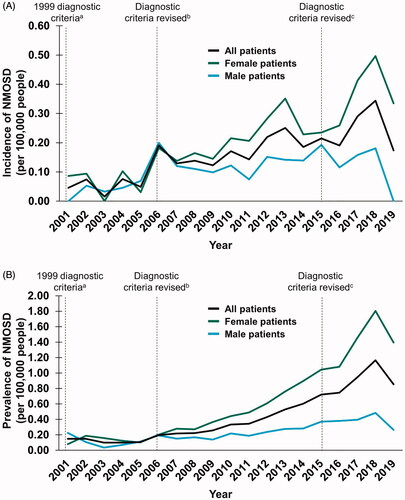
Overall, 1,090 patients with a likely diagnosis of NMOSD were identified between 2001–2019. The incidence and prevalence of NMOSD diagnosis increased from 0.05 to 0.17 and 0.15 to 0.85 per 100,000 people, respectively (shown in ). Similar trends were observed when the data were analysed by sex between 2001–2019, with peak incidence and prevalence rates in 2018 of up to 2-fold in males (0 to 0.18 and 0.22 to 0.48, respectively) and up to 22-fold in females (0.08 to 1.81 and 0.09 to 0.50, respectively) (shown in ).
Figure 4. Temporal trends in the (a) incidence and (b) prevalence of NMOSD between 2001 and 2019. a Criteria stipulated ON, acute myelitis and no symptoms indicative of CNS involvementCitation19; b Consensus criteria were revised to include requirements for ≥ 2 of the following: MRI evidence of a contiguous spinal cord lesion ≥ 3 segments in length, onset brain MRI nondiagnostic for MS or NMO-IgG seropositivityCitation20; c Consensus criteria were revised to include both NMOSD with AQP4-IgG and NMOSD without AQP4-IgG. An additional category of NMOSD with unknown AQP4-IgG status may be used for patients in whom serologic testing is unavailableCitation11. Abbreviations. AQP4-IgG, aquaporin-4–immunoglobulin G; MRI, magnetic resonance imaging; MS, multiple sclerosis; NMO, neuromyelitis optica; NMOSD, neuromyelitis optica spectrum disorder; ON, optic neuritis; TM, transverse myelitis.
Discussion
This US claims-based study aimed to identify and characterize temporal trends in diagnostic pathways for patients likely to have NMOSD using diagnostic codes for NMO and related core symptoms. A substantial number of patients with characteristics common to NMOSD were identified between 2001–2017, with a progressive increase in prevalence and incidence rates over time. Consistent with published evidenceCitation1,Citation3, identified patients with a likely diagnosis of NMOSD were more likely to be female and aged 45–64 years regardless of cohort or the time period evaluated.
Although lack of AQP4-IgG autoantibody testing prior to 2015 was expected, real-world use of the AQP4-IgG autoantibody test remained modest, with <50% of patients having claims for the AQP4-IgG autoantibody test in 2015–2017. AQP4-IgG autoantibody testing in NMO-coded patients was only approximately 25% and similar to patients without an NMO code, highlighting that even patients with a diagnosis are undertested. The high proportion of MS claims after the second claim for NMO or NMO core characteristics supports a period of diagnostic uncertainty that persists despite multiple claims for NMO. These observations imply delays in adopting AQP4-IgG testing and establishing accurate diagnosis that align with the observed time lag between the dissemination of the new diagnostic criteria in 2015 and increases in NMOSD incidence and prevalence. Differentiating a diagnosis of NMOSD from that of MS remains challenging despite the introduction of the AQP4-IgG autoantibody test and consensus guidance and indicates additional medical education activities are needed.
A goal of this study was to understand the misclassification of patients with NMOSD with other diseases, especially those misdiagnosed with MS. Analyses of healthcare resource utilization within 1 year prior to the index date or after NMOSD diagnosis did not show substantial differences in MS disease-modifying therapy usage between 2001–2017 despite changes to the diagnostic guidelines for NMOSD. IST aims to suppress acute inflammatory relapse and prevent future relapse in patients with NMOSD, a goal that was significantly aided by the elucidation of AQP4-IgG as a drug target in 2005Citation14. Although the proportion of diagnosed patients receiving IST therapy increased over time, fewer than half of patients were prescribed IST from 2015–2017, reflecting a sustained unmet need for timely diagnosis and treatment of NMOSD. The ISTs analyzed in this study are maintenance therapies for NMOSD; other acute therapies prescribed after NMOSD diagnosis include intravenous Ig, intravenous methylprednisolone, and plasma exchange and were not included in the analysis.
A limitation of this study is that analysis of insurance claims only uses the information available within the database. We were unable to determine which patients actually had a confirmed clinical NMOSD diagnosis. Although patients with NMOSD were identified using ICD 9 and ICD 10 diagnostic codes, there is the potential for misclassification of NMOSD based solely on these criteria. Claims for MS or NMO may be entered as rule-out codes instead of confirmed diagnoses, which could lead to inaccurate identification of patients with NMOSD. Also, AQP4 antibody testing only suggests the patient may have NMOSD and is not a firm diagnosis. Furthermore, claims for AQP4-IgG testing are based on the documented codes, but not all tests may be reimbursed by insurance companies and our estimated testing rates may be an underestimate of the true proportion. In this study, the diagnosis date represented the second relevant claim for NMOSD within a 1-year period. However, some patients may have had NMOSD without a second claim within 1 year, which means that our sample may be biased toward including more severe cases of NMOSD. These limitations present in claims data highlight the inability to properly identify patients with NMOSD and the need to develop a robust diagnostic algorithm to correctly diagnose NMOSD.
Findings from this real-world study highlight the need not only for NMOSD, but for rare diseases in general, to develop a validated diagnostic algorithm and establish accurate assessments of disease burden, treatment patterns, and healthcare resource utilization among patients. This will allow healthcare researchers to fully leverage the potential of real-world data to study outcomes in patients living with rare diseases.
Transparency
Declaration of funding
This work was sponsored by F. Hoffmann-La Roche Ltd. and Genentech, Inc. Support for third-party writing assistance, furnished by Anusha Bolonna, PhD, of Health Interactions, Inc., was provided by F. Hoffmann-La Roche Ltd.
Declaration of financial/other interests
A. Exuzides, C. Costantino, D. Sheinson, and P. Sidiropoulos are employees of Genentech, Inc., and shareholders of F. Hoffmann-La Roche Ltd. N. Wu was previously an employee of Genentech, Inc., at the time of the study.
A peer reviewer on this manuscript has disclosed that they have received institutional grants from Genentech. The peer reviewers on this manuscript have no other relevant financial relationships or otherwise to disclose.
Author contributions
All authors had full access to all the data in the study and take responsibility for the integrity of the data and the accuracy of the data analysis; all authors contributed substantially to the study design, data analysis and interpretation, and the writing of the manuscript.
Previous presentations
These data were previously presented at ECTRIMS 2019 and ACTRIMS 2020.
Supplemental Material
Download MS Word (135.5 KB)Acknowledgements
None reported.
Data availability statement
Qualified researchers may request access to individual patient-level data through the clinical study data request platform (https://vivli.org/). Further details on Roche’s criteria for eligible studies are available here (https://vivli.org/members/ourmembers/). For further details on Roche’s Global Policy on the Sharing of Clinical Information and how to request access to related clinical study documents, see here (https://www.roche.com/research_and_development/who_we_are_how_we_work/clinical_trials/our_commitment_to_data_sharing.htm).
References
- Kim SM, Kim SJ, Lee HJ, et al. Differential diagnosis of neuromyelitis optica spectrum disorders. Ther Adv Neurol Disord. 2017;10(7):265–289.
- Huda S, Whittam D, Bhojak M, et al. Neuromyelitis optica spectrum disorders. Clin Med. 2019;19(2):169–176.
- Hor JY, Asgari N, Nakashima I, et al. Epidemiology of neuromyelitis optica spectrum disorder and its prevalence and incidence worldwide. Front Neurol. 2020;11:501.
- Wildner, Paula, Stasiołek, Mariusz, Matysiak, Mariola, Differential diagnosis of multiple sclerosis and other inflammatory CNS diseases. Mult Scler Relat Disord. 2020;37:101452.
- Cook, Lawrence J, Rose, John W, Alvey, Jessica S, et al. Collaborative international research in clinical and longitudinal experience study in NMOSD. Neurol Neuroimmunol Neuroinflamm. 2019;6(5):e583.
- Ajmera MR, Boscoe A, Mauskopf J, et al. Evaluation of comorbidities and health care resource use among patients with highly active neuromyelitis optica. J Neurol Sci. 2018;384:96–103.
- Williamson M, McEnany M, Maxion-Bergemann S, et al. Epidemiologic temporal trends of neuromyelitis optic spectrum disorder in the United States From 2000 to 2015. Proceedings of the International Conference on Pharmacoepidemiology & Therapeutic Risk Management; 2018 Aug 22–26; Prague, Czech Republic; 2018.
- Weinshenker BG, Wingerchuk DM. Neuromyelitis spectrum disorders. Mayo Clin Proc. 2017;92(4):663–679.
- Beekman J, Keisler A, Pedraza O, et al. Neuromyelitis optica spectrum disorder: patient experience and quality of life. Neurol Neuroimmunol Neuroinflamm. 2019;6(4):e580.
- Stafkey-Mailey D, Boscoe A, Ajmera M, et al. A real-world analysis of relapses and costs of neuromyelitis optica spectrum disorders using a United States administrative claims database. Neurology. 2016;86(16 Supplement):P6.161.
- Jarius S, Wildemann B. Aquaporin-4 antibodies (NMO-IgG) as a serological marker of neuromyelitis optica: a critical review of the literature. Brain Pathol. 2013;23(6):661–683.
- Wingerchuk DM, Banwell B, Bennett JL, et al. International consensus diagnostic criteria for neuromyelitis optica spectrum disorders. Neurology. 2015;85(2):177–189.
- Wingerchuk DM, Weinshenker BG. Neuromyelitis optica spectrum disorder diagnostic criteria: sensitivity and specificity are both important. Mult Scler. 2017;23(2):182–184.
- Kessler RA, Mealy MA, Levy M. Treatment of neuromyelitis optica spectrum disorder: acute, preventive, and symptomatic. Curr Treat Options Neurol. 2016;18(1):2.
- Kulaylat AS, Schaefer EW, Messaris E, et al. Truven health analytics MarketScan databases for clinical research in colon and rectal surgery. Clin Colon Rectal Surg. 2019;32(1):54–60.
- Hamid SH, Elsone L, Mutch K, et al. The impact of 2015 neuromyelitis optica spectrum disorders criteria on diagnostic rates. Mult Scler. 2017;23(2):228–233.
- Kadish R, Parker T, Tanvir I, et al. Neuromyelitis Optica Spectrum Disorder (NMOSD): epidemiology, treatments, and outcomes in a single center. Neurology. 2020;94(15 Supplement):4629.
- Wingerchuk DM, Lennon VA, Lucchinetti CF, et al. The spectrum of neuromyelitis optica. Lancet Neurol. 2007;6(9):805–815.
- Wingerchuk DM, Hogancamp WF, O'Brien PC, et al. The clinical course of neuromyelitis optica (Devic's syndrome). Neurology. 1999;53(5):1107–1114.
- Wingerchuk DM, Lennon VA, Pittock SJ, et al. Revised diagnostic criteria for neuromyelitis optica. Neurology. 2006;66(10):1485–1489.