
Abstract
Aim
To explore the relationships between total fertility rate (TFR), utilization of assisted reproduction technology (ART), and gross domestic product (GDP) per capita in Europe.
Materials and Methods
Analysis of total ART cycles obtained from the latest European IVF-Monitoring Consortium (EIM) report for 2016. TFR, GDP and population size for that year were found in relevant World Bank data documents. In addition, this study compared two subgroups in Europe: developed economies and economies in transition, as defined by the UN. Pearson Correlations were calculated using Sigmaplot for utilization, GDP and TFR
Results
Forty countries were included in the 2016 EIM report. The mean utilization rate was 1,391 cycles per million population (C/M) (range = 162−3156) and mean TFR was 1.61 (range = 1.26−2.73). Mean GDP was $35,072 per capita (range = $10,610–$110,650). There was no correlation between TFR and utilization or GDP, however there was a significant positive correlation between GDP and utilization (correlation coefficient = 0.428; p = 0.00661). In the developed economies (n = 28) GDP and utilization were roughly 3-times higher than in the economies in transition (n = 11) ($42,710 vs $15,630; 1,674 vs 671), with a slightly lower TFR (1.58 vs 1.67). In the developed economies there was no correlation between GDP, TFR, and utilization, while in the economies in transition, the only significant correlation was GDP vs TFR (r = 0.69; p = 0.017).
Conclusions
There is a strong correlation across Europe between GDP and utilization of ART. This correlation does not exist within the developed economies. In Europe the utilization of ART treatment is dependent on national wealth and not on the TFR in the country.
Keywords:
Since the mid-twentieth century there has been a steady global decline in population reproduction measured by total fertility rate (TFR), defined as the average number of children a women would have assuming that current age-specific birth rates remain constant throughout her childbearing years (usually considered to be ages 15–49)Citation1. TFR is affected by level of education, religiosity, contraceptive use and availability of family planning programs, as well as national wealth, measured by GDP per capita; in countries with high GDP the TFR level is lower. Götmark and AnderssonCitation2 recently demonstrated that while the negative correlation between TFR and GDP existed in many regions such as Asia, Latin America, Arab Countries, and Sub-Saharan Africa, in Western and Eastern Europe TFR had no association with GDP. The authors speculated that in less economically-developed countries, the declined TFR can boost families’ wealth due to smaller numbers of dependent children, while in more economically developed countries, like in Europe, families could afford to have more children.
In contrast to the decline in TFR, the number of children born as a result of assisted reproduction technology (ART) – a relatively small part of national reproduction – has been growing steadily since it was pioneered in the late 1970s, and now contributes up to 4% of all new-born children in the EU and 1% in the USCitation3. The prevalence of ART treatment is defined as utilization of ART, which is the number of initiated cycles per million population (C/M) in a country.
We have shown for the first time that there is a strong correlation between GDP and utilization of in vitro fertilization (IVF) as more developed economies can establish public remuneration systems and patients who suffer from infertility can afford paying for the relatively expensive treatment out of pocketCitation4. Chambers et al.Citation4 indeed found that consumer affordability was the most significant factor affecting utilization in mid-to-high-income countries.
However, it is not known whether there is any correlation between TFR and ART utilization, and between TFR, ART, and GDP. For this purpose, we investigated the relationship between TFR and ART utilization in Europe, which has regular annual documented reporting of ART cycles in all its countries and hence less potential for bias. ART data is published annually by the European IVF-Monitoring Consortium (EIM) and the latest available report was for 2016 published in 2020Citation5. We included all ART cycles (i.e. fresh IVF and ICSI, frozen embryo transfer, egg donation, in vitro maturation, and frozen oocyte replacement cycles, as applicable). Utilization was mentioned only for countries reporting their cycles in full. For the others, we calculated utilization by extrapolating the proportional reporting clinics to total national cycles, and dividing by the country’s population for 2016, as available in the World Bank DataCitation6. To assess the contribution of national wealth we also evaluated and compared two sub-groups in Europe: developed economies (EU members plus Norway, Iceland, and Switzerland) and economies in transition, as defined by the United NationsCitation7. TFR and GDP for 2016 were available at the World Bank DataCitation7. Pearson correlations were calculated using Sigmaplot for ART utilization, GDP, and TFR in 2016.
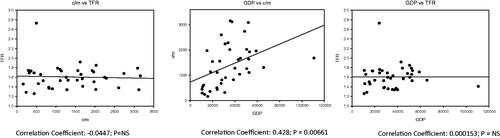
Forty countries were included in the 2016 EIM report. Four countries (Croatia, Georgia, Slovakia, and Turkey) did not submit a report for this year. Ireland was excluded from analysis because utilization could not be calculated as the total number of clinics was not provided. Our analysis demonstrated higher variability in GDP, utilization, and TFR in Europe as a whole. Mean GDP was $35,072 (range = $10,610–$110,650) with only four countries at mid-income level (Albania, Armenia, Moldova, and Ukraine). Mean TFR was 1.61 (range = 1.23–2.73) with only one country, Kazakhstan, with a TFR above the “replacement rate” – the rate at which the population exactly replaces itself from one generation to the next, excluding the effects of migration – at 2.1 children per woman. Mean utilization rate of ART was 1,391 (range = 162–3,157). There was no correlation between TFR and utilization or between TFR and GDP, however there was a moderate correlation between GDP and utilization (r = 0.43; p = 0.006; ).
Figure 1. Correlation between GDP, utilization of ART and TFR in Europe in 2016. ART, assisted reproduction technology; C/M, cycles per million population; TFR, total fertility rate; GDP, gross domestic product.
In the developed economies (n = 28), GDP and utilization were roughly 3-times higher than in the economies in transition (n = 11) ($42,710 vs $15,630; 1,674 vs 671) with a slightly lower TFR (1.58 vs 1.67) (). The European Society of Human Reproduction and Endocrinology (ESHRE) working group estimated that sufficient level of ART provision is approximately 1,500 C/MCitation8. Our data shows that while the provision is sufficient in the developed economies (average = 1,674 C/M) it was well below the recommended level (average = 671 C/M) in the economies in transition (). In the developed economies there was no correlation between GDP, TFR, and utilization, while in the economies in transition, the only significant correlation was GDP vs TFR (r = 0.69; p = 0.017); however, when Kazakhstan, which is substantially different from other countries in this group (TFR = 2.73) is excluded, there is no correlation between GDP and TFR (r = 0.53; p = 0.11).
Table 1. Utilization of ART, TFR, and GDP in developed economies and economies in transition in Europe in 2016a,b.
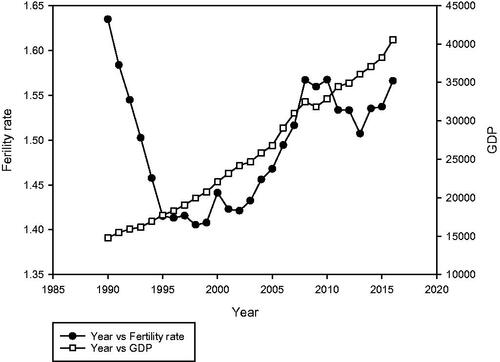
Europe has experienced continuous year-on-year drops in TFR. European Union data showed a TFR of 2.57 in 1961, passing the replacement level in 1975 and at the lowest at 1.41 in 1998. Since then, there has been a slight increase to 1.57 by 2016Citation7. While globally TFR is negatively correlated to GDP, in Europe there is no such dependency and both have been increasing since the early 1990s (). This can be explained by two factors. Firstly, the current TFR is so low that it is well below the replacement rate, with the majority of families having only one or two children, therefore there is hardly any room for further reduction in the number of children that will be acceptable by the majority of the population. Secondly, with constantly improving wealth since the end of the Second World War and with most countries in Europe in the high-income bracket, there is no strong drive to reduce the number of dependent children any further. The difference in a slight increase of TFR in last two decades contrasts with significant growth of ART treatment at the same period of nearly 5-fold up, to more than 900,000 cycles in 2016.
Figure 2. Longitudinal changes in TFR and GDP in Europe since the early 1990’s.
We have shown for the first time that in Europe the utilization of ART treatment is associated with national wealth and not on the TFR of the country. This data confirms our previous global findings on correlation between national wealth (GDP) and utilization of IVFCitation4, and this association exists even in an economically-advanced region like Europe which is comprised mostly of high-income countries, with none in the low-income classification. However, among the subgroup of more developed countries – the European Economic Area (EEA) members - this correlation is not observed. Similarly, among the weaker economies of outside of the EEA, there is no correlation between the two variables probably due to less variability in GDP per capita (range = $10,610–$24,125). The analysis demonstrated the natural difference between relative national stagnation of reproduction and the individual needs of patients and couples who suffer from infertility to have their own children and therefore the findings do not contradict themselves.
The limitations of our commentary are that the relationships were a snapshot of a single (latest) year with available data, but it is unlikely that results would have been different in any other year. We used extrapolation to calculate the utilization rate. We assumed that the distribution of treatment in non-reporting clinics was like those who reported. However, in total 1,347 clinics reported their cycles out of 1,467 (91.8%) clinics in the region, with 97% reporting in the developed economies and 70.6% in the economies in transition. There were only two countries with extremely low reporting of <25% – Albania (10%) and Bosnia-Herzegovina (16.7%) – and, when excluding them for the calculation of correlation between GDP and utilization rate, the correlation coefficient remained positive (r = 0.38, p = 0.019). Moreover, the contribution of these two countries was 0.26% of the total calculated cycles in Europe, hence the impact of the missing data is probably negligible.
This commentary examines associations and not causal effects of some of the parameters effecting the utilization rate of ART treatments. It clearly demonstrates that even in a relatively well-off continent like Europe there is a correlation between national wealth and utilization of ART and that provision of such treatment in the economies in transition is not sufficient. It will be of interest to compare and comprise similar analysis in other regions, provided that the reporting level is improved, and to further understand the reasons and differences in fertility provision and utilization across the globe, which will enable better understanding in planning and implementing reproductive health policies.
Transparency
Declaration of funding
No funding was received to produce this article.
Declaration of financial/other interests
The authors did not receive any financial or any other support for this manuscript and have no other relevant financial relationships to disclose.
Peer reviewers on this manuscript have no relevant financial or other relationships to disclose.
Acknowledgements
None stated.
References
- Population Reference Bureau https://www.prb.org/international/indicator/fertility/snapshot/. [cited 2021 February].
- Götmark F, Andersson M. Human fertility in relation to education, economy, religion, contraception, and family planning programs. BMC Public Health. 2020;20(1):265.
- De Geyter C. Assisted reproductive technology: impact on society and need for surveillance. Best Pract Res Clin Endocrinol Metab. 2019;33(1):3–8.
- Chambers GM, Hoang VP, Sullivan EA, et al. The impact of consumer affordability on access to assisted reproductive technologies and embryo transfer practices: an international analysis. Fertil Steril. 2014;101(1):191–198.e4.
- European IVF-monitoring Consortium (EIM)‡ for the European Society of Human Reproduction and Embryology (ESHRE), Wyns C, Bergh C, et al. ART in Europe, 2016: results generated from European registries by ESHRE. Hum Reprod Open. 2020;2020(3):hoaa032.
- https://data.worldbank.org/indicator. [cited 2021 March 2].
- World Economic Situation and Prospects 2016: Global Economic Outlook. https://www.un.org/development/desa/dpad/wp-content/uploads/sites/45/publication/2016wesp_stats_en.pdf. [cited 2021 March 2].
- The ESHRE Capri Workshop Group. Social determinants of human reproduction. Human Reprod. 2001;16(7):1518–1526.