
Abstract
Objective
Pembrolizumab + chemotherapy substantially extends life expectancy for metastatic non-small cell lung cancer (NSCLC) patients. Its cost-effectiveness (CE) was previously evaluated based on interim trial analyses (follow-up ∼1 year). The present analysis describes CE incorporating additional follow-up based on protocol-specified final trial analyses (1–1.5 years additional follow-up), from a US healthcare payer perspective.
Methods
A partitioned survival model is used to compare pembrolizumab + chemotherapy vs chemotherapy using data from the KN189 (non-squamous patients) and KN407 (squamous patients) clinical trials. An indirect treatment comparison vs pembrolizumab monotherapy is made for patient subgroups with PD-L1 TPS ≥50% and 1–49% based on data from the KN024 and KN042 trials. Efficacy, treatment utilization, health utility, and safety data are derived from trials and projected over 20 years. Costs for drugs, non-drug disease management, and adverse events are also incorporated.
Results
Overall, versus chemotherapy alone, pembrolizumab + chemotherapy is projected to increase life expectancy by 1.12 years (3.35 vs 2.23) and 0.67 years (3.17 vs 2.50) in non-squamous and squamous patients, respectively. Resultant ICERs ($158,030/QALY and $178,387/QALY) are below a US 3-times GDP per capita threshold ($195,000/QALY). ICERs vs chemotherapy also generally fall below the threshold within PD-L1 sub-groups (except in squamous PD-L1 < 1%, which may have differed due to small sample size) while ICERs vs pembrolizumab monotherapy in PD-L1 ≥ 50% and 1–49% sub-groups generally exceed it (except in squamous PD-L1 1–49%); largely a result of the higher drug acquisition cost of pembrolizumab + chemotherapy relative to differences in life expectancy.
Conclusions
Taken together, with longer-term trial follow-up and in the context of prior literature, in the US, one of the two options for pembrolizumab use (either pembrolizumab + chemotherapy or pembrolizumab monotherapy), represents a cost-effective treatment in virtually all non-squamous and squamous metastatic NSCLC patient populations and PD-L1 sub-groups evaluated.
Introduction
Pembrolizumab (Keytruda) in combination with chemotherapy is approved in the US and many other countries for the treatment of metastatic non-small cell lung cancer (NSCLC). Specifically, pembrolizumab in combination with carboplatin/cisplatin (platinum) and pemetrexed has been approved for US use in metastatic non-squamous patients with no epidermal growth factor receptor (EGFR) or anaplastic lymphoma kinase (ALK) genomic tumor aberrations, and pembrolizumab + carboplatin and nab-paclitaxel/paclitaxel has been approved in metastatic squamous NSCLCCitation1. In metastatic NSCLC, pembrolizumab monotherapy has also been approved in the US for treatment of patients whose tumors have programmed death-ligand 1 (PD-L1) expression (Tumor Proportion Score [TPS] ≥ 1%) without EGFR/ALK aberrationsCitation1.
Previously we reported on the cost-effectiveness of pembrolizumab + chemotherapy versus chemotherapy Phase 3 trial comparators, and pembrolizumab monotherapy, in metastatic non-squamousCitation2 and squamousCitation3 US NSCLC patients based on interim trial analysis data (non-squamous KEYNOTE-189 [KN189] and squamous KEYNOTE-407 [KN407] trials), with median follow-up time from patient enrollment to the data cut-off date of ∼1 year. More recently, updated protocol-specified final clinical trial analyses have been reported, reflecting an additional 1.1 years (KN407) and 1.5 years (KN189) of patient follow-upCitation4,Citation5. At the final analyses, a substantial improvement in overall survival with pembrolizumab + chemotherapy vs chemotherapy was observed in both trials, with hazard ratios (HR) of 0.56 (95% confidence interval [CI] = 0.46–0.69) and 0.71 (0.58–0.88) for patients with non-squamous and squamous histologies in KN189 and KN407, respectively. At 2-year follow-up for KN189, for non-squamous patients, overall survival was 45.7% in the pembrolizumab + chemotherapy arm, as compared to 27.3% in the chemotherapy arm, while in KN407, for squamous patients, overall survival was 37.5% and 30.6%, respectively, at this time point. The present evaluation updates previous cost-effectiveness analysis findings based on protocol-specified final analysis data from these trials.
Methods
Detailed descriptions of the model populations, structures, comparators, and inputs are provided in earlier cost-effectiveness model publications for each indicationCitation2,Citation3. Herein we describe in brief, with an emphasis on updated methods and data included within the present modeling.
Model overview
Target population
Metastatic non-squamous and squamous NSCLC patients are modeled per US approved indications for pembrolizumab + chemotherapyCitation1.
Model structure
Three-state partitioned survival cohort simulation models for the KN189 and KN407 indications are used with health states of progression-free state (PF), progressed-disease state (PD), and death.
Model comparators
The primary comparators in the models are the chemotherapy arms in KN189/KN407. Indirect comparison (ITC) to pembrolizumab monotherapy is evaluated within subgroup analyses of patients with PD-L1 ≥ 50% and 1–49%, as these encompass the currently approved first-line US indication for monotherapy, based on the KN024Citation6 (PD-L1 ≥ 50%) and KN042Citation7,Citation8 (PD-L1 ≥ 1%) trials. Specific treatment regimens modeled are:
Non-squamous NSCLC
Carboplatin area under the curve (AUC) 5 or Cisplatin 75 mg/m2, every 3 weeks for four cycles.
Pemetrexed 500 mg/m2 every 3 weeks for four cycles, followed by maintenance Pemetrexed.
In Combination with vs without
Pembrolizumab 200 mg once every 3 weeks, for up to 35 cycles (2 years).
Squamous NSCLC
Carboplatin area under the curve (AUC) 6, every 3 weeks for four cycles.
Paclitaxel 200 mg/m2 every 3 weeks or nab-Paclitaxel 100 mg/m2 once weekly, over four 3-week cycles.
In Combination with vs without
Pembrolizumab 200 mg once every 3 weeks, for up to 35 cycles (2 years).
Perspective
The analysis is conducted from the perspective of a US third-party healthcare payer.
Time Horizon
The median follow-up available in KN189 and KN407 from the start of follow-up for each patient to the May 20, 2019 and May 9, 2019 cut-off dates was 31.0 months (range = 26.5–38.8) and 23.3 months (range = 16.4–32.7), respectively. Beyond the trial duration, survival data is extrapolated and, in the model base case, a 20-year time horizon is used for practical considerations, as <5% of non-squamous and squamous patients initiating pembrolizumab + chemotherapy are modeled to survive beyond this time point.
For comparisons to pembrolizumab monotherapy, as described in greater detail in earlier workCitation2,Citation3, an individual patient data (IPD)-based indirect treatment comparison was undertaken using final analysis data from the KN024 (July 10, 2017 data cut-off; as previously used) and KN042 (September 4, 2018 data cut-off; updated from February 26, 2018 data cut-off previously used) trials. For completeness, for non-squamous metastatic patients, data from the KN021GCitation9 (May 31, 2017 data cut-off) phase 2 trial preceding KN189 were also included within the indirect treatment comparison and pooled with that from KN189.
Discount rate
Costs and health outcomes are discounted at a rate of 3% per yearCitation10.
Clinical efficacy and utilization parameters – KN189/KN407 trial populations
Data sources and sub-groups for effectiveness outcomes
The model effectiveness parameters utilize KN189 and KN407 patient-level data for time on treatment (ToT), progression-free survival (PFS), and overall survival (OS)Citation4,Citation5. In the case of OS, extrapolation beyond the trial was further informed by US Surveillance Epidemiology and End Results (SEER) dataCitation11 from 1992 to 2014 using an approach developed within earlier published modelingCitation3,Citation12, and which will be subsequently described. Effectiveness parameters are estimated for the overall trial population as well as subgroups of patients with PD-L1 ≥ 50%, 1–49%, and <1%.
Modeling time-on-treatment
For KN189, 2% of patients were still receiving pembrolizumab + chemotherapy treatment as of the longest available follow-up time, and a best fitting generalized gamma parametric function was fit to KM ToT data, based on Akaike Information Criterion (AIC) and Bayesian information criterion (BIC) as well as visual inspection, to provide a complete curve (Supplemental Material – Figure S1). In KN407, no patients were still receiving pembrolizumab + chemotherapy or chemotherapy alone among those with the longest available follow-up times and time on treatment was directly estimated from Kaplan-Meier (KM) data (Supplemental Material – Figure S2).
Modeling progression-free survival
As described in earlier workCitation2,Citation3, two-piece parametric fittings for PFS were estimated for each trial arm in KN189 and KN407 with use of Chow Tests, cumulative hazard functions, AIC/BIC values, and visual inspection to determine specifications (Supplemental Material – Figures S3–S4). For KN407, for both trial arms, the Chow test and AIC/BIC criteria suggested a week 27 KM cut-point and subsequent fitting of a Weibull distribution. For KN189, there was a much later peak change in slope and associated KM cut-point for the pembrolizumab + chemotherapy arm (week 82) as compared to the chemotherapy arm (week 21), with best fitting exponential and generalized gamma distributions modeled thereafter, respectively.
Modeling overall survival
In earlier cost-effectiveness model publications for the KN189 and KN407 indicationsCitation2,Citation3, we reported that traditional parametric extrapolation of overall survival beyond the trial period resulted in annual mortality risks for the chemotherapy arm that greatly exceeded population-based mortality risks for metastatic NSCLC patients within SEER during the period prior to the availability of pembrolizumab, when chemotherapy was the predominant available treatment. A similar finding was observed when modeling best fitting parametric curves with additional trial follow-up in the present analysis. Therefore, as in the earlier analyses, an alternate approach is used within the model base case, in which extrapolation of OS beyond the trial is informed by SEER data, as will be subsequently described.
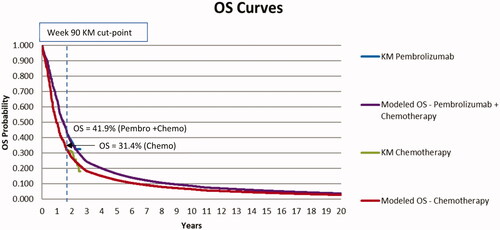
As more fully described in earlier workCitation2,Citation3, for the base case modeling approach for OS for trial chemotherapy arms, KM data from each trial were used up to a cut-point, followed by modeling of weekly mortality risks based on data from SEER for NSCLC patients matched to KN189 and KN407 trial patients by disease stage, histology and time from diagnosis to the start of follow-up. For KN189, in selecting a KM cut-point, there is extensive censoring within the chemotherapy arm overall (as well as in the pembrolizumab + chemotherapy arm) in KN189 beyond week 112, with sparse events thereafter, particularly within the PD-L1 subgroups and KM data were therefore modeled up to this time point. Analogously, in KN407, beyond week 90, there is a discontinuity in the decline in the survival function (no deaths observed over next 12 weeks) in the chemotherapy arm overall, associated with heavy administrative censoring/sparse observations thereafter, and KM data were therefore modeled up to the week 90 time point.
For the chemotherapy arms, in evaluating the suitability of SEER data for subsequent OS extrapolation, annual mortality risks within observed chemotherapy arm KM data for the overall trial population during the year prior to the week 112 cut-point (weeks 61–112) in KN189 (38.3%), and for available follow-up beyond year 1 between weeks 53 and 90 in KN407 (36.7%), were compared to mortality risks over an analogous time period within SEER. The associated mortality risks for patients corresponding to the KN189 (weeks 61–112) and KN407 (weeks 53–90) populations in SEER data were 45.7% and 46.4%, respectively. Though reasons for the lower observed mortality risks in KN189 and KN407 cannot be precisely determined, potential factors may include the impact of trial inclusion criteria leading to a healthier enrolled cohort, use of immunotherapies in second line treatment and beyond within the trial which were not available within the time frame of the SEER data, and availability of newer chemotherapy and other non-immunotherapy regimens post-discontinuation within the trial. To better approximate the anticipated subsequent survival experience of individuals in the chemotherapy arms of the KN189 and KN407 trials after week 112 for KN189 and week 90 for KN407, subsequent SEER-based mortality annual risks in the chemotherapy arms were “risk-adjusted” by the ratio of mortality risks observed in KN189 and KN407 to SEER data during the latter portion of mature KM data available, reflecting factors of 0.84 (38.3%/45.7%) over weeks 61–112 and 0.79 (36.7%/46.4%) over weeks 53–90, respectively. Annual mortality risks based on SEER data have been reported previously, and adjusted chemotherapy arm risks used in the present analyses beyond available KM data at weeks 112 and 90 for the two respective trials are described in the Supplementary Material (Table S1). These risks were applied for overall trial populations as well as in the PD-L1 sub-groups.
For the pembrolizumab + chemotherapy arm, OS KM data were similarly modeled up to cut-points of 112 weeks (KN189) and 90 weeks (KN407). In trial year 1 of KN189, the relative risk (RR) for pembrolizumab + chemotherapy versus chemotherapy was 0.57 (95% CI = 0.48–0.71), while during the year prior to the OS KM cut-point in KN189 (weeks 61–112), the RR for mortality between the pembrolizumab + chemotherapy and chemotherapy arms was 0.92 (95% confidence interval [CI] = 0.68–1.32) in the overall trial population.
Analogously, in KN407, the RR for mortality with pembrolizumab + chemotherapy versus chemotherapy during year 1 of the trial was 0.70 (95% CI = 0.57–0.85), while the RR was 0.96 (95% CI = 0.71–1.31) during year 2 from week 53 up to the week 90 cut-point. For the purposes of modeling, it was therefore assumed that the same annual mortality risks (converted to weekly risks for modeling) occurred for the pembrolizumab + chemotherapy and chemotherapy arms beyond weeks 112 (KN189) and 90 (KN407) within the models. Thus, the adjusted SEER-based mortality risks reported in Supplementary Material Table S1 for the chemotherapy arms were also applied within the pembrolizumab + chemotherapy arms. Although similar mortality risks are modeled beyond the weeks 112 and 90 cut-points in KN189 and KN407, respectively, it should be noted that by these time points a substantively higher proportion of patients were surviving in the pembrolizumab + chemotherapy as compared to the chemotherapy arm (43.3% vs 25.9% in KN189 and 41.9% vs 31.4% in KN407). and display OS curves by treatment arm within the overall trial population in KN189 and KN407, where data through weeks 112 and 90 reflect trial KM data and thereafter the SEER population-based extrapolation approach just described.
Figure 1. Overall survival by treatment arm for KN189 (non-squamous) analysis. Abbreviations. KM, Kaplan-Meier; OS, Overall Survival.
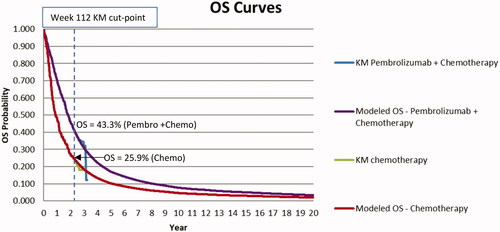
Figure 2. Overall survival by treatment Arm for KN407 (Squamous) analysis. Abbreviations. KM, Kaplan-Meier; OS, Overall Survival.
Within PD-L1 sub-groups, sample sizes are smaller and estimates subject to greater variability. However, relative risks in KN189 during weeks 61–112 for the PD-L1 ≥ 50% (1.19, 95% CI = 0.65–3.13) and PD-L1 1–49% (1.13, 95% CI = 0.68–2.41) sub-groups were also each around 1.0. The relative risk for the PD-L1 < 1% sub-group was 0.69 (95% CI = 0.44–1.26). It is possible that the variation observed in relative risks between the PD-L1 sub-groups is a product of statistical noise given smaller sample sizes, as evidenced by the overlap between confidence intervals and point estimates. As a result of these observations, it was therefore elected to also model KM data directly for each PD-L1 sub-group through week 112 in each KN189 trial arm, followed by adjusted SEER-based mortality risks thereafter, utilizing the same assumptions as for the overall population (identical SEER-adjusted risks for both trial arms during the period of extrapolation, based on the values obtained for the overall trial population).
Within PD-L1 sub-groups in KN407, the point at which discontinuities occur in the survival function associated with heavy administrative censoring/sparse data are generally reached at a slightly earlier time point than in the overall trial population, around week 85. This time point was considered too early, and data too sparse, to provide a meaningful assessment of mortality relative risks during year 2 of the trial for PD-L1 sub-groups. However, HRs reported over the full trial time period are not statistically different between the PD-L1 ≥ 50% (0.79, 0.52–1.21), PD-L1 1–49% (0.59, 0.42–0.84), and PD-L1 < 1% (0.79, 0.56–1.11) sub-groupsCitation5,Citation13. Given this lack of differentiation, it was elected to model KM data directly for each PD-L1 sub-group through week 85 in each arm, followed by identical adjusted SEER-based mortality risks thereafter.
Indirect treatment comparison to pembrolizumab monotherapy for patients with PD-L1 ≥ 50% and PD-L1 1–49%
Statistical comparisons of OS and PFS were made utilizing the Bucher method for indirect treatment comparisonsCitation14, with Inverse Probability of Treatment Weighting (IPTW) methodsCitation15 used to balance differences in patient characteristics across each trial arm analyzed. Due to differences in trial protocols between KN042 and KN189/KN407 as relates to within-trial cross-over to pembrolizumab, there was an imbalance in the use of immunotherapies among patients receiving a post-discontinuation therapy in the chemotherapy arms within the trials. Analyses were therefore also adjusted for switching in the chemotherapy arms using a 2-stage methodCitation16,Citation17 to remove the effects of the imbalance. The proportional hazards assumption was tested using a stratified Cox proportional hazard model with Efron’s method of tie handling using the approach of Grambsch and TherneauCitation18.
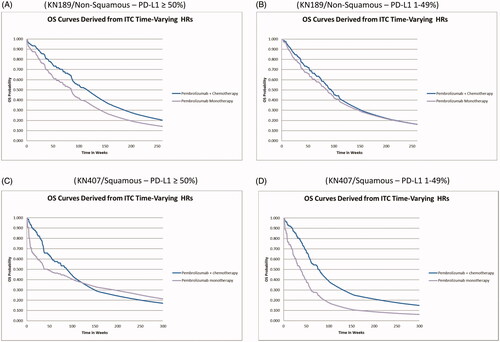
There was a departure from a proportional hazards assumption for hazard ratios within multiple PD-L1 sub-groups of interest and therefore time-varying HRs were assumed in the model base case. OS and PFS data were obtained from individual trials and time-varying HRs estimated based on generalized Fractional Polynomial, Gompertz, Log-Logistic, and Weibull models.
Within the KN189 and KN407 ITCs, the log-logistic distribution was found to be the best fitting clinically plausible distribution for OS and PFS and was implemented within the model. Based on administrative censoring patterns due to the end of available follow-up from each trial, HRs for OS and PFS were based directly on the indirect treatment comparison through just under 3 years for OS in the KN189 ITC and 2 years for OS in the KN407 ITC (due to shorter follow-up available in that trial) and 2 years for PFS. Associated HRs are reported in the Supplementary Material (Tables S2 and S3).
Beyond the last reported time point for HRs, it is likely that HRs would continue to evolve over time. In the case of the KN407 ITC, where KN407 data within the ITC were only evaluable through 2 years, further insights for the PD-L1 ≥ 50% population were gathered from looking at year 3 data within the KN024 trial (Supplementary Material Table S4) for pembrolizumab monotherapy (year 3 data contained much greater censoring in KN042)Citation19. In KN024, the annual mortality relative risk for pembrolizumab monotherapy vs chemotherapy in the overall trial population, as well as squamous patients, consistently remains below 1.0 through 3 years of trial follow-up, without any evidence of waning. This contrasts with relative risk assumptions for KN407 where the relative risk for pembrolizumab + chemotherapy vs chemotherapy is modeled to return to 1.0 after 85 weeks of follow-up within the PD-L1 L1 ≥ 50% and 1–49% sub-groups. On the basis of the continued persistence of similar relative risks through at least 3 years in KN024 in the PD-L1 ≥ 50% sub-group, without evidence of waning, the KN407 ITC HRs for OS and PFS for the PD-L1 ≥ 50% sub-group for pembrolizumab monotherapy vs pembrolizumab + chemotherapy were modeled to remain at their month 24 values through 3 years of follow-up.
Beyond the year 3 time point for the KN407 ITC PD-L1 ≥ 50% sub-group, and within the other ITC analyses, it is assumed that the observed HR at the last available time point linearly returns to a value of 1.0 (no difference in OS/PFS HRs between regimens) by the end of model year 5. This assumption is informed by the limited maximum duration of use for pembrolizumab monotherapy (∼2 years) and the observation that metastatic non-squamous NSCLC survivors in the SEER database in years 6 and beyond exhibit annual mortality risks consistent with much lower mortality and greater disease control, though disease control is not specifically assessed within SEER.
Modeled OS curves for pembrolizumab monotherapy, along with those for pembrolizumab + chemotherapy within the PD-L1 ≥ 50% and 1–49% sub-groups are illustrated in .
Figure 3. OS curves for pembrolizumab monotherapy and pembrolizumab + chemotherapy by trial analysis and PD-L1 sub-group. (A) KN189/Non-Squamous – PD-L1 ≥ 50%. (B) KN189/Non-Squamous – PD-L1 1–49%. (C) KN407/Squamous – PD-L1 ≥ 50%. (D) KN407/Squamous – PD-L1 1–49%.
Time on treatment for pembrolizumab monotherapy was not directly evaluated in the ITC and time on treatment KM data from KN024/KN042 were initially obtained to estimate. As patient follow-up data were generally available beyond 2 years for patients in KN024 and KN042, KM data were used directly, without parametric extrapolation. However, for modeling purposes, as both OS and PFS for pembrolizumab monotherapy were adjusted via the previously described indirect treatment comparison to pembrolizumab + chemotherapy, it was also elected to adjust treatment duration relative to observed values. This was accomplished by taking weekly ITC-adjusted PFS values for pembrolizumab monotherapy and applying the ratio of ToT to PFS observed at each week in relevant non-squamous/squamous cohorts within the monotherapy trial(s) to generate an ITC-adjusted ToT curve for pembrolizumab monotherapy (Supplemental Material – Figures S5 and S6). Effectively, this allows for a higher use of pembrolizumab relative to in KN024 and/or KN042 if pembrolizumab monotherapy PFS has been adjusted upward by the ITC relative to PFS observed in the trial, and a lower use of pembrolizumab if PFS has been adjusted downward.
Risk of adverse events (AEs)
Based on National Cancer Institute (NCI) Common Terminology Criteria for Adverse Events (CTCAE) version 4.0Citation20, the model includes risks of all-cause adverse events (AEs) of Grade 3+ (Supplementary Material Tables S5 andS6) reported in ≥5% of patients within an either arm in each trial (KN189 and KN407), as well as in KN024 for the indirect treatment comparator of pembrolizumab monotherapy (preferentially selected over KN042 due to longer available follow-up). Per clinician recommendation, the risk of pneumonitis is also included, based on a relationship with pembrolizumab use.
Health utility inputs
Model inputs for utility values () are based on US scoredCitation21 EuroQOL-5D (EQ-5D) 3-level utility data collected from patients enrolled in the KN189, KN407, and KN024 trials (utility data were not collected in KN042). A time-to-death approach (≥360, 180 to <360, 30 to <180 and <30 days to death), reflecting the decline in cancer patients’ quality-of-life as they approach death, is used for modeling utilities as previously described, with normalization of pembrolizumab monotherapy utility values with respect to chemotherapy arm utility values observed in KN024 and KN189/KN407, so as to adjust for potential differences in patient characteristics between trialsCitation2,Citation3. Trial-based health utility values for each time-to-death category were then mapped to the cost-effectiveness model based on the proportion of patients at each weekly time point estimated to fall within the relevant number of days to death within the model, with total QALYs for each intervention estimated via a cumulative summation over the model time horizon.
Table 1. Summary of Key KN189 and KN407 cost-effectiveness model analysis inputs.
Resource use and costs
All costs reported for years prior to 2019 are updated to 2019 US dollars (USD), reflecting the year of analysis of the updated KN189/KN407 data sets, using the Medical Care component of the US Consumer Price Index (CPI)Citation22. It is assumed that 80% of healthcare costs reported herein would be borne by the third-party healthcare payer.
Drug acquisition and administration costs
Vial prices are based on October 2019 Wholesale Acquisition Costs (WACs) from the Analysource databaseCitation23 and drug dosing and administration is modeled as reported in earlier analyses ()Citation2,Citation3.
Cumulative costs of subsequent therapies (Supplementary Material Tables S7 and S8) taken following discontinuation of initial trial treatments () are modeled based on utilization of different treatment regimens observed within the KN189, KN407, and KN024 trials. Data from the pembrolizumab arm in KN024 were preferentially selected for estimating subsequent therapy utilization due to a longer duration of follow-up as compared to KN042. The modeled number of days of use of additional therapies following discontinuation of initial treatment (either pembrolizumab + chemotherapy, pembrolizumab monotherapy or chemotherapy) was estimated by category of post-discontinuation regimen (e.g. chemotherapies). Relative to chemotherapies, for post-discontinuation anti-PD1/PD-L1 therapy use, treatment durations tend to be much longer and usage is associated with higher costs. Given right censoring observed within trial data for the durations of these treatments in 2 L and 3 L, limiting the observation window and under-estimating mean durations for these regimens, it was elected to instead use estimates of mean duration for these therapies based on 2011–2019 data from the US Flatiron Health databaseCitation24, while durations of chemotherapy regimens were estimated from the trials (Supplementary Material Tables S9 and S10).
Disease management costs
As described in earlier workCitation2,Citation3, average weekly costs of disease management (excluding drug, drug administration, and AE related costs) in progression-free, progressed, and terminal care (last 30 days of life) states are estimated from an analysis of 2013 SEER Medicare data for Stage 4 Non-Squamous (KN189 analysis) and Squamous (KN407 analysis) NSCLC patients ().
Adverse event management costs
Costs for modelled Grade 3+ AEs were estimated as described in earlier workCitation2,Citation3, incorporating the proportion of patients hospitalized for each AE within the trials, a cost per hospitalization based on US Medicare Diagnosis Related Group (DRG) paymentsCitation25 and the cost of an out-patient physician visitCitation26 for non-hospitalized patients. For simplicity, the total average cost per patient for managing adverse events with each comparator is computed () and incorporated within the model as a one-time cost within the first treatment cycle.
ICER Threshold
While there is no single accepted threshold for cost-effectiveness in the US, the World Health Organization has referenced a threshold of ∼3-times estimated per capita gross domestic product (GDP) with respect to disability-adjusted life years, which for the US as of the data cut-off year in each trial (2019) would correspond to approximately $195,000/QALYCitation27,Citation28. This metric was used as a threshold for cost-effectiveness within the present analysis, consistent with earlier workCitation2,Citation3.
Variability and uncertainty
Subgroup analyses
The primary analysis reflects the full trial population regardless of PD-L1 status. Cost-effectiveness is also reported for subgroups of patients with PD-L1 expression of ≥50%, 1–49%, and <1%.
Parameter sensitivity and uncertainty
For the primary analysis in the full trial population, one-way deterministic sensitivity analyses (DSA) and ranges are reported (Supplementary Material Tables S11 and S12), along with a probabilistic sensitivity analysis (PSA), based on a second-order Monte Carlo simulation with 1,000 iterations. Distributions for parameters within the PSA are described in Supplementary Material Tables S13 and S14.
Results
Primary analysis – KN189 and KN407 trial comparators with treatment in full trial population
In comparison to use of chemotherapy in the full trial population (), pembrolizumab + chemotherapy is projected to increase discounted life expectancy by 0.98 years in non-squamous metastatic patients (2.99 vs 2.02 years). Without discounting, the gain in life expectancy is 1.12 years (3.35 vs 2.23 years), representing a 50% gain in life years. In squamous metastatic patients, discounted life expectancy is increased by 0.58 years (2.80 vs 2.23 years), with an undiscounted gain in life expectancy of 0.67 years (3.17 vs 2.50 years), corresponding to a 27% increase in life expectancy. The discounted QALY gains with pembrolizumab + chemotherapy are 0.81 and 0.49 QALYs in non-squamous and squamous patients, respectively.
Table 2. Cost-effectiveness of pembrolizumab + chemotherapy vs chemotherapy in non-squamous (KN189) and squamous (KN407) patients.
Incremental discounted costs associated with use of pembrolizumab + chemotherapy vs chemotherapy in non-squamous and squamous patients respectively are $128,575 and $86,622. The additional expenditures mainly reflect increased cost for drug acquisition, followed by those for disease management, each of which is partly driven by increases in life expectancy, enabling a longer duration of treatment. Incremental costs per QALY gained with pembrolizumab +chemotherapy vs chemotherapy are $158,030 in non-squamous patients and $178,387 in squamous patients and corresponding costs per life year gained are $131,592 and $150,110.
In non-squamous patients, the average durations for pembrolizumab and pemetrexed treatment in the pembrolizumab + chemotherapy arm are both 0.8 years, corresponding to 14.0 and 13.2 cycles, respectively. In the chemotherapy arm, the average duration of pemetrexed use is 0.5 years (8.7 cycles). In squamous patients, the average during of pembrolizumab is 0.9 years (16.2 cycles).
KN189 and KN407 trial comparators with treatment in PD-L1 subgroups
Trial PD-L1 subgroup analyses for cost-effectiveness are also reported in . For non-squamous patients with PD-L1 expression of ≥50%, 1–49%, and <1%, ICERs are $171,332/QALY, $189,606/QALY, and $125,480/QALY, respectively. Corresponding ICERs in squamous patients are $119,662/QALY, $113,999/QALY, and $313,167/QALY in PD-L1 ≥ 50%, 1–49%, and <1% sub-groups, respectively.
Indirect treatment comparison to pembrolizumab monotherapy
For the indirect treatment comparison to pembrolizumab monotherapy () in both the PD-L1 ≥ 50% and PD-L1 1–49% sub-groups, an initially elevated hazard ratio for pembrolizumab monotherapy vs pembrolizumab + chemotherapy (lower mortality with pembrolizumab + chemotherapy) was observed, followed by a reduction or reversal in the direction of the hazard ratio over time. As a result, in the PD-L1 ≥ 50% subgroup, pembrolizumab + chemotherapy is estimated to result in an incremental gain of 0.75 discounted life years (0.88 undiscounted life years) in non-squamous patients, while a slight decrement in discounted life years of −0.08 (–0.17 undiscounted life years) is observed in squamous patients (). Drug acquisition costs are much lower for pembrolizumab monotherapy as compared to pembrolizumab + chemotherapy in non-squamous patients ($81,943 vs $216,972), and moderately lower in squamous patients ($82,519 vs $119,594), which largely drives differences in total costs of care between the treatments These findings result in an ICER for pembrolizumab + chemotherapy vs pembrolizumab monotherapy of $271,364/QALY in non-squamous patients with PD-L1 ≥ 50%, while in squamous patients, pembrolizumab monotherapy appears cost saving (less costly and nominally very slightly more effective).
Table 3. Cost-effectiveness of pembrolizumab + chemotherapy vs. pembrolizumab monotherapy in non-squamous (KN189) and squamous (KN407) patients.
In the PD-L1 1–49% sub-group, pembrolizumab + chemotherapy is estimated to result in an incremental gain of 0.13 discounted life years (0.14 undiscounted life years) in non-squamous patients, while a much larger gain of 1.36 discounted life years (1.58 undiscounted life years) is observed in squamous patients. This results in a very high ICER for pembrolizumab + chemotherapy vs pembrolizumab monotherapy in non-squamous patients and a much lower ICER in squamous patients.
The differences in projected survival and ICERs vs pembrolizumab monotherapy between non-squamous and squamous patients within the PD-L1 subgroups are difficult to interpret. Naturally occurring random variability may be contributing to some of the differences observed. It should be noted that for the indirect treatment comparisons, pembrolizumab monotherapy trial sample sizes for squamous patients were smaller than for non-squamous patients. This was particularly true for the PD-L1 ≥ 50% sub-group (∼90 patients analyzed per trial arm for squamous patients vs ∼250 patients per trial arm for non-squamous patients) due to a relatively lower enrollment of squamous patients in the KN024 trial (PD-L1 ≥ 50%) as compared to KN042 (PD-L1 ≥ 1%). Analysis sample sizes were ∼150 and ∼100 patients per trial arm, respectively, for non-squamous and squamous patients in the PD-L1 1–49% sub-group. Thus, the non-squamous results may be somewhat less impacted by random variation relative to the squamous results.
Parameter uncertainty analyses – KN189 and KN407 trial comparators with treatment in full trial population
Deterministic sensitivity analyses (DSA)
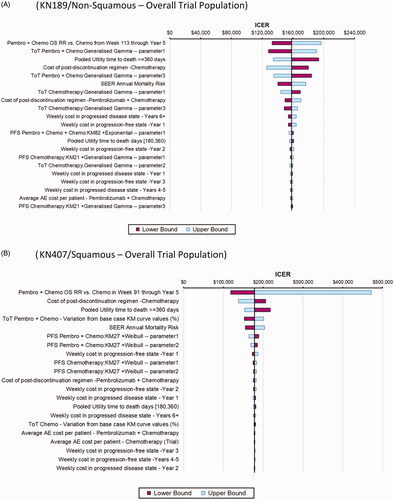
To provide a representative illustration of individual parameters associated with the greatest variation in reported ICERs, tornado diagrams are shown in for the primary analysis within the overall trial population. The parameters that have the most impact on the ICER in both the KN189 and KN407 analyses include the extrapolated OS relative risk of pembrolizumab + chemotherapy vs chemotherapy beyond the KM cut-points (set to 1.0 in the base case), time on treatment for pembrolizumab + chemotherapy, the health utility value for patients ≥360 days from death, the total cost of post-discontinuation treatment use in the chemotherapy arm, and SEER annual mortality risks. There was greater variability in the ICER, with variation in the extrapolated OS relative risk of pembrolizumab + chemotherapy vs chemotherapy beyond the KM cut-point in KN407 relative to KN189, due to a wider confidence interval around the estimated relative risk in the former trial. However, the upper bound ICER values for this parameter should be viewed with caution in both analyses as the relative risk upper confidence intervals ranged well above 1.0 (e.g. 1.30 in KN407), which may not be clinically plausible. Otherwise, ICERs ranged between $125,000/QALY and $220,000/QALY with variation in the remaining parameters.
Figure 4. Tornado diagrams for the ICER (cost/QALY) of pembrolizumab + chemotherapy vs chemotherapy in the overall trial population, by trial analysis. (A) KN189/Non-Squamous – Overall Trial Population. (B) KN407/Squamous – Overall Trial Population.
Probabilistic sensitivity analyses (PSA)
Cost-effectiveness acceptability curves from the PSA (Supplemental Material – Figures S9 and S10) project probabilities that the ICER for pembrolizumab + chemotherapy vs chemotherapy in the overall trial population falls below a $195,000/QALY ICER threshold of 76% (KN189) and 59% (KN407), respectively.
Discussion
Overall summary and interpretation of results
The present analysis provides updated cost-effectiveness analysis results based on longer term trial follow-up for pembrolizumab + chemotherapy as compared to chemotherapy and pembrolizumab monotherapy in non-squamous and squamous metastatic NSCLC patients. As compared to trial chemotherapy regimens in KN189 and KN407, ICERs for pembrolizumab + chemotherapy are below a US 3-times GDP per capita threshold of $195,000/QALY for both non-squamous and squamous histology patients within the overall population in each trial as well as virtually all PD-L1 sub-groups (≥50%,1–49%, <1%) evaluated.
The lone exception was observed in squamous patients with PD-L1 < 1%, where an ICER value of ∼$300,000/QALY was observed, which differed markedly from the ICER observed for non-squamous patients with PD-L1 < 1% of ∼$125,000/QALY. It is unclear if the discrepancy reflects a true difference or represents a chance finding resulting from random variation given smaller sample sizes within PD-L1 sub-groups (e.g. approximately one-third of patients in each trial had tumors with PD-L1 expression <1%). Patient life expectancy was extended with use of pembrolizumab + chemotherapy vs chemotherapy in all populations and sub-groups.
For the indirect treatment comparison to pembrolizumab monotherapy in non-squamous and squamous patients with PD-L1 ≥ 50% and 1–49%, the estimated ICER for pembrolizumab + chemotherapy appeared higher than the willingness to pay threshold in three of four patient sub-groups evaluated. The exception was for squamous patients with PD-L1 1–49% where an ICER of $94,520 was observed, which differs from the much higher ICER found vs pembrolizumab monotherapy for non-squamous patients with PD-L1 1–49%. As previously described, chance differences may also be present within these analyses and caution should be exercised in exact interpretations of values. However, incremental gains in life years and QALYs vs pembrolizumab monotherapy were generally smaller than seen vs chemotherapy, and ICERs generally higher. We have previously also reported the cost-effectiveness of pembrolizumab monotherapy vs chemotherapy in PD-L1 ≥ 50% and 1–49% patient groups and found ICERs of around $100,000/QALY and $160,000/QALY, respectivelyCitation29,Citation30. Overall, the findings suggest that, based on the analyses with longer-term trial data reported herein and previous literature, one of the two major options for pembrolizumab use (either pembrolizumab + chemotherapy or pembrolizumab monotherapy) represents a cost-effective treatment option in virtually all patient populations and sub-groups evaluated (except squamous PD-L1 < 1% for pembrolizumab + chemotherapy, where comparisons may have been limited by smaller sample size).
Comparison of pembrolizumab + chemotherapy vs chemotherapy in the context of earlier work
A few prior US cost-effectiveness analyses have been published based on interim analysis data from KN189Citation2,Citation31–33 and KN407Citation3 and, to our knowledge, this is the first cost-effectiveness analysis evaluating longer term data from the final protocol-specified trial analyses. A thorough evaluation of prior publications is beyond the scope of this paper. In our own prior work we reported ICERs around $100,000/QALY for pembrolizumab + chemotherapy vs chemotherapy based on interim analysis trial data from KN189 and KN407Citation2,Citation3. Although in the current analysis higher ICERs are reported (e.g. $160,000–$180,000/QALY within the overall trial populations) with greater understanding of longer-term follow-up data, the conclusions that pembrolizumab + chemotherapy is a cost-effective treatment option relative to chemotherapy generally remains unchanged.
At least modest changes are observed in a number of parameters with more mature data, however, the most influential change is in predicted longer-term survival. At the time of the earlier analyses, there was a consistent differential in mortality risks between the pembrolizumab + chemotherapy and chemotherapy arms, as of the latest available follow-up interval for robust KM data. For instance, in KN189, the relative risk for mortality for pembrolizumab + chemotherapy in months 1–6 was 0.53 (0.39–0.74) and for months 7–12 was 0.58 (0.40–0.83)Citation2. Based on these findings, and a lack of longer term data, the relative risk of 0.58 was applied to chemotherapy arm mortality risks for years 2–5 within the KN189 model. This led to a much larger estimated gain in incremental life years and QALYs with pembrolizumab + chemotherapy vs chemotherapy relative to in the present model where mortality risks in the overall population were observed to be similar between the trial arms between weeks 61 and 112 and, after modeling KM data directly to week 112, no differential in mortality risk between arms is modeled thereafter. Similar changes are also observed with respect to KN407 modelingCitation3.
Comparison of pembrolizumab + chemotherapy vs pembrolizumab monotherapy in the context of earlier work
For indirect treatment comparisons to pembrolizumab monotherapy, we previously reported ICERs for pembrolizumab + chemotherapy within PD-L1 ≥ 50% and 1–49% non-squamous and squamous sub-groups well below a US 3-times GDP per capita thresholdCitation2,Citation3,Citation30. With updated trial data in the present analysis, although pembrolizumab + chemotherapy results in higher OS and PFS relative to pembrolizumab monotherapy through at least the first 2 years of follow-up, ICERs for pembrolizumab + chemotherapy generally are above this threshold. In both the PD-L1 ≥ 50% and PD-L1 1–49% sub-groups, there was observed to be an initially elevated hazard ratio for pembrolizumab monotherapy vs pembrolizumab + chemotherapy (lower mortality with pembrolizumab + chemotherapy), followed by a narrowing or cessation of the differential over time.
Analysis strengths and limitations
The primary analysis reflects a direct comparison of pembrolizumab + chemotherapy to chemotherapy alone, via data accessed from randomized controlled trials, which represents the highest quality of evidence for a treatment comparison. The application of results from analyses based on individual patient data-derived indirect treatment comparisons of pembrolizumab + chemotherapy to pembrolizumab monotherapy, utilizing covariate-adjusted estimates from four trials constitutes an additional strength.
Analysis limitations include that first, even with longer trial follow-up, there remains inherent uncertainty in the further extrapolation of PFS and OS. For instance, though reflective of more mature data, there is uncertainty in the observed overall trial population mortality relative risks of 0.92 (95% CI = 0.68–1.32) during weeks 61–112 in KN189, and 0.96 (95% CI = 0.71–1.30) during weeks 53–90 in KN407. It is possible that due to random chance a differential was not observed when one existed, with a potential carry-over to the extrapolation period for which these data were utilized to set an RR of 1.0. Second, it is possible that patient time on treatment in clinical practice could differ from that observed within the trial. Third, for KN189 comparisons, branded pemetrexed, which accounts for 40% of drug acquisition costs within the pembrolizumab + chemotherapy regimen, is expected to have US patent expiry in 2022, and the cost-effectiveness of pembrolizumab + chemotherapy could improve thereafter due to generic entry.
Fourth, within the indirect treatment comparison to pembrolizumab monotherapy, while the IPTW approach can address imbalances in observable patient characteristics between the trials, it cannot address imbalances due to non-observed variables or other misspecifications of propensity score modeling. Furthermore, while health and economic outcomes for patients receiving pembrolizumab + chemotherapy were retained as observed in KN189 and KN407, outcomes for patients receiving pembrolizumab monotherapy as reported in this analysis were adjusted, and no longer correspond to those directly observed within the KN024 and KN042 trials. For example, patients included within the indirect treatment comparison with PD-L1 ≥ 50% in the chemotherapy arm of the KN189/021G trials experienced substantively worse outcomes in terms of progression-free survival, and modestly worse overall survival, relative to chemotherapy arm non-squamous patients receiving the same treatment regimen in KN024/KN042. Thus, for comparability purposes, PFS and OS curves for pembrolizumab monotherapy are adjusted downward within the ITC during these time horizons (reduced OS/PFS relative to in KN024/042), which particularly impacted reported results for disease progression relative to within the original KN024/042 trials. The adjustment also impacted drug acquisition costs for pembrolizumab monotherapy vs pembrolizumab + chemotherapy as, in addition to reduced total costs due to the absence of a chemotherapy regimen and shorter survival within this sub-group, the lowering of PFS for monotherapy relative to original values in KN024/042 also lowers the modeled ToT curve, which is adjusted for the ratio of ToT:PFS observed within the monotherapy trials.
Finally, the present analysis has used a US 3-times GDP per capita threshold ($195,000/QALY)Citation28 for defining cost-effectiveness of interventions to extend survival in NSCLC patients with far advanced disease. As there is no single accepted ICER threshold within the USCitation34, and varying budget constraints are likely to exist, individual decision-makers may alternatively consider locally determined thresholds in evaluating results.
Conclusions
With additional follow-up time available from the KN189 and KN407 trial final protocol-specified analyses, pembrolizumab + chemotherapy continues to generate superior OS and PFS as compared to chemotherapy alone, in metastatic non-squamous and squamous NSCLC. For these patients whose cancers have progressed to a very late stage, in the overall trial populations, life expectancy is estimated to increase by 50% to 3.4 years in KN189, and by 27% to 3.2 years in KN407.
From a US healthcare payer perspective, modeling projects these health benefits to come at incremental costs per QALY gained of $158,030 and $178,387, versus use of trial chemotherapy comparators in the overall trial populations of KN189 and KN407, respectively. These ICERs, along with those observed within PD-L1 subgroups of ≥50%, 1–49%, and <1% generally are below a 3-times US GDP per capita threshold for cost-effectiveness of $195,000/QALY. The lone exception is for squamous patients with PD-L1 < 1% where variability may have occurred due to smaller sample size.
With indirect treatment comparison to pembrolizumab monotherapy in patients with PD-L1 ≥ 50% and 1–49%, ICERs generally exceeded this threshold (with the exception of squamous patients with PD-L1 1–49%). Trade-offs in selection of therapy may need to be made based on clinical and healthcare resource considerations depending on the preferences of the decision-maker.
Taken together, and in the context of prior literature, these findings suggest that one of the two major options for pembrolizumab use (either pembrolizumab + chemotherapy or pembrolizumab monotherapy), represents a cost-effective treatment option in virtually all non-squamous and squamous metastatic NSCLC patient populations and sub-groups evaluated.
Transparency
Declaration of funding
Supported by Merck Sharp & Dohme Corp., a subsidiary of Merck & Co., Inc., Kenilworth, NJ, USA
Declaration of financial/other relationships
Ralph Insinga, Nan Qiao, Kristel Vandormael, and Ying Zhang are employees of Merck Sharp & Dohme Corp., a subsidiary of Merck & Co., Inc., Kenilworth, NJ, USA, Inc. Josephine Feliciano has previously received consulting fees from Merck Sharp & Dohme Corp., a subsidiary of Merck & Co., Inc., Kenilworth, NJ, USA, Astra Zeneca, Pfizer, and Takeda.
A peer reviewer on this manuscript has disclosed that they have received honoraria (2018, 2019) and travel support (2019) form MERCK SHARP & DOHME “MSD” (Hellas) SA. The peer reviewers on this manuscript have no other relevant financial relationships or otherwise to disclose.
Author contributions
Ralph Insinga developed the cost-effectiveness model and an initial draft manuscript. Ying Zhang and Kristel Vandormael contributed data for the analysis. All authors provided critical input to the draft manuscript and revising for intellectual content, final approval of the version to be published, and agree to be accountable for all aspects of the work.
Supplemental Material
Download MS Word (352 KB)Acknowledgements
None reported.
References
- Highlights of prescribing information. KEYTRUDA (pembrolizumab) injection, for intravenous use. Merck Sharp & Dohme Corp. [cited 2020 Aug 17]. Available from: https://www.merck.com/product/usa/pi_circulars/k/keytruda/keytruda_pi.pdf.
- Insinga RP, Vanness DJ, Feliciano JL, et al. Cost-effectiveness of pembrolizumab in combination with chemotherapy in the 1st line treatment of non-squamous NSCLC in the US. JMedEcon. 2018;21(12):1191–1205.
- Insinga RP, Vanness DJ, Feliciano JL, et al. Cost-effectiveness of pembrolizumab in combination with chemotherapy versus chemotherapy and pembrolizumab monotherapy in the first-line treatment of squamous non-small-cell lung cancer in the US. Curr Med Res Opin. 2019;35(7):1241–1256.
- Rodriguez-Abreu D, Powell SF, Hochmair MJ, et al. Protocol-specified final analysis of KEYNOTE-189: pemetrexed-platinum chemotherapy with or without pembrolizumab in patients with previously untreated metastatic nonsquamous NSCLC. Paper presented at: American Society of Clinical Oncology (ASCO) Annual Meeting, 2020.
- Paz-Ares L, Vicente D, Tafreshi A, et al. A randomized, placebo-controlled trial of pembrolizumab plus chemotherapy in patients with metastatic squamous NSCLC: protocol-specified final analysis of KEYNOTE-407. J Thorac Oncol. 2020;15(10):1657–1669.
- Reck M, Rodriguez-Abreu D, Robinson AG, et al. Updated analysis of KEYNOTE-024: Pembrolizumab versus platinum-based chemotherapy for advanced non-small-cell lung cancer with PD-L1 tumor proportion score of 50% or greater. J Clin Oncol. 2019;37(7):537–546.
- Mok TSK, Wu YL, Kudaba I, et al. Final analysis of the phase 3 KEYNOTE-042 study: Pembrolizumab vs Platinum-based chemotherapy as first-line therapy for patients with PD-L1-positive locally advanced or metastatic NSCLC. Paper presented at: European Lung Cancer Congress, 2019.
- Mok TSK, Wu YL, Kudaba I, et al. Pembrolizumab versus chemotherapy for previously untreated, PD-L1-expressing, locally advanced or metastatic non-small-cell lung cancer (KEYNOTE-042): a randomised, open-label, controlled, phase 3 trial. Lancet. 2019;393(10183):1819–1830.
- Borghaei H, Langer CJ, Gadgeel SM, et al. 24-month overall survival from KEYNOTE-021 cohort G: pemetrexed and carboplatin with or without pembrolizumab as first-line therapy for advanced nonsquamous non-small-cell lung cancer. JThoracOncol. 2018;14(1):124–129.
- Neumann PJ, Sanders GD, Russell LB, et al., editors. Cost-effectiveness in health and medicine. 2nd ed. New York: Oxford University Press. 2016.
- Surveillance Epidemiology and End Results Program. National Cancer Institute; [cited 2017 Aug 14]. Available from: https://seer.cancer.gov/faststats/selections.php?#Output.
- Insinga RP. Cost-effectiveness Model of Keytruda + Chemotherapy for 1st Line Treatment of Small Cell Lung Cancer (Model Development Plan Approved by CORE-DRC on November 21, 2018). 2018.
- Paz Ares L, Vicente D, Tafreshi A, et al. Pembrolizumab (pembro) + chemotherapy (chemo) in metastatic squamous NSCLC: Final analysis and progression after the next line of therapy (PFS2) in KEYNOTE-407. Annals of Oncology. 2019;30(Supplement_5):v918–v919.
- Bucher HC, Guyatt GH, Griffith LE, et al. The results of direct and indirect treatment comparisons in meta-analysis of randomized controlled trials. J Clin Epidemiol. 1997;50(6):683–691.
- Austin PC, An introduction to propensity score methods for reducing the effects of confounding in observational studies. Multivariate Behav Res. 2011;46(3):399–424.
- Latimer NR , Survival analysis for economic evaluations alongside clinical trials-extrapolation with patient-level data: inconsistencies, limitations, and a practical guide. Med Decis Making. 2013;33(6):743–754.
- Latimer N. NICE DSU Technical Support Document 14: survival analysis for economic evaluations alongside clinical trials – extrapolation with patient-level data. Sheffield: Report by the Decision Support Unit 2011; [cited 2020 Aug 18]. Available from: http://docplayer.net/11340696-Nice-dsu-technical-support-document-14-survival-analysis-for-economic-evaluations-alongside-clinical-trials-extrapolation-with-patient-level-data.html.
- Grambsch PM, Therneau TM, Proportional Hazards tests and diagnostics based on weighted residuals. Biometrika. 1994;81(3):515–526.
- Reck M, Rodriguez-Abreu D, Robinson AG. KEYNOTE-024 3-year survival update: Pembrolizumab versus platinum-based chemotherapy for advanced NSCLC. Paper presented at: 2019 World Conference on Lung Cancer 2020; Barcelona, Spain.
- National Cancer Institute. Common Terminology Criteria for Adverse Events (CTCAE) Version 4.0. Published: May 28, 2009. (v4.03: June 14, 2010).
- Shaw JW, Johnson JA, Coons SJ, US valuation of the EQ-5D health states: development and testing of the D1 valuation model. Med Care. 2005;43(3):203–220.
- U.S. Bureau of Labor Statistics. Consumer price index: medical care – all urban consumers, 2019; [cited 2020 Aug 18]. Available from: http://www.bls.gov/cpi/.
- Analysource. 2019; [cited 2020 Aug 18]. Available from: www.analysource.com.
- Flatiron Health. 2019; [cited 2020 Aug 18]. Available from: http://www.flatiron.com/life-sciences.
- FY 2020 IPPS Final Rule. Centers for Medicare and Medicaid Services. 2019; [cited 2020 Aug 18]. Available from: https://www.cms.gov/Medicare/Medicare-Fee-for-Service-Payment/AcuteInpatientPPS/FY2020-IPPS-Final-Rule-Home-Page.html.
- Center for Medicare and Medicaid Services. Cost procedural terminology. Fourth Edition. Costs for Hospital Outpatient Services, by HCPCS code for CY. 2019.
- Bertram MY, Lauer JA, De Joncheere K, et al. Cost-effectiveness thresholds: pros and cons. Bull World Health Organ. 2016;94(12):925–930.
- GDP per capita (current US$). World Bank national accounts data, and OECD National Accounts data files. 2019; [cited 2020 Aug 18]. Available from: https://data.worldbank.org/indicator/NY.GDP.PCAP.CD?order=wbapi_data_valu.
- Huang M, Lou Y, Pellissier J, et al. Cost effectiveness of pembrolizumab vs. standard-of-care chemotherapy as first-line treatment for metastatic NSCLC that expresses high levels of PD-L1 in the United States. Pharmacoeconomics. 2017;35(8):831–844.
- Huang M, Lopes GL, Insinga RP, et al. Cost-effectiveness of pembrolizumab versus chemotherapy as first-line treatment in PD-L1-positive advanced non-small-cell lung cancer in the USA. Immunotherapy. 2019;11(17):1463–1478.
- Criss SD, Mooradian MJ, Watson TR, et al. Cost-effectiveness of Atezolizumab combination therapy for first-line treatment of metastatic nonsquamous non-small cell lung cancer in the United States. JAMA Netw Open. 2019;2(9):e1911952.
- Wan N, Zhang TT, Hua SH, et al. Cost-effectiveness analysis of pembrolizumab plus chemotherapy with PD-L1 test for the first-line treatment of NSCLC. Cancer Med. 2020;9(5):1683–1693.
- Zeng X, Wan X, Peng L, et al. Cost-effectiveness analysis of pembrolizumab plus chemotherapy for previously untreated metastatic non-small cell lung cancer in the USA. BMJ Open. 2019;9(12):e031019.
- Dubois RW, Cost-effectiveness thresholds in the USA: are they coming? Are they already here? J Comp Eff Res. 2016;5(1):9–11.