
Abstract
Aims
This study aimed to estimate the association of patiromer exposure vs. no potassium (K+) binder (NoKb) exposure with healthcare utilization and expenditures among a cohort of Medicare Advantage patients with hyperkalemia (HK).
Methods
Using Optum’s Clinformatics Data Mart (study period 2016–2019), the authors assessed propensity score-matched patients (1:1) with a serum K+ concentration ≥5.0 mmol/L and an HK diagnosis that were exposed to patiromer or NoKb on baseline characteristics. The following outcomes were compared: (1) inpatient/emergency department (ED) encounters, (2) inpatient costs greater than or equal to mean Medicare Advantage inpatient cost (i.e. $14,900), and (3) the relative healthcare spending rate. Logistic regression and zero-inflated negative binomial regression were used to analyze the outcomes.
Results
The study cohort included 1,539 patiromer and NoKb matched pairs. Baseline characteristics were (patiromer/NoKb): age 74/75 years; female 42/40%; serum K+ 5.6/5.6 mmol/L; eGFR rate 36/36 mL/min/1.73 m2; low-income subsidy 42/41%, chronic kidney disease 96/96%; end-stage renal disease 12/12%; and congestive heart failure 37/36%. A total of 253 matched pairs (506 patients) remained uncensored and were analyzed at 6 months. Inpatient/ED encounters were observed for 25% (patiromer) and 37% (NoKb) (odds ratio [OR] 0.58, 95% confidence interval [CI]: 0.38–0.89). The relative odds of having inpatient costs ≥$14,900 were ∼50% less for patients exposed to patiromer vs. NoKb (OR [95% CI]: 0.47 [0.25–0.89]). The relative total healthcare spending rate (including inpatient, outpatient, ED, and pharmacy costs) was 19% less for patients exposed to patiromer vs. NoKb (spending rate ratio [95% CI]: 0.81 [0.67–0.98]).
Conclusion and limitations
Among Medicare Advantage patients with HK, patiromer exposure (vs. NoKb) was associated with statistically significant reductions in the proportion with inpatient/ED encounters, inpatient costs ≥$14,900, and lower total healthcare spending. Further research, with larger sample size, is warranted to fully validate these findings.
Introduction
Hyperkalemia (HK) is a potentially life-threatening electrolyte abnormality that may result in arrhythmias and sudden deathCitation1,Citation2. Chronic kidney disease (CKD)Citation1,Citation3–8, diabetes, congestive heart failure (CHF), and the use of renin-angiotensin-aldosterone system (RAAS) inhibitors are risk factors for HKCitation1,Citation9,Citation10.
In the United States (US), the prevalence of HK was reported to be 1–2% overall, and potentially as high as 15% among Medicare patients with CKD and/or CHFCitation11,Citation12. HK has been reported to be associated with increased healthcare costs and healthcare resource utilization (HRU; e.g. inpatient admission and emergency department [ED] encounter)Citation13–15. In studies using administrative claims data in the US, researchers found that patients with HK incurred 58% higher total healthcare expenditures and were 40% more likely to be readmitted, compared to patients without HKCitation12,Citation15. They also reported that HRU and healthcare expenditures increased according to the CKD stage and that the primary cost drivers for patients with CKD and HK were from inpatient medical services.
Patiromer (Vifor Pharma, Inc., Redwood City, CA, USA) was approved for the treatment of HK by the US Food and Drug Administration in 2015 and by the European Medicines Agency in 2017Citation6,Citation7. Patiromer is a sodium-free, non-absorbed polymer that exchanges calcium for potassium (K+), thus removing K+ from the body and lowering serum K+. In published randomized trials, the efficacy of patiromer was demonstrated in treating HK in patients with CKD, diabetes, hypertension, and heart failure, and in users of RAAS inhibitors. In one of the larger trials, patiromer resulted in a statistically significant reduction in serum K+ after 4 weeks that persisted with continued treatment through 52 weeksCitation16–18.
While there are several published observational studies comparing HRU and healthcare expenditures for patients with and without HKCitation2,Citation12–15, research regarding the relative effectiveness of different treatment modalities among patients with HK is emergingCitation14,Citation19–25. Among Medicare Advantage patients with HK in real-world clinical practice, this study aimed to evaluate the outcomes for patients exposed to patiromer compared to patients not exposed to a K+ binder. The study aims included the following: Aim 1, to estimate the relative odds of having an inpatient admission or ED encounter; Aim 2, to estimate the relative odds of having inpatient expenditures greater than the mean Medicare Advantage inpatient cost (i.e. $14,900); and Aim 3, to estimate the relative healthcare expenditure rate for total healthcare costs and costs stratified by service type (i.e. inpatient, outpatient, ED, and pharmacy).
Methods
Study design and data source
This retrospective, matched-cohort study utilized real-world data from Optum’s Clinformatics Data Mart (CDM). These data include healthcare insurance claims for participants enrolled in commercial and Medicare Advantage plans in the US Optum’s CDM contains de-identified healthcare data on participant enrollment, demographics, inpatient and outpatient medical services, diagnostic and laboratory services, laboratory results for tests conducted at certain laboratories, and inpatient and outpatient pharmacy claims.
Study population
During the 4-year study period (1 January 2016–31 December 2019), the study population included patients with Medicare Advantage insurance and a serum K+ concentration ≥5.0 mmol/L (Logical Observation Identifiers Names and Codes [LOINC]: 2823-3). The date of the serum K+ concentration ≥5.0 mmol/L defined the beginning of an HK episode. All patients in the study population had at least 1 HK episode; however, some patients had many HK episodes, if they had more than one laboratory test with a serum K+ concentration ≥5.0 mmol/L on unique dates.
HK episode exposure classification
HK episodes were classified as patiromer-exposed if an outpatient pharmacy claim for patiromer was identified within 91 days following the HK episode start date. For exposed HK episodes, the index date was the date of patiromer initiation. The median duration from the HK episode start date to the patiromer initiation date was 14 days (mean [standard deviation (SD)]: 22 [21] days). For patients with an exposed HK episode, the first patiromer-exposed HK episode was included and analyzed. All HK episodes after the first exposed HK episode, whether exposed or unexposed, were excluded.
HK episodes were classified as unexposed if a patiromer pharmacy claim was not identified within 91 days following the HK episode start date. For unexposed HK episodes, the index date was the HK episode start date plus a randomly assigned value between 0 and 91 days following the distribution of time to patiromer initiation for exposed HK episodes.
Study cohort development
Patients with an exposed HK episode were included in the patiromer cohort. To ensure an equal opportunity for cohort inclusion, and to mitigate selection bias, one unexposed HK episode was randomly selected from patients who had more than one unexposed HK episode. This procedure was performed systematically, regardless of whether the patient also had an exposed HK episode (i.e. was included in the patiromer cohort). Patients with an unexposed HK episode were included in the no K+ binder (NoKb) cohort.
Patients were excluded from the patiromer and NoKb cohorts if the following conditions were not present before the index date: (1) an HK diagnosis code (identified using International Classification of Diseases, Ninth/Tenth Revisions, Clinical Modification [ICD-9/10-CM] codes: 276.7/E87.5), (2) at least 6 months of continuous insurance enrollment, and (3) a serum creatinine value (LOINC: 2160-0). Serum creatinine was used to calculate the estimated glomerular filtration rate (eGFR) using the Mayo Clinical Quadratic Formula.
Baseline patient characteristics
Baseline characteristics for patients in the PAT and NoKb cohorts were ascertained within 12 months prior to or on the index date (see and Supplemental Table S1). Comorbidities were identified using ICD-9/10-CM codes. Medications were identified using the National Drug Code. Serum K+ concentration and eGFR were identified using LOINC codes. Comorbidities and medications were classified by the presence of at least one diagnosis code or one outpatient pharmacy claim. Baseline serum K+ concentration and eGFR were classified using the last value within 3 and 12 months pre-index for K+ and eGFR, respectively.
Table 1. Baseline patient characteristics for the propensity score-matched cohorts.
Matching patients in the patiromer and NoKb cohorts
Propensity score (PS) matching and coarsened exact matching (CEM) were used to match each patient in the patiromer cohort to one patient in the NoKb cohort if an acceptable match was availableCitation26–28. The rationale for using CEM on a restricted set of baseline variables, in conjunction with PS matching, was to ensure tight control of baseline variables (e.g. serum K+ concentration and inpatient/ED encounter) that may be strongly associated with patiromer exposure and independently associated with the study outcomes. Additionally, exact matching on prespecified baseline variables permitted restricted analyses on these variables while retaining the distribution of baseline characteristics in the matched pairs (e.g. analyses restricted to matched pairs with a baseline inpatient/ED encounter).
The CEM procedure created unique categories or groupings for each combination of the a priori selected baseline variables. The CEM variables included: serum K+ concentration (categorized as 5.0–<5.5; 5.5–<6.0; 6.0–<6.5; and ≥6.5), the number of HK episodes (categorized as 0, 1–2, and ≥3), inpatient/ED encounter (yes/no), and continuous RAAS inhibitor (RAASi) exposure (yes/no). The combination of all CEM variable categories represented a total of 48 mutually exclusive categories.
The predicted probability of patiromer exposure (vs. NoKb exposure) was generated from a multivariable logistic regression model conditioned on baseline covariates. The baseline variables included: patient demographics (e.g. gender and race), eGFR, comorbidities, medications, HRU (e.g. number of baseline office visits), and medical/outpatient pharmacy costs. The baseline variables included in the PS generating model are provided in Supplemental Table S1. To avoid model assumption violations, continuous baseline variables were categorized into quintiles or dichotomized, if a clinically relevant threshold existed.
Using methodology to generate a high-dimensional PS, baseline covariates and two-way interaction terms were included in the PS generating model—as permitted, given model degrees of freedomCitation29. The PS match for each patiromer cohort member was selected from the complete risk-set of NoKb cohort members with the nearest PS value within each CEM category. Nearest-neighbor matching (1:1 without replacement) with a caliper of 0.01 on the PS (under the condition of common support) was used to ensure the estimated probability of patiromer exposure (vs. NoKb exposure), for each matched pair, did not differ by more than 1.0%. Consistent with the censoring methodology (see Follow-up and censoring section, below), 1:1 matching was used. Each matched pair included one patient in the patiromer cohort and one patient in the NoKb cohort.
Follow-up and censoring
For each matched pair, follow-up began on the index date and continued until the first censoring event. Censoring events included: loss of insurance coverage (allowable ≤45-day coverage gap), death, study period end date (31 December 2019), an outpatient pharmacy claim for sodium polystyrene sulfonate (SPS) or sodium zirconium cyclosilicate, discontinuing patiromer (for patiromer cohort members), and initiating patiromer (for NoKb cohort members).
Using the “days supplied” associated with the initial and all subsequent patiromer pharmacy claims, patiromer discontinuation was classified on the last day “covered” prior to a utilization gap ≥45 days.
The earliest censoring time for either member of a matched pair was assigned as the censoring time for both members of the matched pair. For example, if the patiromer cohort member was censored on day 82 and the NoKb matched counterpart was censored on day 125, both members of the matched pair were censored on day 82. The rationale for using matched censoring was to mitigate the potential for differential censoring bias. Details of the censoring reason for both cohorts, without regard to matched censoring, are provided in Supplemental Table S2.
Exposure classification during follow-up
For patients in each matched pair, the exposure status classified on the index date (patiromer or NoKb) continued throughout follow-up until the first censoring event.
Aim 1 outcome classification: (i) inpatient admission or ED encounter; (ii) inpatient admission following an ED encounter
Using adjudicated medical service and inpatient confinement claims data, the first Aim 1 outcome was classified by an inpatient admission (defined as an admission to a hospital or skilled nursing facility) or an ED encounter. Inpatient hospital admissions and ED encounters comprised ∼97% of all Aim 1 outcomes. The outcome date was the date of the first inpatient or ED encounter. Patients who had multiple inpatient admissions or ED encounters were counted once, on the date of the first event. Patients were classified as not having the outcome if they did not have an inpatient admission or ED encounter within 6 months post-index.
The second Aim 1 outcome was classified by evidence of an inpatient admission on the same day or the day following the date of an ED encounter.
The Aim 1 outcomes were analyzed in cumulative monthly intervals through 6 months post-index (e.g. 0–1, 0–2, 0–3, … 0–6 months). Matched pairs that remained uncensored through the end of each monthly interval were analyzed. Analyses were conducted for all (uncensored) matched pairs with a sensitivity analysis restricted to matched pairs with a baseline inpatient admission or ED encounter within 6 months pre-index.
Aim 2 outcome classification: inpatient admission costs ≥$14,900
The Aim 2 outcome utilized cost data (in US dollars; $USD) from fully adjudicated, paid claims for medical services associated with inpatient admissions. Total cumulative inpatient costs were determined and compared for patients in the patiromer and NoKb cohorts. The binary outcome (yes/no) was classified relative to the mean Medicare Advantage expenditure per inpatient admission (i.e. $14,900)Citation30. The outcome was classified as present (yes) if inpatient admission costs were ≥$14,900 within 6 months post-index. The outcome was classified as absent (no) if inpatient costs were <$14,900. Patients who did not have an inpatient admission during the 6-month follow-up interval were classified as having zero inpatient costs ($0.00).
The Aim 2 outcome was analyzed at 6 months post-index (i.e. 0–6-month analysis interval). Matched pairs that remained uncensored through the end of the 6-month interval were analyzed. Analyses were conducted for all (uncensored) matched pairs with a sensitivity analysis restricted to matched pairs with a baseline inpatient admission/ED encounter within 6 months pre-index.
Aim 3 outcome classification: relative healthcare spending rate
The relative healthcare spending rate (i.e. the healthcare spending rate ratio) was derived from cumulative healthcare costs (from paid insurance claims) for patients in the patiromer cohort compared to patients in the NoKb cohort. Cumulative healthcare costs began accruing on the index date and continued through 6 months post-index.
The healthcare spending-rate ratio was estimated for total cumulative healthcare costs ($USD) and cumulative costs were stratified by inpatient costs, ED costs, outpatient service costs, and outpatient pharmacy costs. Outpatient services costs included all costs from services incurred in the outpatient setting (e.g. outpatient drug administrations, outpatient surgical procedures, diagnostic/laboratory assessments, and outpatient office visits). Inpatient costs included costs associated with inpatient confinement.
Patients who did not incur costs in a particular stratum of interest (e.g. inpatient admissions) were included in the relative healthcare spending rate analyses for that stratum; they were classified as having zero ($0.00) costs.
The Aim 3 outcomes were analyzed at 6 months post-index (i.e. 0–6-month analysis interval). Matched pairs that remained uncensored through the end of the 6-month interval were analyzed. Analyses were conducted for all (uncensored) matched pairs with a sensitivity analysis restricted to matched pairs with a baseline inpatient admission/ED encounter within 6 months pre-index.
Statistical analysis
Baseline characteristics were summarized as means with standard deviations (SD) for continuous variables and the frequency and percentage for categorical variables.
Aim 1 analyses
For each cumulative monthly interval through 6 months post-index (e.g. 0–1, 0–2, 0–3, … 0–6 months), the frequency and percentage of PAT and NoKb cohort members with the outcome were described and compared.
For a given monthly interval, the percentage of patients with the outcome was calculated as the quotient of the number of uncensored patients with the outcome (numerator), and the number of uncensored patients (denominator). Logistic regression was used to estimate the association (i.e. odds ratio [OR] and 95% confidence interval [CI]) of having: (i) an inpatient admission/ED encounter, or (ii) an inpatient admission following an ED encounter for patients in the PAT cohort compared to patients in the NoKb cohort (reference category).
Aim 2 analyses
The Aim 2 analyses used the same methodology presented for Aim 1, except for the analysis interval. Aim 2 analyses were conducted using only the 0–6-month analysis interval post-index. Logistic regression was used to estimate the association of having inpatient admission costs ≥$14,900 for patients in the patiromer cohort vs. the NoKb cohort (reference category).
Aim 3 analyses
Given the highly skewed (to the right) nature of healthcare cost data, often accompanied by overdispersion, Aim 3 outcomes were analyzed using zero-inflated negative binomial (ZINB) regression. ZINB regression is appropriate for overdispersed count outcomes with an excess of zero-values (e.g. $0.00 inpatient admission costs). The untransformed overdispersion coefficient, alpha, was evaluated to confirm that ZINB was a more appropriate model than zero-inflated Poisson regression.
The results from ZINB regression are presented as the relative healthcare spending rate or spending rate ratio (SRR). This is a derivative of the incidence rate ratio nomenclature, commonly used with ZINB, which was adapted to facilitate interpretation. The healthcare spending rate (in $USD) for patients in the NoKb cohort is also presented as a descriptive reference point for the relative effect estimate.
Statistical analyses were conducted using STATA version 16.1 (StataCorp, LLC, College Station, TX, USA).
Results
Characteristics of the study cohorts
shows details of patients included/excluded by each criterion. A total of 1,657 and 119,110 patients were included in the PAT and NoKb (unmatched) cohorts, respectively. From these patients, 3,078 patients were matched on baseline characteristics (1,539 matched pairs). Baseline characteristics for the unmatched and matched cohorts are provided in Supplemental Table S1.
Figure 1. Consort diagram. K+, potassium.
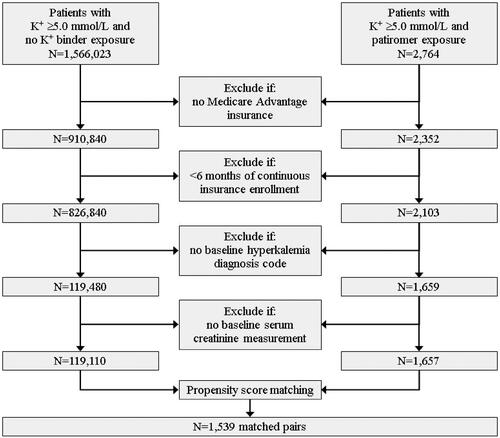
Details of study attrition and the reason for censoring, during the 6-month follow-up period, are provided in Supplemental Table S2. The primary censoring reason for patients in the patiromer and NoKb cohorts was discontinuing patiromer and the end of follow-up (31 December 2019), respectively. The mean follow-up time, using matched censoring, was 100 days (SD: 118). At 3 and 6 months post-index, 587 and 253 matched pairs, respectively, remained uncensored and were analyzed. This included 181 and 72 matched pairs that had a baseline inpatient admission or ED encounter (used for sensitivity analyses).
Before matching, the mean standardized difference (Std Diff) for 66 baseline variables was 0.16 for patients in the patiromer cohort compared to patients in the NoKb cohort. After matching, the standardized difference was 0.02. These summary results depict baseline characteristic imbalance before matching and overall excellent balance after matching. One baseline variable (mineralocorticoid receptor antagonist; Std Diff = 0.168) was marginally unbalanced (i.e. Std Diff >0.1) between patients in the patiromer and NoKb matched cohorts. Additional details of the standardized differences before and after matching are provided in Supplemental Table S3.
Baseline characteristics of matched cohorts
A selection of baseline characteristics with standardized differences for the matched cohorts is presented in . Additional baseline characteristics are provided in Supplemental Table S1.
For patients in the patiromer and NoKb matched cohorts, mean age, sex distribution, and low-income subsidy eligibility were similar. Mean baseline serum K+ concentration and eGFR were ∼5.6 mmol/L (SD: 0.4) and 36 mL/min/1.73 m2 (SD: 21), respectively, for the two cohorts. Baseline comorbidities and medication utilization were well-balanced. The number of baseline office visits reflects a high degree of HRU (mean [SD]: 10, 10). Among patients in the matched cohorts, 96% had CKD, ∼37% had CHF, ∼38% were insulin-dependent diabetics, and ∼33% had a baseline pharmacy claim for SPS. Thirty-two percent and 36% of patients in both cohorts had continuous baseline RAASi utilization and a baseline inpatient admission/ED encounter, respectively.
Aim 1 results: (i) inpatient admission or ED encounter; (ii) inpatient admission following an ED encounter
The Aim 1 results are presented in , with additional details provided in Supplemental Table S4. At 6 months post-index (i.e. the 0–6-month analysis interval), 25 and 37% of patients in the PAT and NoKb cohorts, respectively, had an inpatient admission or ED encounter. The OR (95% CI) was 0.58 (0.53–0.89) for the 253 matched pairs (506 patients) analyzed (). For the sensitivity analysis including matched pairs with a baseline inpatient admission or ED encounter (), the relative odds of the outcome were 65% less at 6 months post-index for patients in the patiromer cohort compared to patients in the NoKb cohort (OR [95% CI]: 0.35 [0.18–0.70]; N = 72 matched pairs, or 144 patients).
Figure 2. Logistic regression analyses (Aim 1) of inpatient admission or ED encounters for: (A) all matched pairs; (B) matched pairs with a baseline inpatient admission or ED visit. Analyses of inpatient admission following an ED encounter for: (C) all matched pairs; (D) matched pairs with a baseline inpatient admission or ED visit. CI: confidence interval; ED: emergency department; K+: potassium.
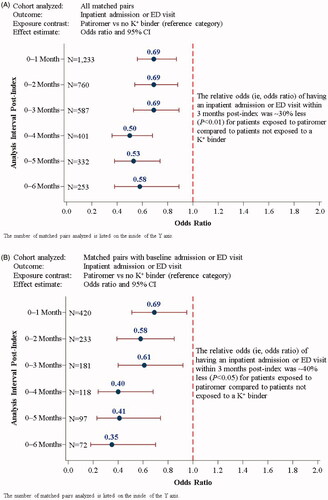

The associations between patiromer exposure (vs. NoKb exposure) and having an inpatient admission immediately following an ED encounter are presented in (all matched pairs) and (matched pairs with a baseline inpatient/ED encounter). After the first month post-index, the relative odds of having the outcome were 35–70% less for patients in the patiromer cohort compared to patients in the NoKb cohort (all p-values <.05).
Aim 2 results: inpatient admission costs ≥$14,900
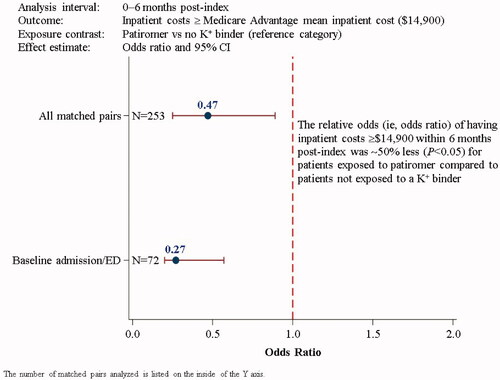
The Aim 2 results are presented in , with additional details provided in Supplemental Table S5. Among the 253 matched pairs analyzed at 6 months post-index, 6 and 12% of patients in the patiromer and NoKb cohorts, respectively, had inpatient admission costs that equaled or exceeded the mean Medicare Advantage expenditure per inpatient admission ($14,900). The relative odds of having inpatient costs ≥$14,900 were 53% less for patients exposed to patiromer compared to NoKb patients (OR [95% CI]: 0.47 [0.25–0.89]). The results were similar, albeit slightly magnified away from the null, for patients who had a baseline inpatient admission or ED encounter (OR [95% CI]: 0.27 [0.20–0.57]; N = 72 matched pairs). In this sensitivity analysis, 8% of patiromer-exposed patients and 25% of NoKb patients had inpatient costs ≥$14,900.
Figure 3. Logistic regression analyses (Aim 2) of having inpatient admission costs greater than or equal to the mean Medicare Advantage inpatient costs ($14,900) within 6 months post-index for all matched pairs and for matched pairs with a baseline inpatient admission or ED visit. CI: confidence interval; ED: emergency department; K+: potassium.
Aim 3 results: relative healthcare spending rate
The Aim 3 results are presented in , with additional details provided in Supplemental Table S6. At 6 months post-index, the Aim 3 analyses included 253 matched pairs (); 72 matched pairs were included in the sensitivity analysis of patients with a baseline inpatient admission or ED encounter ().
Figure 4. Relative healthcare spending rate analyses (Aim 3) within 6 months post-index stratified by service type for: (A) all matched pairs, and (B) matched pairs with a baseline inpatient admission or ED visit. CI: confidence interval; ED: emergency department, K+: potassium.
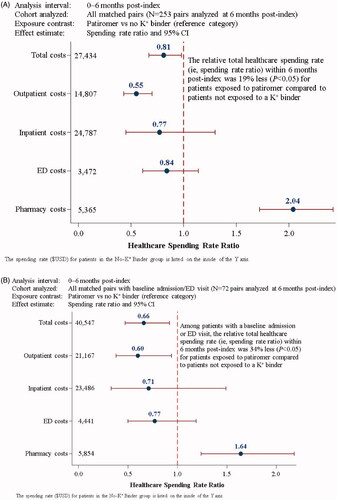
The total healthcare spending rate for patients in the NoKb cohort was $27,434. The relative total healthcare spending rate was 19% less (SRR [95% CI]: 0.81 [0.67–0.98]) for patients exposed to patiromer compared to NoKb patients (). Among patients with a baseline inpatient admission or ED encounter (), the total healthcare spending rate was $40,547 for the NoKb cohort. The SRR of 0.66 (95% CI: 0.47–0.92) depicts an ∼34% lower relative total healthcare spending rate associated with patiromer exposure compared to patients who were not exposed to a K+ binder.
Despite a 2-fold relative increase in outpatient pharmacy expenditures for patients in the patiromer cohort (SRR [95% CI]: 2.04 [1.72–2.42]), statistically significant relative reductions in total healthcare expenditures were observed for patients exposed to patiromer (compared to NoKb patients). This finding is consistent for the sensitivity analyses restricted to patients with a baseline inpatient admission or ED encounter. The observed relative reduction in total healthcare expenditures for patients exposed to patiromer was largely driven by reduced relative outpatient medical service expenditures (SRR [95% CI]: 0.55 [0.43–0.70]). Given the excess number of patients with zero cost ($0.00) values for inpatient admissions (408/506 patients) and ED encounters (363/506 patients), the ZINB regression models may have been underpowered to detect a true difference in the SRR for these outcomes. Nevertheless, the point estimates are directionally consistent with the overall findings.
Discussion
Among Medicare Advantage patients with HK, this research initiative endeavored to compare the association of inpatient/ED events and relative healthcare expenditures with patiromer exposure (vs. no exposure to K+ binder) in the real-world setting. Cohorts of patients exposed to patiromer and not exposed to a K+ binder were PS-matched and analyzed. Sensitivity analyses, restricted to patients with a baseline inpatient/ED encounter, were conducted for all analyses. Nearly all included patients had CKD (96%) in addition to other chronic comorbidities (e.g. diabetes [73%], coronary artery disease [∼45%], and CHF [∼37%]). During the 6-month follow-up period, Aim 1 results show that patiromer exposure was associated with a statistically significant reduced likelihood of a patient having an inpatient/ED encounter, compared to patients who were not exposed to a K+ binder. The Aim 2 results show that patiromer exposure is associated with an ∼50% reduced likelihood of incurring inpatient expenditures greater than or equal to the mean inpatient cost for Medicare Advantage patients (i.e. $14,900). The Aim 3 results also show that patients exposed to patiromer had a 2-fold increased (relative) spending rate for outpatient pharmacy expenditures; yet, patiromer exposure was associated with ∼20% overall reduction in total healthcare expenditures. The largest relative reduction in healthcare expenditures, associated with patiromer exposure, was observed for outpatient medical services. For all study Aims, the results were consistent for the sensitivity analyses restricted to patients with a baseline inpatient/ED encounter. The study authors hypothesize these findings may be the result of early mitigation of electrolyte-related complications for patients with appropriate HK management (i.e. via patiromer utilization) compared to patients who were not treated with a K+ binder.
Comparing the results of the present study to other published studies is challenging since, to date, no other studies have been published that evaluated relative HRU (i.e. inpatient admission or ED encounters) and relative healthcare expenditures for hyperkalemic patients exposed to a K+ binder (e.g. patiromer) compared to patients not exposed a K+ binder. Two published studies have evaluated inpatient admissions and healthcare expenditures among commercially insuredCitation15 and MedicareCitation13 patients with HK. In a Medicare population (conducted using data before the approval of patiromer), the 1-year cumulative incidences of inpatient admission (0.58) and ED encounter (0.51) were reported. These roughly compare to the present study’s observed inpatient/ED cumulative incidence of 0.37 (NoKb cohort) and 0.25 (patiromer cohort) at 6 months post-index. They also reported that mean total healthcare costs at 1 year were $34,362 overall and $37,202 for patients with CKD. Compared to the results of the present study at 6 months post-index, these findings are roughly comparable to the total healthcare and inpatient expenditure rates for patients not exposed to a K+ binder ($27,434). Compared to patients included in the referenced Medicare study, a greater percentage of patients included in the present study had CKD (30 vs. 96% in the present study), CHF (28 vs. 37%), and diabetes (49 vs. 72%).
This study has several limitations. While the patient selection was broadly inclusive of Medicare Advantage patients with HK, the requirement for both a serum K+ concentration and an HK diagnosis code substantially limited the sample size. Although this may have impacted the generalizability of the study findings (e.g. the study cohorts may include patients with more severe HK, more comorbidities, or higher HRU), the inclusion of patients with laboratory evidence and physician recognition of HK (i.e. via diagnosis) is critical to safeguarding internal validity.
Another potential limitation is exposure misclassification related to patiromer non-adherence or discontinuation—which may have occurred for a variety of reasons. Additionally, patients in the NoKb cohort may have been misclassified as “unexposed” if they were taking a K+ binder (e.g. SPS) from a pre-index dispensing. Despite the potential exposure misclassification, several published validation studies have shown pharmacy claims data to be a reliable predictor of medication exposureCitation31–36.
Another limitation relates to the precision of the stratified relative spending rate analyses for inpatient admission expenditures and ED expenditures using ZINB regression. In these analyses, an excess number of patients had zero cost values and therefore did not contribute to the relative inpatient or ED spending rate analyses (out of 506 patients [253 matched pairs], 81% had zero inpatient costs and 72% had zero ED costs). The ZINB analyses are contrasted by the logistic regression analyses of inpatient costs ≥$14,900 (yes/no), where all (uncensored) patients contributed to the effect estimate (i.e. the OR); thus providing greater power to detect a difference in the outcome, if one truly existed. To evaluate relative healthcare expenditures using ZINB regression, further research in a larger study population is warranted.
Conclusions
Among Medicare Advantage patients with HK, patiromer exposure was associated with a statistically significant reduced likelihood of having an inpatient/ED encounter during the 6-month follow-up period, compared to patients not exposed to a K+ binder. Patients exposed to patiromer were ∼50% less likely to incur inpatient costs greater than or equal to the mean inpatient cost for Medicare Advantage patients ($14,900). Despite the 2-fold relative increase in outpatient pharmacy expenditures, patiromer exposure was associated with a statistically significant ∼20% relative reduction in total healthcare expenditures (which included outpatient, inpatient, ED, and pharmacy costs). To fully elucidate and confirm these findings, further research is warranted in a larger cohort of patients with HK.
Transparency
Declaration of funding
This study was funded by Vifor Pharma, Inc. Authors employed by Vifor Pharma, Inc. (PJA and SDW) were involved in the study design, data acquisition, results interpretation, and contributed to the intellectual content during manuscript drafting and revisions.
Declaration of financial/other relationships
NRD works under contract with the Centers for Medicare and Medicaid Services to develop and maintain performance measures used for public reporting and pay for performance programs. He reports research grants and consulting for Amgen, Astra Zeneca, Boehringer-Ingelheim, Cytokinetics, MyoKardia, Novartis, SC Pharmaceuticals and Vifor Pharma, Inc. CGR reports consultant fees from AbbVie and Vifor Pharma, Inc. PJA and SDW report employment by and stock in Vifor Pharma, Inc. SGC reports consultant fees from Vifor Pharma, Inc., RenalytixAI, CHF Solutions, Bayer, Boehringer-Ingelheim, Takeda, Quark, ProKidney, and Akebia. He owns equity in RenalytixAI; receives research support from RenalytixAI, ProKidney, XORTX Pharma, and the Renal Research Institute; and receives salary support and research funds from the following NIH grants: U01DK106962, R01DK115562, R01DK112258, R01DK126477, R01DK118222-03S1, R01DK093770 09S1, and UH3DK114920. LG reports no conflicts of interest. Peer reviewers on this manuscript have no relevant financial or other relationships to disclose.
Author contributions
All authors made substantial contributions to the conception and design, acquisition of data, or analysis and interpretation of data; took part in drafting this article or revising it critically for important intellectual content; agreed to submit to the current journal; gave final approval of the version to be published; and agree to be accountable for all aspects of the work.
Acknowledgements
Editorial support was provided by Impact Communication Partners, Inc., and funded by Vifor Pharma, Inc.
Supplemental Material
Download MS Word (101.6 KB)References
- Einhorn LM, Zhan M, Hsu VD, et al. The frequency of hyperkalemia and its significance in chronic kidney disease. Arch Intern Med. 2009;169(12):1156–1162.
- Dunn JD, Benton WW, Orozco-Torrentera E, et al. The burden of hyperkalemia in patients with cardiovascular and renal disease. Am J Manag Care. 2015;21(15 Suppl 1):S307–S315.
- Epstein M, Lifschitz MD. The unappreciated role of extrarenal and gut sensors in modulating renal potassium handling: implications for diagnosis of dyskalemias and interpreting clinical trials. Kidney Int Rep. 2016;1(1):43–56.
- Palmer BF. Regulation of potassium homeostasis. Clin J Am Soc Nephrol. 2015;10(6):1050–1060.
- Kovesdy CP. Management of hyperkalaemia in chronic kidney disease. Nat Rev Nephrol. 2014;10(11):653–662.
- Lazich L, Bakris GL. Prediction and management of hyperkalemia across the spectrum of chronic kidney disease. Semin Nephrol. 2014;34(3):333–339.
- Sarafidis PA, Blacklock R, Wood E, et al. Prevalence and factors associated with hyperkalemia in predialysis patients followed in a low-clearance clinic. CJASN. 2012;7(8):1234–1241.
- Jain N, Kotla S, Little BB, et al. Predictors of hyperkalemia and death in patients with cardiac and renal disease. Am J Cardiol. 2012;109(10):1510–1513.
- Palmer BF. Managing hyperkalemia caused by inhibitors of the renin-angiotensin-aldosterone system. N Engl J Med. 2004;351(6):585–592.
- Albert NM, Yancy C, Liang L, et al. Use of aldosterone antagonists in heart failure. JAMA. 2009;302(15):1658–1665.
- Betts KA, Woolley JM, Mu F, et al. The prevalence of hyperkalemia in the United States. Curr Med Res Opin. 2018;34(6):971–978.
- Fitch K, Woolley JM, Engel T, et al. The clinical and economic burden of hyperkalemia on medicare and commercial payers. Am Health Drug Benefits. 2017;10(4):202–210.
- Mu F, Betts KA, Woolley JM, et al. Prevalence and economic burden of hyperkalemia in the United States medicare population. Curr Med Res Opin. 2020;36(8):1333–1341.
- Betts KA, Woolley JM, Mu F, et al. Postdischarge health care costs and readmission in patients with hyperkalemia-related hospitalizations. Kidney Int Rep. 2020;5(8):1280–1290.
- Betts KA, Woolley JM, Mu F, et al. The cost of hyperkalemia in the United States. Kidney Int Rep. 2017;3(2):385–393.
- Pitt B, Bakris GL, Bushinsky DA, et al. Effect of patiromer on reducing serum potassium and preventing recurrent hyperkalaemia in patients with heart failure and chronic kidney disease on RAAS inhibitors. Eur J Heart Fail. 2015;17(10):1057–1065.
- Weir MR, Bakris GL, Bushinsky DA, et al. Patiromer in patients with kidney disease and hyperkalemia receiving RAAS inhibitors. N Engl J Med. 2015;372(3):211–221.
- Bakris GL, Pitt B, Weir MR, et al. Effect of patiromer on serum potassium level in patients with hyperkalemia and diabetic kidney disease: the AMETHYST-DN randomized clinical trial. JAMA. 2015;314(2):151–161.
- Kovesdy CP, Gosmanova EO, Woods SD, et al. Real-world management of hyperkalemia with patiromer among United States veterans. Postgrad Med. 2020;132(2):176–183.
- Kovesdy CP, Gosmanova E, Woods SD, et al. Hospital and emergency department utilization in US veterans with hyperkalemia. Diabetes. 2020;69(Supplement 1):1087.
- Desai NR, Rowan CG, Alvarez PJ, et al. Hyperkalemia treatment modalities: a descriptive observational study focused on medication and healthcare resource utilization. PLOS One. 2020;15(1):e0226844.
- Desai NR, Rowan CG, Alvarez PJ, et al. Outpatient cost-effectiveness study of hyperkalemia management. J Cardiac Fail. 2020;26(10):S115.
- Kovesdy CP, Rowan CG, Conrad A, et al. Real-world evaluation of patiromer for the treatment of hyperkalemia in hemodialysis patients. Kidney Int Rep. 2019;4(2):301–309.
- Kovesdy CP, Gosmanova EO, Woods SD, et al. Emergency department visits and hospitalizations in US veterans with hyperkalemia. Am J Kidney Dis. 2019;73(5):690.
- Gosmanova EO, Kovesdy CP, Woods SD, et al. Disparities in real-world utilization patterns of potassium binders in US veterans with hyperkalemia. Nephrol Nurs J. 2019;46(2):238.
- Ripollone JE, Huybrechts KF, Rothman KJ, et al. Evaluating the utility of coarsened exact matching for pharmacoepidemiology using real and simulated claims data. Am J Epidemiol. 2020;189(6):613–622.
- Wells AR, Hamar B, Bradley C, et al. Exploring robust methods for evaluating treatment and comparison groups in chronic care management programs. Popul Health Manag. 2013;16(1):35–45.
- Iacus SM, King G, Porro G. Causal inference without balance checking: coarsened exact matching. Polit Anal. 2012;20(1):1–24.
- Schneeweiss S, Rassen JA, Glynn RJ, et al. High-dimensional propensity score adjustment in studies of treatment effects using health care claims data. Epidemiology. 2009;20(4):512–522.
- Moore BJ, Liang L. Medicare advantage versus the traditional medicare program: costs of inpatient stays, 2009–2017: statistical brief #262. Healthcare cost and utilization project (HCUP) statistical briefs. Rockville (MD): Agency for Healthcare Research and Quality (US); 2020.
- Drieling RL, LaCroix AZ, Beresford SAA, et al. Validity of self-reported medication use compared with pharmacy records in a cohort of older women: findings from the women's health initiative. Am J Epidemiol. 2016;184(3):233–238.
- Richardson K, Kenny RA, Peklar J, et al. Agreement between patient interview data on prescription medication use and pharmacy records in those aged older than 50 years varied by therapeutic group and reporting of indicated health conditions. J Clin Epidemiol. 2013;66(11):1308–1316.
- Grymonpre R, Cheang M, Fraser M, et al. Validity of a prescription claims database to estimate medication adherence in older persons. Med Care. 2006;44(5):471–477.
- Curtis JR, Westfall AO, Allison J, et al. Agreement and validity of pharmacy data versus self-report for use of osteoporosis medications among chronic glucocorticoid users. Pharmacoepidemiol Drug Saf. 2006;15(10):710–718.
- Erickson SR, Coombs JH, Kirking DM, et al. Compliance from self-reported versus pharmacy claims data with metered-dose inhalers. Ann Pharmacother. 2001;35(9):997–1003.
- Nachega JB, Hislop M, Dowdy DW, et al. Adherence to highly active antiretroviral therapy assessed by pharmacy claims predicts survival in HIV-infected South African adults. J Acquir Immune Defic Syndr. 2006;43(1):78–84.