
Abstract
Aims
The Novel Coronavirus (COVID-19) has infected over two hundred million worldwide and caused 4.4 million of deaths as of August 2021. Vaccines were quickly developed to address the pandemic. We sought to analyze the cost-effectiveness and budget impact of a non-specified vaccine for COVID-19.
Materials and Methods
We constructed a Markov model of COVID-19 infections using a susceptible-exposed-infected-recovered structure over a 1-year time horizon from a U.S. healthcare sector perspective. The model consisted of two arms: do nothing and COVID-19 vaccine. Hospitalization and mortality rates were calibrated to U.S. COVID-19 reports as of November 2020. We performed economic calculations of costs in 2020 U.S. dollars and effectiveness in units of quality-adjusted life years (QALYs) to measure the budget impact and incremental cost-effectiveness at a $100,000/QALY threshold.
Results
Vaccines have a high probability of reducing healthcare costs and increasing QALYs compared to doing nothing. Simulations showed reductions in hospital days and mortality by more than 50%. Even though this represents a major U.S. investment, the budget impacts of these technologies could save program costs by up to 60% or more if uptake is high.
Limitations
The economic evaluation draws on the reported values of the clinical benefits of COVID-19 vaccines, although we do not currently have long-term conclusive data about COVID-19 vaccine efficacies.
Conclusions
Spending on vaccines to mitigate COVID-19 infections offer high-value potential that society should consider. Unusually high uptake in vaccines in a short amount of time could result in unprecedented budget impacts to government and commercial payers. Governments should focus on expanding health system infrastructure and subsidizing payer coverage to deliver these vaccines efficiently.
Introduction
The SARs-CoV-2 virus (COVID-19) has been rapidly transmitted through nearly 200 countries, infected more than 200 million individuals, and resulted in 4.4 million of deaths since its onset in China in late 2019. While dozens of countries have been heavily impacted, the U.S. has experienced one of the highest levels of morbidity and mortality from the pandemic. Over 38 million Americans have been infected and over 630,000 have died from COVID-19 as of the beginning of August 25, 2021Citation1. Widely cited projections available as of July 2021 suggest that many more individuals died than has been reported and deaths may continue to mount despite vaccine roll-outCitation2. Equally concerning is the disproportionate risk of infection and mortality to underrepresented minorities, especially African Americans and Hispanics, which make up more than 50% of COVID-19 cases in urban areasCitation3.
The magnitude of morbidity and mortality from the pandemic, as well as its economic impact and effect on all sectors of society, galvanized the scientific community. The enormous activity was devoted to identifying treatments that reduce viral replication or host response, as well as producing vaccines that ultimately diminish viral transmissibility. A recent review of World Health Organization (WHO) and U.S. clinical trials registries revealed at least 200 clinical trials investigated the therapeutic benefits of 92 drugs or plasma against COVID-19. These trials included at least 64 monotherapies and 28 different combinationsCitation4,Citation5. Similarly, many companies explored, and several companies launched, vaccines to protect against COVID-19 infectionsCitation6. Thus, there are emerging and promising remedies to control the pandemic.
Vaccines should be given to anyone who is eligible and vulnerable. As the number of vaccinated grows, non-vaccinated individuals benefit through herd immunityCitation7. Inoculations have the benefit of preventing the downstream effects of a disease, keeping societies more productive and safer, and reducing the need for social isolation measures. However, vaccines are often not as efficient as treatments, and they must be given to many individuals who otherwise might not contract the disease. In addition, vaccinating a large number of individuals in a reduced timeframe requires the scale-up of current vaccination campaigns, additional cold storage and efficient supply chains, and administration (e.g. an injection) from a healthcare professional. These additional steps lead to high up-front costs for governments and payersCitation8. Additional costs may also arise due to adverse events if the safety profile is not well established.
Despite the catastrophic nature of the current pandemic and unprecedented scientific effort to address it, the relative value of a vaccine for COVID-19 has not been widely characterizedCitation9. Treatments, conversely, have been investigated in the immediate term. The Institute for Clinical and Economic Review released an early cost-utility analysis of the investigational drug remdesivir (Gilead Science, Inc.) in order to estimate the price to treat COVID-19; their resulting price ranged from $4,460 to $52,880 per course of treatment for willingness-to-pay thresholds between $50,000 and $150,000 per quality-adjusted life-year (QALY)Citation10. However, vaccines require a much greater uptake within local populations to be effective, potentially driving down the price per dose substantially below the cost of other treatments. Understanding the differences between vaccines and treatments is imperative to better understand the value for money in vaccinesCitation11. Our objective was to quantify the comparative value of an innovative vaccine using economic modelling based on current rates of COVID-19 infections and alternative interventions in the U.S. This approach can be used to generate fundamental knowledge regarding the economic burden of the COVID-19 pandemic. In addition, our analysis can be used to estimate the cost-effectiveness and budget impact of new vaccines developed to curb the pandemic.
Methods
Study design
We developed a Markov model to evaluate the cost-effectiveness of a vaccine to counter the COVID-19 pandemic. We used the model to compare vaccinations to the status quo for most communities in the U.S.: doing nothing. The model was designed using a unidirectional Susceptible-Exposed-Infected-Recovered (SEIR) structure, which has been used to construct a number of epidemiological and mathematical models for the spread of COVID-19Citation12–15. Once individuals become exposed, they remain in the exposed state until a potential infection or the end of the time horizon.
In accordance with guidelines established by the Second Panel on Cost-effectiveness in Health & Medicine, we used a U.S. healthcare sector perspective to measure resource utilization, financial burden, and health effects experienced between patients, payers, and providersCitation16. The model is performed in 1-day cycles and reported outcomes in a 1-year time horizon. As we assumed the COVID-19 vaccine will be effective for a similar period as the influenza vaccine, we chose not to model costs and outcomes beyond the first year. All costs were inflated to represent 2020 U.S. dollars and we measured effectiveness in units of QALYs.
We sought several findings from the model results. By applying the economic model to the roughly 330 million U.S. residents, we were able to calibrate model outcomes with real-world data on disease outcomes. We simulated the impact of COVID-19 and vaccines on the U.S. population in terms of the total cost, hospital utilization, and mortality. The model was also purposed to measure the incremental cost-effectiveness ratio (ICER) and budget impact from the healthcare sector perspective. ICERs were interpreted at a willingness-to-pay threshold of $100,000/QALY, which is consistent with current U.S. societal estimatesCitation17. The budget impact was estimated assuming that 330 million Americans begin at-risk in the do-nothing’s arm. The comparison is drawn between the program cost associated with doing nothing and the vaccination of 60% of the at-risk population in the vaccine arm for the U.S. healthcare sector. Even with a dominant ICER, the budget impact provides a valuable benchmark for allocating resources in a constrained budget.
Model structure
Our SEIR model simulated the transition of the U.S. population through ten mutually exclusive health states (). A detailed explanation of the model structure is provided in the Supplemental Technical Appendix. This was a dynamic model where the rate of infected changed over time as the number of susceptible and exposed patients also changed, once exposed individuals remained in the exposed state until acquiring infection or the end of the model. In addition, the model was calibrated to actual daily rates of COVID-19 cases and deaths as of 1 November 2020 and maintained trajectories consistent with forecasted values. All patients began in a susceptible (S) population before moving unidirectionally through the model. Over the course of time, patients would then become exposed (E) to the COVID-19 virus. Upon exposure, a proportion of the population would become infected (I), individuals otherwise remain exposed until infection or until the end of the one-year time horizon. We assumed five separate infected states (I0–I4) based on current information about COVID-19Citation18,Citation19. The states that did not require hospitalization included: (I0) asymptomatic; (I1) uncomplicated or mild symptoms; and (I2) moderate symptoms without signs of severe pneumonia. Patients who required hospitalization to manage symptoms were broken up into two states: (I3) severe; or (I4) criticalCitation19. Any patient who survived infection transitioned to recovered (R). Patients in I3 or I4 also risked death.
Figure 1. Markov model of disease progression with coronavirus disease 2019 (COVID-19). Patients progressed through a modified “SEIR” process (susceptible-exposed-infected-recovered). This model was used to conduct both the cost-effectiveness analysis and the budget impact model. The infection phases were staged from 0 through 4 in terms of increasing escalation, including the use of critical care services. Patients who did not recover from COVID-19 died. Model alternatives to doing nothing included treatment and vaccination to avoid entry into the infected phases.
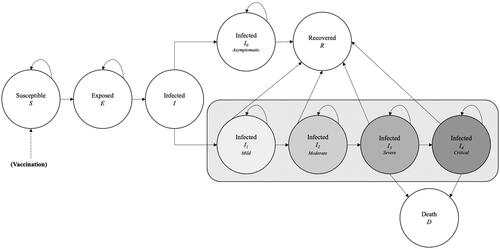
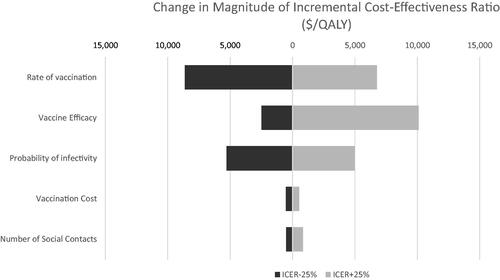
Figure 2. Tornado diagram of one-way sensitivity analysis for parameter variabilities with the greatest impact on study results. Abbreviations: ICER, Incremental cost-effectiveness ratio; QALY, Quality-adjusted life year.
Each of the infection phases had different costs, utilities, and set periods of incubation prior to escalation or recovery. In I1, individuals remained at home without the need for medical intervention, which lasted for 10 d; however, patients could transition to a worsening state after 4 d. In I2, patients were prescribed interventions from an outpatient provider for a 14-day duration; patients in I2 could transition to a worsening state after 4 dCitation18. In I3, severe symptoms such as pneumonia required hospitalization for observation and lasted for 8 dCitation18. Patients could transition from severe to critical symptoms after 3 d, where critical symptoms implied the use of a ventilator in an intensive care unit. In I4, the critical phase could last an additional 10 d while patients experienced acute respiratory distress syndrome (ARDS)Citation18.
In total, the longest that an individual could be under duress between different infection levels was 20 d. After an individual completed a duration in the infection states, they either recovered (R) or died. Patient mortality only occurred due to complications in I3 or I4 caused by pneumonia/ARDS or shockCitation18.
We customized the comparator arms of the model to capture health state transitions as appropriate in reference to the base case. The vaccination arm separated a large proportion of the population out of the susceptible pool, contributing to an assumed herd immunityCitation20. In this scenario, we assumed that 60% of the population would be vaccinated (and thus removed from the initial pool of susceptibles and are placed in the recovered state), consistent with recommendations by Gavi, the Vaccine Alliance ()Citation27.
Table 1. Model parameters.
Model parameters
Costs
We applied micro-costing methods to calculate the costs associated with each symptomatic infection state, prevention or treatment strategy and followed the human capital approach to consider the cost of illness for all Americans, regardless of age or employment status ()Citation38. Individuals in health states S, E, I0 and R were assumed to have no additional costs.
In addition to calculating the costs from the health sector perspective, we calculated and presented the productivity loss separately, to provide additional evidence. Infected patients were assigned the cost of a lost workday, based on methods recommended by the U.S. Bureau of Labor Statistics. The cost of a lost workday was calculated from the U.S. GDP of $21 trillion distributed among 330 million individuals, each averaging 261 workdays to represent an average of $243.81 per person per dayCitation28. Thus, for each day an individual was sick, society lost this valueCitation39. This was a reasonable cost to consider since, even if the infected person was elderly, not employed, or of working age. Elderly individuals frequently work beyond the retirement age, according to recent surveysCitation40. Unemployed individuals or children could have occupied the time of another caretaker as a result. Children, specifically, would miss a day of school at the same value and/or resulted in a parent missing a day of workCitation41.
Patients in I1 were assigned daily costs for acetaminophen and guaifenesin expectorant, as well as sick leaveCitation29,Citation30. Sick leave was assigned only 50% of the total societal cost of sick leave since we assumed half of the patients with a mild infection may be able to maintain a normal production schedule while working from homeCitation28.
Patients in I2 were assigned daily costs for acetaminophen and a benzonatate prescriptionCitation29,Citation31. This care pathway was initiated with the average cost of a visit to primary or urgent care providerCitation32. They were also assigned the cost of a COVID-19 test to confirm the cause of illnessCitation32. These patients were allocated the cost of full sick leaveCitation28.
The costs of I3 and I4 were based on initial consultation with a primary, urgent care, or emergency department provider; costs were averaged across all three providers typesCitation32. This consultation included a COVID-19 test and chest x-rayCitation32. Patients were then appropriately allocated the cost of hospital admission through general medicine (I3) or critical care with respiratory support (I4), as well as sick leaveCitation28,Citation33.
The costs of a new vaccine were assumed from the U.S. list price for the influenza vaccine, in accordance with the WHO guidance on costingCitation34.
Probabilities
Most model transition probabilities were obtained from official reports of COVID-19 outcomes, which were current as of 1 August 2020, through these sources: the Johns Hopkins Coronavirus Resource Center (coronavirus.jhu.edu, Baltimore, MD); the U.S. Center for Disease Control and Prevention (CDC, www.cdc.gov/coronavirus/2019-ncov, Atlanta, GA); the World Health Organization (who.int, Geneva, CH); and the Institute for Health Metrics and Evaluation (https://covid19.healthdata.org/united-states-of-america, Seattle, WA). In a small number of instances where data were not available through these sources, such as for historical outcomes of comparators based on the influenza vaccination, we obtained model probabilities from the peer-reviewed and clinical trial literature. Given that the model time horizon is only one year, we assumed that the vaccine would provide immunity throughout this period.
Health utilities
We measured utilities in units of QALYs based on EQ-5D Index Scores collected from the U.S. Medical Expenditure Panel SurveyCitation35,Citation42,Citation43. In general, QALYs range from 0.0 (death) to 1.0 (full health). We assumed the U.S. population average was 0.88 QALYsCitation35. Infected and symptomatic patients had utilities that reflected less desirable health states due to limited mobility, pain, and trouble breathing, among other challenges (). In the state with the availability of a vaccine, we assumed a higher population average of 0.90 QALYs because utilities are a reflection of preferences, and individuals would likely prefer the availability of vaccines to forgo the threat of infectionCitation37.
Assumptions
We made several modeling assumptions. First, we assumed an even distribution of COVID-19 outcomes across the U.S. Second, we assumed multiple infections (I) states based on current peer-reviewed reports. Third, we made assumptions about the price, efficacy, and herd immunity potential of the vaccines based on the influenza vaccine. Fourth, we assumed that vaccines presented preferential options which positively impacted health utilityCitation37. Fifth, we assumed that the costs of developing, manufacturing, and distributing a health technology are included in its list price. The $15.87 cost of administration is an add-on cost from the provider perspective that we add into the model separately from list priceCitation44.
Sensitivity analysis
We conducted sensitivity analyses to test model uncertainty by varying the expected parameter valuesCitation45. Parameter value uncertainty ranged within the reported 95% confidence interval or standard deviation. In rare circumstances where no uncertainty range was reported, we varied the parameter by ±25% of its mean or median in order to assess its impact on the model results. Univariate one-way sensitivity analyses and threshold analyses were done first. A Bayesian multivariate probabilistic sensitivity analysis (PSA) was performed using 10,000 Monte Carlo simulations with no intervention as the baseline approachCitation46. The PSA applied beta distributions for variables with values ranging between 0.0 and 1.0, such as probabilities and utilities, and gamma distributions for positive values greater than 1.0 such as costs.
Model calibration
The model was calibrated to rates of COVID-19 infection and mortality as of 1 August 2020, reported by the University of Washington Institute for Health Metrics and Evaluation (IHME). The do-nothing’s arm was based on infection and mortality rates as of 15 March, prior to which the U.S. did not implement a mitigation strategy. From 15 March onward, COVID-19 outcomes based on the adoption of social distancing and shutdown orders were used to calibrate the baseline comparator.
By November 2020, IHME reported over 11.5 million infected cases and 249,000 deaths. By comparison, at the same time points, our model made the following predictions: 19.7 million cases and 203,000 deaths in the do-nothing’s arm. We believe these model figures present an acceptable degree of uncertainty surrounding the extent to which states instituted stay-at-home orders in March and April. The inconsistent implementation of health safety measures throughout the country challenged our ability to perfectly differentiate the contribution of such measures to variability in COVID-19 infection rates. Furthermore, our do-nothing approach did not account for the relaxing of state and local regulations nor the immense travel that took place between the end of November and the end of December in the U.S.
Results
Estimated costs and health impact of the pandemic
Using this model, we were able to estimate the economic impact of the COVID-19 pandemic across 330 million people in the U.S. The baseline approach, doing nothing, could be associated with about $34 billion in financial impact to the healthcare sectors based on direct medical costs in the first year alone (). These costs were mostly represented by nearly 6.3 million hospital days and over 283,000 deaths. There was an additional $32 billion in loss to the labor sector due to productivity losses (ex. lost wages from sick days).
Table 2. Cost-effectiveness analysis comparing vaccination to no intervention to address the U.S. COVID-19 pandemic.
Effect of vaccines
Vaccines reduced societal costs to only $13 billion, more than a 60% reduction in spending as compared to the alternative of doing nothing. The presence of the vaccines and herd immunity offered several improved outcomes, such as 3.4 million fewer hospital days and nearly 154,000 fewer deaths. Moreover, there was only a $15 billion financial impact on the labor sector due to productivity losses among the non-immunized.
Economic findings
Under the base-case findings of our cost-effectiveness analysis, vaccines presented a much greater value proposition for the U.S. healthcare sector than doing nothing. Vaccines dominated doing nothing by providing greater QALYS at lower costs.
In terms of budget impact, vaccinations represent a lower-cost alternative when considering the downstream costs of disease burden to U.S. society and payers, who would have to front the initial costs of technologies. If we assume that the costs of technology can be financed across a risk pool of 330 million Americans in 12 months, then doing nothing comes at a societal budget impact of $102 per person. By comparison, the budget impact of the vaccination was $40 per person, making it the more affordable option.
Sensitivity analysis
In the one-way sensitivity analysis, uncertainty intervals around parameter estimates did not change the results of the model from the main conclusions (). Parameters with the greatest impact on model results included: vaccine cost; vaccination rate; and vaccine efficacy.
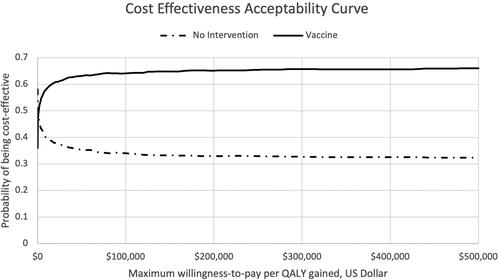
The PSA highlighted the robustness of the findings from the base-case analysis. At a willingness-to-pay threshold of $100,000/QALY, the vaccination option was cost-effective in 66% of simulations ().
Figure 3. Cost-effectiveness acceptability curve of the probability that a comparator is cost-effective at a given cost-effectiveness threshold, based on results of a probabilistic sensitivity analysis of 10,000 Monte Carlo simulations. Abbreviation. QALY, Quality-adjusted life year.
Discussion
The COVID-19 pandemic has resulted in enormous worldwide morbidity, mortality, and socioeconomic upheaval. Given the global challenges, as well as uncertainty regarding the pandemic’s future course, a tremendous scientific effort led to the identification of vaccines that can reduce the likelihood or consequences of coronavirus infection. We used an economic model to explore the relative value of vaccines. While our findings are not conclusive without using specific health technologies, we do anticipate that the available vaccines offer increased effectiveness at lower direct costs to the U.S. economy as opposed to doing nothing.
These findings are important to key stakeholders in the U.S. healthcare sector, including policymakers, and other health systems around the globe. The fact that an ICER would be negative (i.e. that costs would decrease and QALYs would increase with new technology) when looking at the relative value of vaccines at a typical cost compared to current options for COVID-19 management suggests that cost-effectiveness analysis may not be a useful tool in order to establish a price per technology, but rather a blunt object. Consensus across the health economic community is that negative ICERs are “meaningless” since there is no cost-effectiveness threshold (e.g. $100,000/QALY) that offers a ceiling on price for relative valueCitation47. Therefore, alternative economic methods may be more well suited to address the exactness of pricing for treatment or vaccine, such as a budget impact analysis or benefit-cost analysis. As payers, manufacturers, governments, providers, and patients engage in discussions about pricing, these alternative methods in the economic evaluation may facilitate productive conversations to ensure that payer budgets maintain balance with respect to demand.
While budget impact analyses, for instance, maybe a tool that payers and manufacturers leverage to set prices for healthcare technologies, this methodology does favor payers. It is a common tool used particularly in vaccine economics when vaccines offer high value leading to negative ICERs, but potential budget impacts that may inhibit adoption. For example, the application of the vaccine for the human papillomavirus virus in Thailand comes at a negative ICER, but a prohibitive budget impact at the current list priceCitation48.
From a logistical point of view, current production facilities must increase production to meet the global demand for vaccines. There are distributional challenges in the supply chain. Furthermore, prices may or may not be tiered across countries and the benefits from the vaccination may not be equal across populations. Increased vaccine hesitancy due to misinformation can lower the vaccines’ benefits. In such situations, treatments can lower the mortality rates for those that are unimmunized. Thus, it is imperative to utilize both vaccines and treatments.
As innovative manufacturers launch and market vaccines for COVID-19, the U.S. should explore innovative new rounds of investment in stimulus funds under The Coronavirus Aid, Relief and Economic Security (CARES) ActCitation49. The CARES Act does not address the role that government will play in footing the bill to vaccinate millions of people at once, yet this is a realistic prospect for the U.S. and many countries in North America, Europe, the Middle East, and East AsiaCitation50,Citation51. The socioeconomic upheaval that the COVID-19 pandemic has caused generated tremendous vaccine demand. Governments need to be prepared to spend billions of dollars to cover the costs of vaccines that have extremely high uptake in a short period of timeCitation52. In the case of our analysis, the U.S. could face nationwide demand in the range of $13 billion in the first year. Countries need to be prepared to handle high vaccine demand while continuing to cover other medical necessities. Legislation, such as the CARES Act, will likely need to allocate funding to subsidize vaccines and treatments to allow distribution without delayCitation53,Citation54. This is particularly important for Medicare beneficiaries, which are some of the most vulnerable COVID-19 patients, but for whom Medicare Part D fails to extend consistent coverage to vaccinesCitation55.
The U.S. does have one solution if pricing negotiations do fail. It could invoke 28 U.S. Code Section 1498 of the U.S. patent law, which would allow the government to authorize a company to manufacture a low-cost version of a COVID-19 vaccine for vulnerable populationsCitation56. In turn, the U.S. government would provide “reasonable” compensation to the patent holderCitation57.
As with all models, ours has several limitations. First, our model does not completely demonstrate the time-dependency of the COVID-19 epidemic based on a limited understanding of the virus at this time. Transition probabilities are usually regressed over several periods of seasonal data, whereas our understanding of the COVID-19 infection is based upon initial reports. That being said, we ranged all model parameters within credible uncertainty intervals for the sensitivity analyses to provide a realistic outlook for multiple scenarios. Second, our model presumes a static rather than dynamic population and, thus, we do not consider the entry or exit of individuals due to birth or death from other causes. Third, our approach does not account for the different proportions and corresponding risks of age groups in the U.S. population, yet the risks of COVID-19 infection vary by sociodemographic factors. These data will become important so that targeted intervention can reduce the wasteful spending on health technology to protect those at greatest risk, much like how the herpes zoster vaccine is almost exclusively prescribed for individuals over the age of 50 to prevent shinglesCitation58. As more data become available on outcomes in this subgroup, this model will provide a useful template for subgroup analyses. Fourth, the health utilities for this study are based on values of previous studies about SARS infection, not the COVID-19 infection itself. Fifth, we have not included the programmatic costs for mass vaccination campaigns which would increase the budget impact and slightly impact the ICER, given the relative lack of sensitivity of the ICER to vaccine cost. Sixth, we did not include reinfection rate as there is limited data available on the rate and frequency of reinfections. Seventh, the modified unidirectional SEIR model structure that we used did not allow for individuals to move backward from exposed to susceptible. This limitation might lead to an underestimate of the value of the vaccine as individuals being exposed multiple times would lead to a higher rate of infection. Eighth, we did not include productivity losses for close contacts of infected individuals. This again would understate the value of the vaccine as productivity losses could be higher in the scenarios without the vaccine.
This economic model represents an initial attempt to understand the current burden of COVID-19 on the U.S. economy, particularly the healthcare sector. As more data about the social determinants of COVID-19 outcomes become available, society will benefit from a better understanding. Targeted vaccinations can address the needs of vulnerable subpopulations such as the elderly, chronically ill, racial and ethnic minorities, and pediatrics prior to widespread immunization programmingCitation59. Furthermore, this model does not control for the increase in morbidity and mortality related to COVID-19 in late 2020 and early 2021. Consequently, the results of this model offer a conservative estimate of value because controlling for the added costs of care and increase in morbidity and mortality would increase the value of the vaccine. Future research should investigate the cost-effectiveness of the COVID-19 vaccines with longer time horizons to understand the longevity of immune response and the need for a growing infrastructure.
Conclusions
Efficacious vaccines for COVID-19 can provide high value to patients, healthcare systems, and the economy. Vaccines could reduce COVID-19 costs by 80%, or more, while significantly improving clinical outcomes for many individuals. As vaccines are utilized, there are three practical issues that governments, health systems, and payers should address. One concern is that vaccine pricing will be challenging to establish based upon typical pricing procedures, given the unprecedented disease burden and costs. The second concern is that the budget impact of these technologies could be substantial if uptake is high. The third concern is that demand for these technologies will be high and necessitate capacity building to properly allocate these technologies in a prioritized order for individuals with the greatest risk, stories have already emerged about wasted vaccine distribution due to lack of coordination between public and private entities. Government should map out policies to subsidize costs of vaccine and treatment development, as well as an expanded healthcare infrastructure with other healthcare stakeholders. This can ensure that business transactions with manufacturers are not delayed in order for patients to swiftly receive necessary and beneficial technology to address the COVID-19 pandemic.
Transparency
Declaration of funding
WP is supported by an unrestricted grant from the U.S. National Institutes of Health [KL2 TR001854]. WP and SM are supported by a grant in vaccine economics from the Bill & Melinda Gates Foundation.
Declaration of financial/other relationships
WP has served as a paid advisor to Molnlycke Health Care and is a Principal at Monument Analytics, a health care consultancy whose clients include the life sciences industry as well as plaintiffs in opioid litigation. This arrangement has been reviewed and approved by the University of Southern California in accordance with its conflict-of-interest policies.
SM is an employee of Monument Analytics.
NR is an employee of Monument Analytics.
BC is an employee of Monument Analytics
FC is an employee of Monument Analytics
JB has received consulting fees from Monument Analytics, a healthcare consultancy whose clients include the life sciences industry as well as plaintiffs in opioid litigation. This arrangement has been reviewed and approved by Johns Hopkins University in accordance with its conflict-of-interest policies.
JT is an employee and co-founding Principal at Monument Analytics.
GCA is past Chair and a current member of FDA’s Peripheral and Central Nervous System Advisory Committee; is a co-founding Principal and equity holder in Monument Analytics, a healthcare consultancy whose clients include the life sciences industry as well as plaintiffs in opioid litigation; and is a past member of OptumRx’s National P&T Committee. This arrangement has been reviewed and approved by Johns Hopkins University in accordance with its conflict-of-interest policies.
Peer reviewers on this manuscript have no relevant financial or other relationships to disclose.
Supplemental Material
Download MS Word (31.3 KB)Acknowledgements
None reported.
Data availability statement
All model data are available upon request by the study authors.
References
- Johns Hopkins Coronavirus Resource Center. COVID-19 Map Baltimore: Johns Hopkins University; 2020 [cited 2021 Jun 4]. Available from: coronavirus.jhu.edu
- Institute for Health Metrics & Evaluation (IHME). COVID-19 Projects assuming full social distancing through May 2020: Total Deaths Seattle: University of Washington; 2020 [cited 2021 Jan 13]. Available from: www.healthdata.org.
- Yancy CW. COVID-19 and African Americans. JAMA. 2020;323(19):1891–1892.
- Mehta HB, Ehrhardt S, Moore TJ, et al. Characteristics of registered clinical trials assessing treatments for COVID-19: a cross-sectional analysis. BMJ Open. 2020;10(6):e039978.
- Sanders JM, Monogue ML, Jodlowski TZ, et al. Pharmacologic treatments for coronavirus disease 2019 (COVID-19): a review. JAMA. 2020;323(18):1824–1836.
- Park A. COVID-19 vaccine shipped, and drug trials start time. New York: TIME, 2020.
- Mauskopf J, Standaert B, Connolly MP, et al. Economic analysis of vaccination programs: an ISPOR good practices for outcomes research task force report. Value Health. 2018;21(10):1133–1149.
- Carvalho N, Jit M, Cox S, et al. Capturing budget impact considerations within economic evaluations: a systematic review of economic evaluations of rotavirus vaccine in low- and middle-income countries and a proposed assessment framework. PharmacoEconomics. 2018;36(1):79–90.
- Apuzzo M, Kirkpatrick DD. COVID-19 changed how the world does science, together. New York Times. 2020 Apr 1.
- Whittington MD. Campbell JD, Institute for Clinical and Economic Review (ICER). Alternative Pricing Models for Remdesivire and Other Potential Treatments fo COVID-19 Cambridge, MA: Institute for Clinical and Economic Review (ICER); 2020 [cited 2020 Jun 12]. Available from: https://icer-review.org/wp-content/uploads/2020/05/ICER-COVID_Initial_Abstract_05012020-3.pdf.
- Bordi L, Nicastri E, Scorzolini L, et al. Eleonara L; INMI COVID-10 study group and collaborating centers. Differential diagnosis of illness in patients under investigation for the novel coronavirus (SARS-CoV-2), Italy, February 2020. Euro Surveillance. 2020;25(8):2000170.
- Iwata K, Miyakoshi C. A simulation on potential secondary spread of novel coronavirus in an exported country using a stochastic epidemic SEIR model. J Clin Med. 2020;9(4):944.
- Wei YY, Lu ZZ, Du ZC, et al. Fitting and forecasting the trend of COVID-19 by SEIR(+CAQ) dynamic model. Zhonghua Liu Xing Bing Xue za Zhi = Zhonghua Liuxingbingxue Zazhi. 2020;41(4):470–475.
- Hou C, Chen J, Zhou Y, et al. The effectiveness of quarantine of Wuhan city against the Corona Virus Disease 2019 (COVID-19): a well-mixed SEIR model analysis . J Med Virol. 2020;92(7):841–848.
- Gu Y. COVID-19 projections using machine learning 2020 [cited 2020 Aug 10]. Available from: https://covid19-projections.com/.
- Sanders GD, Neumann PJ, Basu A, et al. Recommendations for conduct, methodological practices, and reporting of cost-effectiveness analyses: second panel on cost-effectiveness in health and medicine. JAMA. 2016;316(10):1093–1103.
- Phelps CE. A new method to determine the optimal willingness to pay in cost-effectiveness analysis. Value Health. 2019;22(7):785–791.
- Cascella M, Rajnik M, Cuomo A, et al. Features, evaluation and treatment coronavirus (COVID-19). Treasure Island (FL): StatPearls Publishing Copyright © 2020, StatPearls Publishing LLC; 2020.
- Shi Y, Wang Y, Shao C, et al. COVID-19 infection: the perspectives on immune responses. Cell Death Differ. 2020;27(5):1451–1454.
- Fine P, Eames K, Heymann DL. “Herd immunity”: a rough guide. Clin Infect Dis. 2011;52(7):911–916.
- Yang Z, Zeng Z, Wang K, et al. Modified SEIR and AI prediction of the epidemics trend of COVID-19 in China under public health interventions. J Thorac Dis. 2020;12(3):165–174.
- Eames KT, Tilston NL, Brooks Pollock E, et al. Measured dynamic social contact patterns explain the spread of H1N1v influenza. PLOS Comput Biol. 2012;8(3):e1002425.
- Whitehead S. CDC director on models for the months to come: “this virus is going to be with us”. Washington (DC): National Public Radio; 2020 [cited 2020 Apr 8]. Available from: https://www.npr.org/sections/health-shots/2020/03/31/824155179/cdc-director-on-models-for-the-months-to-come-this-virus-is-going-to-be-with-us
- Chinese Center For Disease Control Prevention. The epidemiological characteristics of an outbreak of 2019 novel coronavirus diseases (COVID-19) in China. Zhonghua liu xing bing xue za zhi = Zhonghua liuxingbingxue zazhi. 2020;41(2):145–151.
- Severe Outcomes Among Patients with Coronavirus Disease 2019 (COVID-19)—United States, February 12–March 16, 2020. MMWR Morb Mortal Wkly Rep. 2020;69:343–346.
- Centers for Disease Control and Prevention. Key Updates for Week 45, ending November 7, 2020. Atlanta, GA: U.S. Department of Health and Human Services, Centers for Disease Control and Prevention. Available from: https://www.cdc.gov/coronavirus/2019-ncov/covid-data/pdf/covidview-11-13-2020.pdf
- GAVI the Vaccine Alliance. What is Herd Immunity?: GAVI; 26 March 2020 [cited 2020 Apr 8]. Available from: https://www.gavi.org/vaccineswork/what-herd-immunity
- Bureau of Labor Statistics. Technical Information about the BLS Major Sector Productivity and Costs Measure Washington, D.C.: U.S. Bureau of Labor Statistics; 2008 [cited 2020 Apr 8]. Available from: https://www.bls.gov/lpc/lpcmethods.pdf
- Drugs.com. Acetaminophen Prices, Coupons and Patient Assistance Programs 2020 [cited 2020 Apr 8]. Available from: https://www.drugs.com/price-guide/acetaminophen#oral-tablet-325-mg
- Drugs.com. Tussin EXPECTORANT 2020 [cited 2020 Apr 20]. Available from: https://www.drugs.com/otc/102841/tussin-expectorant.html
- Drugs.com. Benzonatate Prices, Coupons and Patient Assistance Programs 2020 [cited 2020 Apr 8]. Available from: https://www.drugs.com/price-guide/benzonatate
- Castlight Health. The Costs of COVID-19 2020 [cited 2020 Apr 8]. Available from: https://www.castlighthealth.com/wp-content/uploads/2020/03/Costs-of-COVID-19.pdf
- Rae MC, Kurani N, McDermott D, et al. Potential Costs of Coronavirus Treatment for People with Employer Coverage: Peterson-KFF; 2020 [cited 2020 Apr 8]. Available from: https://www.healthsystemtracker.org/brief/potential-costs-of-coronavirus-treatment-for-people-with-employer-coverage/
- World Health Organization. WHO Guideline on Country Pharmaceutical Pricing Policies Geneva: World Health Organization; 2015 [cited 2020 Apr 8]. Available from: https://apps.who.int/iris/bitstream/handle/10665/153920/9789241549035_eng.pdf
- Sullivan PW, Ghushchyan V. Preference-based EQ-5D index scores for chronic conditions in the United States. Med Decis Making. 2006;26(4):410–420.
- Khan K, Muennig P, Gardam M, et al. Managing febrile respiratory illnesses during a hypothetical SARS outbreak. Emerg Infect Dis. 2005;11(2):191–200.
- Lee BY, Bartsch SM, Brown ST, et al. Quantifying the economic value and quality of life impact of earlier influenza vaccination. Med Care. 2015;53(3):218–229.
- Pike J, Grosse SD. Friction cost estimates of productivity costs in cost-of-illness studies in comparison with human capital estimates: a review. Appl Health Econ Health Policy. 2018;16(6):765–778.
- Molinari NAM, Ortega-Sanchez IR, Messonnier ML, et al. The annual impact of seasonal influenza in the US: measuring disease burden and costs. Vaccine. 2007;25(27):5086–5096.
- Swift A. Most US employed adults plan to work past retirement age. Washington (DC): Gallup; 2017.
- Padula WV, Connor KA, Mueller JM, et al. Cost benefit of comprehensive primary and preventive school-based health care. Am J Prev Med. 2018;54(1):80–86.
- Sullivan PW, Lawrence WF, Ghushchyan V. A national catalog of preference-based scores for chronic conditions in the United States. Med Care. 2005;43(7):736–749.
- Shaw JW, Johnson JA, Coons SJ. US valuation of the EQ-5D health states: development and testing of the D1 valuation model. Med Care. 2005;43(3):203–220.
- Hoerger TJ, Schillie S, Wittenborn JS, et al. Cost-effectiveness of hepatitis B vaccination in adults with diagnosed diabetes. Diabetes Care. 2013;36(1):63–69.
- Briggs AH. Handling uncertainty in cost-effectiveness models. PharmacoEconomics. 2000;17(5):479–500.
- Briggs AH, Goeree R, Blackhouse G, et al. Probabilistic analysis of cost-effectiveness models: choosing between treatment strategies for gastroesophageal reflux disease. Med Decis Making. 2002;22(4):290–308.
- Pandya A. Adding cost-effectiveness to define low-value care. JAMA. 2018;319(19):1977–1978.
- Sharma M, Ortendahl J, van der Ham E, et al. Cost-effectiveness of human papillomavirus vaccination and cervical cancer screening in Thailand. BJOG. 2012;119(2):166–176.
- 116th Congress. Coronavirus aid, relief and economic security (CARES) act. Washington, D.C.; 2020.
- Boccia R, Burke L, Burton D, et al. Congress should focus on pandemic control and fix the CARES act for an economic rebound. Washington: The Heritage Foundation; 2020.
- Canady VA. CARES act to help providers bolster care; supports communities, businesses. Mental Health Weekly. 2020;30(14):1–3.
- Cicchetti A, Ruggeri M, Gitto L, et al. Extending influenza vaccination to individuals aged 50–64: a budget impact analysis. Int J Technol Assess Health Care. 2010;26(3):288–293.
- Sloan FA, Becker ER. Cross-subsidies and payment for hospital care. J Health Polit Policy Law. 1984;8(4):660–685.
- Engelhardt GV, Gruber J. Medicare part D and the financial protection of the elderly. J Am Econ J: Econ Policy. 2011;3(4):77–102.
- Hurley LP, Lindley MC, Harpaz R, et al. Barriers to the use of herpes zoster vaccine. Ann Intern Med. 2010;152(9):555–560.
- Brennan H, Kapczynski A, Monahan CH, et al. A prescription for excessive drug pricing: leveraging government patent use for health. Yale J Law Technology. 2016;18(1):275–354.
- Sharfstein JM, Lee J, Conti RM. We have a cure for hepatitis C. But the neediest can’t afford it. Louisiana wants to change that. Washington (DC):Vox; 2017.
- James SF, Chahine EB, Sucher AJ, et al. Shingrix: the new adjuvanted recombinant herpes zoster vaccine. Ann Pharmacother. 2018;52(7):673–680.
- Eligon J, Burch ADS, Searcey D Jr, et al. Black Americans Face Alarming Rates of Coronavirus Infection in Some States. The New York Times. 2020 Apr 8.