
 ?Mathematical formulae have been encoded as MathML and are displayed in this HTML version using MathJax in order to improve their display. Uncheck the box to turn MathJax off. This feature requires Javascript. Click on a formula to zoom.
Abstract
Aim
Polatuzumab vedotin-bendamustin-rituximab (PBR) and tafasitamab-lenalidomide (Tafa-L) were approved recently for relapsed/refractory diffuse large B-cell lymphoma (R/R DLBCL) in autologous stem cell transplant (ASCT) ineligible patients. We performed an industry-independent pharmacoeconomic evaluation of both regimens over a 5-year (y) time horizon (US payer perspective; 2020 USD).
Methods
Survival curves, treatment costs, and utility values were applied in a three-state Markov model (progression-free survival (PFS), post-progression survival (PPS), death) to estimate the incremental follow-up (ICER) and cost-utility ratios (ICUR). A novel metric of the incremental cost per 1% gain in the probability of achieving objective response (OR), PFS, and OS were estimated.
Results
Five-year Tafa-L costs ($470,119) exceeded PBR’s ($249,217) by $220,902 with incremental gains of 0.71 life-years (LY) and 0.32 quality-adjusted life-years (QALY); yielding ICER of $310,041/LYg and ICUR of $694,241/QALYg. Tafa-L had favorable PFS and OS rates over PBR with adjusted differences of +19.2 and +34.1%, respectively at trial follow-up (∼2 years), with corresponding 5 years differences in survival of +7.8% in PFS and +21.4% in OS. The incremental cost per 1% gain in the probability of achieving OR, PFS and OS at follow-up were $8,479, $6,359, and $3,583; and $28,321 and $10,323 for PFS and OS at 5 years.
Conclusion
The sustained Tafa-L treatment demonstrated better survival outcomes than 6-cycle PBR though at a greater cost. The incremental costs to gain a 1% improvement in 2 and 5 years survival outcomes with Tafa-L over PBR were modest, underscoring the longer-term benefit of Tafa-L over PBR in patients ineligible for or opting out of ASCT.
PLAIN LANGUAGE SUMMARY
Two new medication regimens were approved recently for relapsed or refractory diffuse large B-cell lymphoma (R/R DLBCL): six cycles of polatuzumab vedotin-bendamustine-rituximab (PBR) and continuous twice-monthly treatment with tafasitamab-lenalidomide (Tafa-L). Both treatments are expensive, but Tafa-L more so because it requires continuous treatment versus the maximum 6 cycles of PBR. However, Tafa-L may have better progression-free (PFS) and overall survival (OS) outcomes. Is this worth the additional money?
We conducted a cost-effectiveness analysis comparing Tafa-L to PBR. After calculating the differenced in costs and the progression-free and overall survival, we determined the additional cost to gain a life year (LY) or quality-adjusted life year (QALY) over 5 years. We also introduced a novel metric: how much it would cost extra to gain, with Tafa-L treatment, an improvement in progression-free or overall survival of 1% over the survival afforded by PBR. Treatment with Tafa-L over PBR would cost an extra $220,902 for a gain of 0.71 life years (standardized, $310,041/LYgained) and 0.32 quality-adjusted life years ($694,241/QALYgained). Importantly, two years of Tafa-L treatment increased the likelihood of progression-free survival by +19.2% and overall survival by 34.1% over PBR; extending to +7.8% in progression-free survival and +21.4% in overall survival at five years. It cost an additional $28,321 per 1% gain in likelihood in progression-free survival and $10,323 per 1% gain in overall survival after 5 years. Summarized, the increased costs of Tafa-L translate into significantly better progression-free and overall survival.
Introduction
With more than 18,000 people diagnosed in the United States each year, diffuse large B-cell lymphoma (DLBCL) is the most common type of non-Hodgkin lymphomaCitation1. Between 2013 and 2017 the age-adjusted rate of new cases and deaths were 5.6 and 1.8, respectively per 100,000 men and womenCitation2. Following the introduction of the CHOP (cyclophosphamide, adriamycin, vincristine, and prednisone) regimen and later the addition of rituximab as the standard treatment, DLBCL prognosis has substantially improved, raising the 5-year survival rate from 43% in the mid-1990s to 63% between 2010 and 2016Citation2,Citation3. Despite this progress, up to half of DLBCL patients eventually relapse or become refractory to treatment after achieving complete responseCitation4. Even those who respond to subsequent salvage therapy and are eligible for autologous stem cell transplantation, still have a poor prognosis, especially those with risk factors, leaving them with no curative optionsCitation4. If left untreated, relapsed, or refractory (R/R) DLBCL patients have a life expectancy of 3–4 monthsCitation5.
The current standard treatment for this patient population is salvage platinum-based chemotherapy followed by high dose chemotherapy and autologous stem-cell transplantation (ASCT)Citation5–7. However, considering the median age of 66 years, more than 60% of R/R DLBCL patients may not meet ASCT eligibilityCitation8,Citation9 in terms of successful completion of salvage chemotherapy, medical fitness, comorbidities, performance status, and patient preferenceCitation2,Citation6,Citation9. There remains an unmet need for a standard of careCitation10,Citation11.
Two recent regulatory approvals offer treatment options for R/R DLBCL patients who are ASCT-ineligibleCitation12,Citation13. Polatuzumab vedotin (Polivy, Genentech, South San Francisco, CA, USA) in combination with bendamustine and rituximab (PBR) is a regimen of six cycles that were evaluated in the G029365 trial vs. bendamustine and rituximab aloneCitation14. PBR showed improved median progression-free survival (PFS) of 9.5 vs. 3.7 months and overall survival (OS) of 12.4 vs. 4.7 months. Its safety profile included grade 3/4 adverse event rates of 46.2% for neutropenia, 10.3% for febrile neutropenia, 28.2% for anemia, and 41% for thrombocytopenia. In the L-MIND trial, the combination of tafasitamab (Monjuvi, Morphosys, Planegg, Germany) and lenalidomide (Tafa-L) was assessed for efficacy and safety in a single-arm study designCitation15. This regimen consists of the concomitant administration of tafasitamab and lenalidomide for up to 12 cycles, followed by monotherapy of tafasitamab until disease progression or death. Tafa-L had a median PFS of 12.1 months and had not reached median OS at a median follow-up of 19.5 months. Grade 3/4 adverse event rates were 48% for neutropenia, 12% for febrile neutropenia, 7% for anemia, and 17% for thrombocytopenia.
We performed an industry-independent comparative pharmacoeconomic evaluation of longer-term treatment with the Tafa-L regimen vs. the six-cycle PBR regimen in transplant-ineligible R/R DLBCL patients in terms of the incremental costs associated with any gains in PFS and OS life years (LY) and quality-adjusted LY (QALY). We also introduce three new metrics: the incremental cost per 1% gain in the probability of achieving objective response (OR), PFS, and OS (and, related to the latter, its inverse of avoiding death) by treating with Tafa-L over the probabilities achieved with PBR.
Methods
In the absence of a head-to-head trial of PBR vs. Tafa-L, and considering that L-MIND was a single-arm trial, an adjusted indirect comparison with a common comparator was not possible. Hence this cost-effectiveness analysis was performed based on a naïve comparison of the Tafa-L data in the L-MIND trial to the PBR regimen in the G029365 trialCitation16. Patient characteristics and treatment procedures were summarized, and outcome and safety data were extracted from the respective studies. Treatment procedures and safety data were utilized to set treatment and adverse event (AE) management costs.
Patient population
Baseline characteristics as reported in the respective trials () were generally balanced between both trial populations, except that there were proportionately more men in the G029365 trial and that, despite medians being equal, proportionately fewer patients had one prior line of therapy and more had >3 prior lines of treatment compared to the patients in the L-MIND trial.
Table 1. Patient characteristics.
Treatment procedures
In G029365, the PBR regimen consisted of co-administration of polatuzumab vedotin, bendamustine, and rituximab for up to 6 cycles of 21 days eachCitation14. Polatuzumab vedotin was administered intravenously (IV) in a dose of 1.8 mg/kg on day 2 of cycle 1 and day 1 of subsequent cycles. Bendamustine was administered IV in a dose of 90 mg/m2 on days 2 and 3 of cycle 1 and day 1 and 2 of subsequent cycles for a total of two administrations per cycle. Rituximab was administered IV in a dose of 375 mg/m2 on day 1 of each cycle. Premedication included acetaminophen, ondansetron, dexamethasone, and diphenhydramine.
In L-Mind, the Tafa-L regimen was comprised of tafasitamab and lenalidomide co-administration for up to 12 cycles of 28 days eachCitation15. After 12 cycles lenalidomide was discontinued and tafasitamab monotherapy was continued until disease progression. For the first three cycles, a weekly dose of 12 mg/kg of tafasitamab was administered IV, with an additional loading dose on day 4 of cycle 1 for a total of five administrations in cycles 1 and 4 in cycles 2 and 3. From cycle 4, tafasitamab was administered once every 14 days for a total of two administrations per cycle. Patients self-administered oral lenalidomide at a dose of 25 mg/day on days 1–21 of each 28-day cycle and this for 12 cycles. Premedication included diphenhydramine, acetaminophen, famotidine, dexamethasone, and aspirin. Compazine was administered PRN for nausea and vomiting.
Model structure
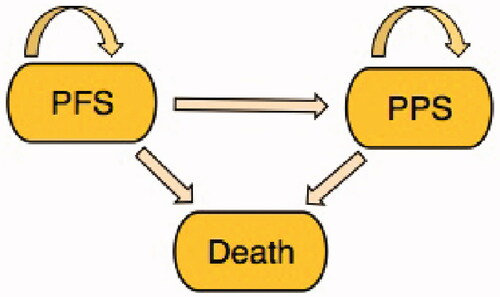
A Markov model with three health-states [PFS, Post-Progression survival (PPS), Death], and one-month cycles was specified over a 5-year time horizon (). All patients start in the PFS state. In each subsequent cycle, they may stay in this state or transition to PPS or Death. When in PPS, they may stay in this state or transition to Death. This is repeated to the time horizon or death.
Figure 1. Markov health states and transitions. Patients start in the progression-free survival (PFS) state. From here each patient can remain in the PFS state or transition to post-progression survival (PPS) and death states in each monthly cycle. Patients in PPS state and can subsequently stay in the PPS state or transition to the death state.
To determine transition probabilities expressed as a function of time, the Kaplan-Meier curves of both studies were digitized using R StudioCitation17. The independent review committee (IRC) curves from the G029365 were used for PBR. The L-MIND trial did not include IRC Kaplan–Meier curves for Tafa-L, therefore investigator curves were used instead.
Data were extracted and the fit to four parametric functions (exponential, Weibull, loglogistic, and lognormal) was evaluated using Akaike's Information Criteria (AIC) and Bayesian Information Criteria (BIC) along with the visual inspection. Applying the best-fitting function, the curves were extrapolated for a 5-year timeline. Transition probabilities were estimated from the fitted PFS and OS curves. PFS and OS curves for each treatment were applied to estimate the incremental cost-effectiveness (ICER) and cost-utility ratios (ICUR). Additionally, three novel metrics were estimated: the incremental cost per 1% gain in the probability of achieving OR, PFS, and OS within the time horizon in the analysis by one treatment (Tafa-L) over another treatment (PBR). The inverse of the latter also represents the incremental cost per 1% gain in the probability of averting death within the time horizon. Model inputs for all parameters were adjusted for 1-month cycles.
Assumptions and model settings
The following assumptions governed our economic evaluation:
The analyses are from the US payer perspective.
Only severe grade 3/4 AE occurring in at least 10% of a treatment arm were included for AE disutility and AE management costs.
Visual inspection of the parametric functions to the PFS and OS curves was secondary to statistical metrics for evaluating goodness-of-fit.
Where deterministic and probabilistic results differed by more than 10%, we considered mainly the probabilistic results to better account for the uncertainty in the base-case results.
The following model settings governed our economic evaluation:
Cost estimates are expressed in 2020 US dollars ($).
As there was no published Average Sales Price for tafasitamab as of 31 December 2020, all medication-related cost inputs were based on the Wholesale Acquisition Cost.
All costs were converted to monthly costs as trials differed in treatment cycle time.
A month was set to be 30.5 days.
Utility values were adjusted for AE disutility. Adjusted utility values were applied during active treatment and a 1-month wash-out period.
AE management costs were accounted for during active treatment and a 1-month wash-out period.
Upper and lower range values were fixed with the following coefficients:
Total treatment costs: 0.7–1.1
AE management costs: from literature
Utility values: 0.94–1.06
We applied a constraint to assure that PFS utilities exceeded PPS utilities.
Model inputs
As detailed in , the model inputs included the costs of the Tafa-L and PBR treatments, premedication, medication administration, physician fees, laboratory tests; costs of managing grade 3/4 AE with prevalence >10%; and the AE disutility and the PFS and PPS utility values for each treatment arm (Tables S1–S4). All medication costs were obtained using RedBookCitation18. Administration costs and physician fees were obtained from the Centers for Medicare & Medicaid Services (CMS)Citation19, and laboratory test costs were acquired from Quest DiagnosticsCitation20. Costs of AE management were obtained from literature, were measured from a US payers’ perspective, and were defined as the sum of pharmacy and medical service costs (including inpatient, durable medical equipment, emergency room, and outpatient costs)Citation21,Citation22. All values used to determine model inputs are detailed in Tables S1–S5.
Table 2. Model inputs and curve parameters.
The AE management costs per treatment arm were calculated by multiplying and summing the proportion of patients experiencing each AE and the respective average costs per AE during active treatment and an additional one-month wash-out period. (Dis)utility values were sourced from the Tufts Cost-Effectiveness Analysis (CEA) RegistryCitation23, and from literature for the proportion accounted for by lenalidomide disutility in Tafa-L to adjust for lenalidomide discontinuationCitation24,Citation25. Costs and utilities were discounted by 3.5% per year after one year. Treatment costs were adjusted per cycle (as cycle costs varied over time), converted to monthly costs, and applied only in the PFS state. As necessary, costs were inflation-adjusted to 2020 US dollars using Medical CPI calculatorCitation26.
Incremental cost-effectiveness ratio (ICER) and increment cost-utility ratio (ICUR)
In the base-case analyses we estimated the ICER as the incremental cost per LY gained (LYg) and the ICUR as the incremental cost per QALY gained (QALYg). To determine the uncertainty in deterministic estimates, we performed probabilistic and deterministic sensitivity analyses (PSA and DSA). The PSA was done by performing 10,000 Monte Carlo simulations using the distributions for all model inputs at once. The DSA was done by performing 1-way sensitivity analyses for each model input separately. The DSA estimates the impact of uncertainty of all model inputs, by assessing the impact on the ICUR using the minimum and maximum value for the respective model inputs.
ICER to gain 1% in probability of achieving OR
The ICER for Objective Response (OR) was defined as the incremental cost required for a 1% gain in the probability of achieving OR at the trial follow-up time with Tafa-L vs. the baseline of PBR; or
where Tafa-L refers to tafasitamab + lenalidomide, PBR to polatuzumab + bendamustine + rituximab and t to time. This metric may be interpreted as the additional cost associated with Tafa-L over PBR treatment to increase a patient’s probability of achieving OR by 1% OR. As follow-up times were not equal (26 for Tafa-L vs. 25 months for PBR), the differences in values for costs and survival outcomes were adjusted to the difference in time by multiplying the values by the proportion difference in time; or
where X refers to the cost or outcome of interest.
ICER to gain 1% in probability in PFS and OS
Following plotting of the trial PFS and OS curves up to 2 years and the corresponding curves extrapolated to 5 years, we similarly estimated the incremental cost required for a 1% gain in the probability of achieving the PFS state at 2 and 5 years and the OS state at 2 and 5 years with Tafa-L over PBR treatment; that is
where survival refers to PFS or OS, t to the time point, and Tafa-L and PBR to the treatments as defined above. This metric may be interpreted as the additional cost associated with Tafa-L over PBR treatment to increase a patient’s probability of PFS or OS by 1% at time point t over the baseline PFS and OS estimated for PBR. Note that for OS the equation also implies a 1% increase in the probability of death averted.
Results
ICER and ICUR
As detailed in , over a five-year horizon treatment Tafa-L costs exceeded PBR costs by $220,902, however, Tafa-L was also associated with a gain of 0.71 LY and 0.32 QALY; yielding an ICER of $310,041/LYg and an ICUR of $694,241/QALYg. In the PSA the ICER for Tafa-L over PBR was $276,772/LYg and the ICUR was $586,925/QALYg (). The PSA for LYs showed all but one possible outcome having higher costs for Tafa-L and 97% of the outcomes having a gain in LYs for Tafa-L over PBR (). In the PSA for QALYs, Tafa-L had higher costs in all outcomes and 95% of the outcomes had a gain in QALYs over PBR (). The cost-effectiveness acceptability curves showed that Tafa-L has a 50% probability of being cost-effective at a willingness-to-pay threshold of $276,596/LYg () and $590,993/QALYg (). The deterministic 1-way sensitivity analyses indicated that the PFS utility value of Tafa-L followed by PBR treatment costs and the PFS utility value of R/R DLBCL had the most influence on the ICUR, while AE management costs for Tafa-L and PBR showed the least influence on the ICUR ().
Figure 2. Cost-effectiveness plane for LYs. All results of the 10,000 Monte-Carlo simulations for Lys. where 97% of all outcomes were in the upper right quadrant, standing for an increase in Life-Years gained (LYg) over an increase in costs.
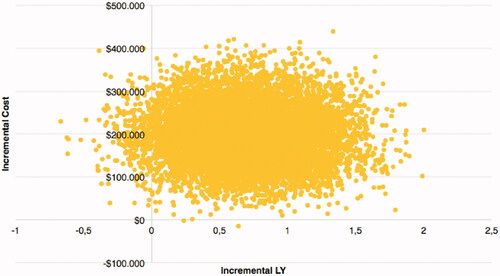
Figure 3. Cost-effectiveness plane for QALYs. All results of the 10,000 Monte-Carlo simulations for QALYs. 95% of all outcomes were in the upper right quadrant, standing for an increase in LYg over an increase in costs.
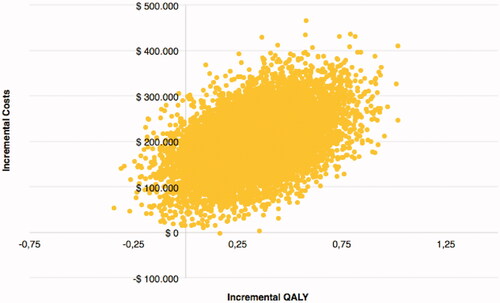
Figure 4. Cost-effectiveness acceptability curve for LYs. Tafa-L has a 50% probability of being cost-effective at a willingness-to-pay threshold of $276,596/LYg.
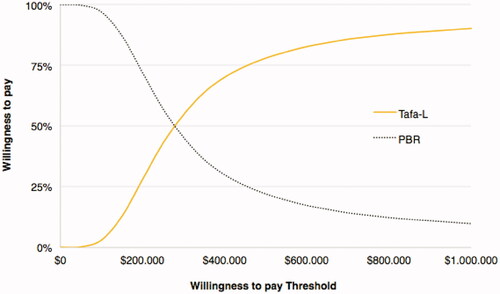
Figure 5. Cost-effectiveness acceptability curve for QALYs. Tafa-L has a 50% probability of being cost-effective at a willingness-to-pay threshold of $590,993/QALYg.
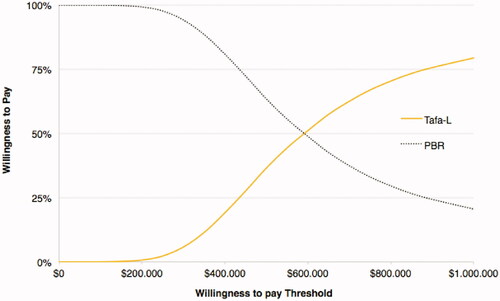
Figure 6. Tornado plot. The deterministic 1-way sensitivity analyses illustrate the impact on the ICUR by modifying model input variables to their maximum and minimum values. Variables are ranked from most (PFS Utility Tafa-L) to least (AE Management Costs, Tafa-L, Subsequent cycles) influential on ICUR.
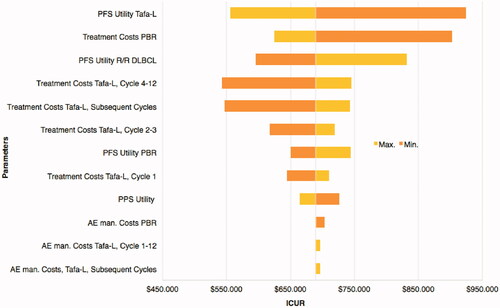
Table 3. BCA and PSA results for ICER per LY gained, ICUR per QALY gained, Incremental cost per 1% gain in the probability of achieving OR, PFS, and OS.
ICER to gain 1% in probability of achieving OR
In the base-case analyses for OR, Tafa-L costs $132,275 more than PBR for an increase of 14.4% in OR at follow-up time (). The ICER for OR for Tafa-L over PBR was $8,479 per 1% gain in the probability of achieving OR at follow-up time.
ICER to gain 1% in probability in PFS and OS
Tafa-L had a favorable outcome in LYs and QALYs gained in both PFS and OS at follow-up as well as at five years (). Tafa-L had an adjusted difference of 19.2% in PFS vs. PBR at follow-up, and 7.8% at 5 years (). The incremental cost per patient to gain 1% probability of being in PFS at follow-up was $6,359 and $28,321 at five years. The adjusted difference in OS of Tafa-L over PBR was 34.1% at follow-up and 21.4% at five years. The incremental cost per patient to gain 1% of probability to be in OS at follow-up was $3,583 and $10,323 at five years. Stated alternatively, this also the incremental costs to gain 1% of probability of averting death with Tafa-L over PBR at follow-up.
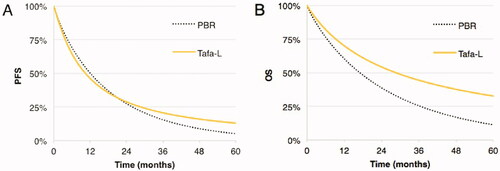
Figure 7. Survival curves for (A) PFS and (B) OS. The proportion of patients in PFS at 60 months was 13% for Tafa-L vs. 5.2% for PBR. The proportion of patients in OS at 60 months was 32.7% for Tafa-L vs. 11.3% for PBR.
Discussion
Summarized, the principal findings of this independent economic evaluation of PBR and Tafa-L in transplant-ineligible R/R DLBCL are 4-fold. First, when applying “classical” methods of pharmacoeconomic evaluation and focusing on the probabilistic estimates, the higher costs, the better PFS and OS outcomes, and the favorable safety profile of Tafa-L over PBR translated in incremental costs of $276,772 per LY and $586,925 per QALY gained. Tafa-L had a 50% probability of being cost-effective at a willingness-to-pay threshold of $276,596 per LYg and $590,993 per QALYg. Second, using the OR of 45% for PBR as a base, the incremental cost to gain 1% in the probability of achieving OR with Tafa-L at trial follow-up time was $8,479. Third, and perhaps more applicable as a pharmacoeconomic metric when evaluating sustained treatments like Tafa-L, we used the 2-year PFS and OS rates for patients receiving Tafa-L (38 and 63%, respectively) and the corresponding rates for patients treated with PBR (18 and 27.5%, respectively) to estimate the incremental cost associated with Tafa-L treatment yielding a 1% increase in OS and PFS over the PBR base rate. The additional costs for a 1% increase in the probability of achieving OS and PFS at 2 years were $3,583 and $6,359, respectively. Fourth, we also used the estimated 5-year PFS and OS rates for patients receiving Tafa-L (13 and 32.7%, respectively) and those administered PBR (5.2 and 11.3%, respectively) to determine the incremental cost to gain a 1% increase in these rates over the PBR base. An additional 1% gain in OS and PFS was estimated to cost an incremental $10,323 and $28,321, respectively, at 5 years. The ICER for OS was $3,583 per 1% gain in the probability of being alive at follow-up and $10,323 per 1% gain at five years. Lastly, and clinically important, the estimated proportion of patients in PFS at 60 months was 13% for Tafa-L, which was 2.5-fold the corresponding proportion of 5.2% for PBR. Similarly, the estimated proportion of patients alive at 60 months was 32.7% for Tafa-L or 2.9-fold that for PBR. Note that the proportion of PBR-treated patients alive at 60 months was inferior to the proportion of Tafa-L treated patients in PFS at 60 months.
Both the scope and the findings of this economic evaluation must be interpreted within the context of the profound changes in cancer therapy, especially in late-stage disease where previously few options were available but where now encouraging treatment options are emerging. A case in point is the treatment for transplant-ineligible DLBCL patients, including those who do not qualify for cell treatment—the population of concern in the present pharmacoeconomic comparison of PBR and Tafa-L. PBR may be more conventional in its treatment paradigm as it is administered over 6 cycles 18 weeks apart. In contrast, Tafa-L is a continuous treatment, which after an initial one-year initiation period, requires twice-monthly infusions. Perhaps unsurprisingly, this comes at a markedly higher cost of treatment. Yet, our extrapolations against a 5-year time horizon showed that such sustained Tafa-L therapy had decidedly better PFS and OS outcomes over PBR.
Further, our economic evaluation points at both a dilemma (cost over the outcome or outcome over cost?) and the inherent limitations of “classical” pharmacoeconomic analysis focused on the ratio of the incremental cost of one treatment over another to the incremental gain in the outcome. Admittedly our own opinion, this is especially evident in utility-adjusted analyses in which standardized population-level parameters of the relative loss of quality of life are applied normatively to any patient and are not reflective, at the patient-level, of patient choice and clinician advice in the shared decision-making process. In other words, in advanced cancer, quality of life is a highly personal decision, made in good part at the point of care, is situational and fluid rather than predetermined and fixed, and in which the desire for (as) perfect health (as possible) is superseded by the ad hoc trade-offs of the outcome, safety, and personal choice.
Economic (not clinical) constructs, such as the ICUR (here, the incremental cost per incremental gain in QALY) have the benefit of being generic and therefore (theoretically) enable comparisons to other diseases and treatments. Conversely, the ICER (here, the incremental cost per incremental gain in actual life year) may be closer to the clinical reality. Both ICUR and ICER are constrained by the primary focus on cost (i.e. the numerator) as opposed to benefit.
As both are established methods of “classical” pharmacoeconomic analysis, we included these metrics in our analyses. However, we also aimed to complement and extend them with metrics that are less influenced by “upfront-and-then-none” cost structures (PBR) and instead consider the marginal lifetime gains achieved, by necessity because of the treatment regimen, under “sustained-spread-across” cost structures—hence our novel metrics of the incremental cost per 1% gain in PFS or OS with Tafa-L treatment over the base PFS or OS provided by PBR treatment. In addition, and perhaps counter to our argument to emphasize the longitudinal over the short term, we also estimated the incremental cost to achieve a 1% gain in the probability of OR within the (non-extrapolated) time frame of the comparison.
The proposed novel metric (incremental $per 1% differential outcome) provides a cost-to-outcome ratio that is specific to a given survival outcome (here PFS and OS) and where each outcome is analyzed separately—something the ICER and ICUR are not in that the QALY is derived from the LY. The metric is on a gradient (percent) and takes into account the distribution of improvement afforded by one treatment over another treatment, thus recognizing that patients may differ in their degree of response to treatment. Being expressed as a gradient supersedes the dichotomy of “improved vs. not by x”. Clinically, the metric is focused on “hard” outcomes expressed in LY differentials, and thus aligned with predominant thinking in the cancer setting on net survival benefits expressed in natural units (years, months, …), as also argued below. This allows for a more comprehensive assessment of the prospect of a treatment course when considering treatment options to present to a patient. Thus the proposed metric complements the conventional metrics used in pharmacoeconomic evaluations, notably the ICER and the ICUR.
Specifically, the value of the proposed new metric is 5-fold. First, it provides a complement to existing metrics that are relatively insensitive to differences in duration of treatment, as in the case of 6 cycles of the PBR regimen vs. sustained treatment with Tafa-L. Second, the metric is not inherently dependent on willingness-to-pay thresholds—though, conceivably such thresholds could be considered. Third, it places the incremental effect of one treatment on a percentual gradient that starts with the effect of the comparator by estimating the incremental cost per 1% gain in effect over the effect of the lesser comparator. Fourth, the metric is applicable to budget impact analyses. This provides payers as well as providers with a metric to estimate the budget impact of adding a better treatment to the treatment mix as a function of the cost over a lesser treatment when resources are constrained and budgets do not permit, at a given point in time, that the treatment is made available to all eligible patients. Fifth, the 1% gain metric has the potential to serve as a measure of relative affordability, especially in cases where the cost-effectiveness and cost-utility metrics exceed the (pre-)specified WTP thresholds.
We have refrained from making statements about cost-effectiveness against fixed willingness-to-pay (WTP) thresholds for several reasons. The purpose of economic evaluation is to provide an independent empirical base to inform policy, not to set policy. The empirical base for WTP thresholds is limited. The $50,000 per QALY threshold, though widely advocated, is an “arbitrary rule of thumb” and “convenient round number”Citation27 with “murky origins”Citation28 that “developed into a folk tradition”Citation27 if not “urban legend”Citation29 and has left “experts unclear as to how the practice emerged and spread”Citation27—except that it is the value of a life year enshrined in the 1973 Medicare expansion for end-stage renal diseaseCitation30. Adjusted for general (not even medical inflation), the $50,000 value would now be $292,439/LYg. From their (empirical) re-estimation, Braithwaithe et al.Citation31 proposed a plausible range of $95,000/LYg to $264,000/LYg (USD 2003); or an inflation-adjusted $133,848/LYg to $371,956/LYg.
Strengths
This cost-effectiveness analysis compares two treatments to estimate survival by conversion of real patient data. Through this conversion, estimations can be made for an extrapolated timeline for up to 5 years; including sub-analyses for shorter timelines as shown for instance in the incremental cost for additional OR and patients gained in PFS and OS at study follow-up time. Cost parameters were comprehensive and included the costs of treatment, premedication, AE management, administration, physician fees, laboratory test fees as well as utility values adjusted for treatment AE. The model allowed changing these parameters overtime throughout the 5-year extrapolation according to changes in treatment arms, resulting in accurate estimates of total costs. Importantly, in addition to conventional metrics, like the ICER and ICER, novel alternative metrics were determined. This allows for an expansion of classical methods used for comparison between treatment arms.
Limitations
In the absence of head-to-head trials comparing the two regimens of interest, and there not being two-arm trials with a common comparator, we had to resort to a naïve indirect treatment comparison. This is becoming increasingly necessary and common in hematological malignancies, such as R/R DLBCL. The population size of both studies, especially PBR, was small. Small population sizes enhance the uncertainty of the trial results and subsequently that of the fitted survival curves. The median prior lines of treatments were equal, although a smaller proportion of Tafa-L patients had received three or more prior lines of treatment and a larger proportion of Tafa-L had only received only one prior line of treatment compared to the PBR arm. The disproportion could lead to an overestimation of Tafa-L. Curve fitting of the Kaplan-Meier plots of the respective trials was performed by selecting the best fitting out of four curve type variants (exponential, Weibull, lognormal and loglogistic), yet the trial Kaplan-Meier curves showed flattening towards the end of the study timelines that may not have been fully captured by the parametric function that was applied. This may have caused some inaccuracy of the curves used for extrapolation at the tail ends of the time frames. For PBR this meant a small overestimation in PFS and OS survival, while for Tafa-L it translated into a minor underestimation in PFS and OS survival. Taken together, this could result in an underestimation of the survival advantages of Tafa-L over PBR. No PPS costs were implemented in the model because cost parameters of R/R patients in post-progression are hard to identify, as there may not be a specific alternative next line treatment after PBR and Tafa-L. Although this limitation applies to both treatment arms, the effect may be more prevalent in the PBR group. Tafa-L had superior PFS over PBR; therefore, comparatively more PBR patients may have migrated on to the next line of treatment line, which may entail different and additional treatment and adverse event costs. The incremental costs associated with next-line treatment for progressed PBR patients while Tafa-L patients are still on their treatment are not taken into account, and only the PFS-related costs of Tafa-L are accounted for in the model. This may result in an overestimation of the incremental costs of Tafa-L.
Conclusion
Considering that economic evaluations are intended to inform (but not set) policy, this industry-independent analysis demonstrated that sustained Tafa-L treatment is associated with better survival outcomes than PBR though at a greater cost. The incremental costs to gain a 1% improvement in 2- and 5-year survival outcomes with Tafa-L over PBR were modest, underscoring the longer-term benefit of Tafa-L over PBR in R/R DLBCL patients ineligible for or opting out of ASCT.
Transparency
Declaration of funding
This economic evaluation was performed independently without external funding.
Declaration of financial/other relationships
M.C. declares that he has no conflict of interest. A.M. declares that he has no conflict of interest.
I.A. is a joint-equity owner in Matrix45, LLC. By company policy, owners and employees are prohibited from owning equity in client and sponsor organizations (except through mutual funds or other independently administered collective investment instruments), contracting independently with client and sponsor organizations, or receiving compensation independently from such organizations. Matrix45 provides similar services to other biopharmaceutical, diagnostics, and medical device companies on a non-exclusivity basis. Matrix45 was contracted by Morphosys (tafasitamab) for a staff-training program in pharmacoeconomics that was delivered mainly by I.A. In the past, Matrix45 has provided scientific consulting and research support services to Roche (polatuzumab vedotin), but not on the product of interest in this study. It has no active contracts with Roche at this time. Matrix45 has not provided any services to the study reported herein and all work was done under I.A.’s faculty position at the University of Arizona.
Peer reviewers on this manuscript have no relevant financial or other relationships to disclose.
Author contributions
M.C., A.M., and I.A.: acquisition, analysis, or interpretation of data. M.C. and I.A.: drafting of the manuscript. All authors: critical review of the manuscript for important intellectual content. M.C. and I.A.: statistical analysis. A.M. and I.A.: administrative, technical, or material support. I.A.: supervision.
Ethical approval
This article does not contain any studies with human participants or animals performed by any of the authors.
Supplemental Material
Download MP4 Video (159.9 MB)Supplemental Material
Download MS Word (47.1 KB)Acknowledgements
The authors thank A. Mantel-Teeuwisse (Utrecht University) for her review of, and comments on, a prior version of this paper.
Data availability statement
To request original data please contact [email protected].
Related Research Data
References
- Lymphoma Research Foundation. Diffuse large B-cell lymphoma: treatment options [Internet]. [cited 2021 Jan 9]. Available from: https://lymphoma.org/aboutlymphoma/nhl/dlbcl/dlbcltreatment/
- NIH National Cancer Institute. Cancer stat facts: NHL – diffuse large B-cell lymphoma (DLBCL) [Internet]. [cited 2021 Jan 8]. Available from: https://seer.cancer.gov/statfacts/html/dlbcl.html
- American Cancer Society. Survival rates and factors that affect prognosis (outlook) for non-Hodgkin lymphoma [Internet]. [cited 2021 Jan 08]. Available from: https://www.cancer.org/cancer/non-hodgkin-lymphoma/detection-diagnosis-staging/factors-prognosis.html
- Crump M, Neelapu SS, Farooq U, et al. Outcomes in refractory diffuse large B-cell lymphoma: results from the international SCHOLAR-1 study. Blood. 2017;130(16):1800–1808.
- Raut LS, et al. Management of relapsed-refractory diffuse large B cell lymphoma South Asian. J Cancer. 2014;3(1):66–70.
- Liu Y, Barta SK. Diffuse large B-cell lymphoma: 2019 update on diagnosis, risk stratification, and treatment. Am J Hematol. 2019;94(5):604–616.
- Gisselbrecht C, Glass B, Mounier N, et al. Salvage regimens with autologous transplantation for relapsed large B-cell lymphoma in the rituximab era. J Clin Oncol. 2010;28(27):4184–4190.
- Sarkozy C, Sehn LH. Management of relapsed/refractory DLBCL. Best Pract Res Clin Haematol. 2018;31(3):209–216.
- Hitz F, Connors JM, Gascoyne RD, et al. Outcome of patients with primary refractory diffuse large B cell lymphoma after R-CHOP treatment. Ann Hematol. 2015;94(11):1839–1843.
- Skrabek P, Assouline S, Christofides A, et al. Emerging therapies for the treatment of relapsed or refractory diffuse large B cell lymphoma. Curr Oncol. 2019;26(4):253–265.
- Thuresson P-O, Vander Velde N, Gupta P, et al. A systematic review of the clinical efficacy of treatments in relapsed or refractory diffuse large B cell lymphoma. Adv Ther. 2020;37(12):4877–4893.
- FDA. FDA approves polatuzumab vedotin-piiq for diffuse large B-cell lymphoma [Internet]. [cited 2021 Jan 7]. Available from: https://www.fda.gov/drugs/resources-information-approved-drugs/fda-approves-polatuzumab-vedotin-piiq-diffuse-large-b-cell-lymphoma
- FDA. FDA grants accelerated approval to tafasitamab-cxix for diffuse large B-cell lymphoma [Internet]. [cited 2021 Jan 5]. Available from: https://www.fda.gov/drugs/drug-approvals-and-databases/fda-grants-accelerated-approval-tafasitamab-cxix-diffuse-large-b-cell-lymphoma
- Sehn LH, Herrera AF, Flowers CR, et al. Polatuzumab vedotin in relapsed or refractory diffuse large B-Cell lymphoma. J Clin Oncol. 2020;38(2):155–165.
- Salles G, Duell J, González Barca E, et al. Tafasitamab plus lenalidomide in RR DLBCL (L-MIND). Lancet Oncol. 2020;21(7):978–988.
- Kim H, Gurrin L, Ademi Z, et al. Overview of methods for comparing the efficacies of drugs in the absence of head-to-head clinical trial data. Br J Clin Pharmacol. 2014;77(1):116–121.
- R Studio. Boston (MA): PBC.
- Redbook [Internet]. [cited 2020 Oct–Nov]. Available through the University of Arizona Library from: https://www.micromedexsolutions.com.ezproxy4.library.arizona.edu/micromedex2/librarian/ssl/true
- CMS. Physician fee schedule search [Internet]. [cited 2020 Oct]. Available from: https://www.cms.gov/Medicare/Medicare-Fee-for-Service-Payment/PhysicianFeeSched
- Quest Diagnostics. All available tests [Internet]. [cited 2020 Nov]. Available from: https://questdirect.questdiagnostics.com/products?category=All
- Wong W, Yim YM, Kim A, et al. Assessment of costs associated with adverse events in patients with cancer. PLOS One. 2018;13(4):e0196007.
- Zhand X, et al. Economic burden associated with adverse events of special interest in patients with relapsed Philadelphia chromosome-negative B-cell acute lymphoblastic leukemia in the United States. Expert Rev Pharmacoecon Outcomes Res. 2018;18(5):573–580.
- CEA Registry. Center for the evaluation of value and risk in health [Internet]. [cited 2020 Oct 27]. Available from: http://healtheconomicsdev.tuftsmedicalcenter.org/cear2/search/search.aspx
- Chen C, Reece DE, Siegel D, et al. Expanded safety experience with lenalidomide plus dexamethasone in relapsed or refractory multiple myeloma. Br J Haematol. 2009;146(2):164–170.
- Dimopoulos M, Spencer A, Attal M, et al. Lenalidomide plus dexamethasone for relapsed or refractory multiple myeloma. N Engl J Med. 2007;357(21):2123–2132.
- United States Department of Labour. BLS Data Labs, inpatient hospital services in U.S [Internet]. [cited 2020 Nov 28]. Available from: https://beta.bls.gov/dataViewer/view/timeseries/CUUR0000SS5702
- Grosse SD. Assessing cost-effectiveness in healthcare: history of the $50,000 per QALY threshold. Expert Rev Pharmacoecon Outcomes Res. 2008;8(2):165–178.
- Neumann PJ. Using cost–effectiveness. Analysis to improve health care. New York (NY): Oxford University Press; 2005.
- Neumann PJ, Cohen JT, Weinstein MC, et al. Updating cost-effectiveness-the curious resilience of the $50,000-per-QALY threshold. N Engl J Med. 2014;371(9):796–797.
- Klarman HE, et al. Cost effectiveness analysis applied to the treatment of chronic renal disease. Med Care. 1968;6(1):48–54.
- Braithwaite RS, Meltzer DO, King JT, et al. What does the value of modern medicine say about the $50,000 per quality-adjusted life-year decision rule. Med Care. 2008;46(4):349–356.