
 ?Mathematical formulae have been encoded as MathML and are displayed in this HTML version using MathJax in order to improve their display. Uncheck the box to turn MathJax off. This feature requires Javascript. Click on a formula to zoom.
Abstract
Background and Aims
The growing burden of diabetes mellitus and recent progress in understanding cardiovascular outcomes for type 2 diabetes (T2D) patients continue to make the disease a priority for healthcare decision-makers around the world. Our objective was to develop a new, product-independent model capable of projecting long-term clinical and cost outcomes for populations with T2D to support health economic evaluation.
Methods
Following a systematic literature review to identify longitudinal study data, existing T2D models and risk formulae for T2D populations, a model was developed (the PRIME Type 2 Diabetes Model [PRIME T2D Model]) in line with good practice guidelines to simulate disease progression, diabetes-related complications and mortality. The model runs as a patient-level simulation and is capable of simulating treatment algorithms and risk factor progression, and projecting the cumulative incidence of macrovascular and microvascular complications as well as hypoglycemic events. The PRIME T2D Model can report clinical outcomes, quality-adjusted life expectancy, direct and indirect costs, along with standard measures of cost-effectiveness and is capable of probabilistic sensitivity analysis. Several approaches novel to T2D modeling were utilized, such as combining risk formulae using a weighted model averaging approach that takes into account patient characteristics to evaluate complication risk.
Results
Validation analyses comparing modeled outcomes with published studies demonstrated that the PRIME T2D Model projects long-term patient outcomes consistent with those reported for a number of long-term studies, including cardiovascular outcomes trials. All root mean squared deviation (RMSD) values for internal validations (against published studies used to develop the model) were 1.1% or less and all external validation RMSDs were 3.7% or less.
Conclusions
The PRIME T2D Model is a product-independent analysis tool that is available online and offers new approaches to long-standing challenges in diabetes modeling and may become a useful tool for informing healthcare policy.
The PRIME Type 2 Diabetes (T2D) Model is a new, product-independent simulation model.
The model offers new approaches to long-standing challenges in diabetes modeling.
PRIME T2D Model projects outcomes consistent with those from clinical trials.
The model is designed to be a useful tool for informing healthcare policy in T2D.
HIGHLIGHTS
Introduction
Type 2 diabetes mellitus (T2D) is a serious, chronic condition that has long been recognized as one of the most significant, global public health challenges facing society.Citation1 The latest dataset from the Global Burden of Disease (GBD) program indicated that approximately 462 million individuals were affected by T2D in 2017 corresponding to 6.28% of the world’s population.Citation2 The condition is associated with significant morbidity and mortality, causing more than 1 million deaths in 2017, and is associated with a substantial economic as well as humanistic burden.Citation2 The global economic burden of diabetes was estimated at USD 1.3 trillion in 2015 and has been projected to rise to between USD 2.1 and 2.5 trillion in 2030.Citation3 The worldwide prevalence of T2D has been rising for a number of years and there are no signs of this trend abating, making T2D a primary concern for healthcare payers, health policy planners, physicians and healthcare professionals as well as those suffering from the disease.Citation2
Since the publication of data from landmark studies, such as the United Kingdom Prospective Diabetes Study (UKPDS), which showed that intensive management approaches leading to improvements in modifiable risk factors like glycated hemoglobin (HbA1c) can reduce the risk of diabetes-related complications and improve patient outcomes, there has been remarkable progress in the care of patients with T2D.Citation4,Citation5 There have been increases in the use of medications to prevent cardiovascular disease and, in recent years, new classes of anti-diabetes drugs have become available that have been shown to have cardioprotective effects in cardiovascular outcomes trials (CVOTs).Citation6,Citation7 These advances are helping patients with T2D experience longer lives and fewer complications. However, the global burden of disease associated with diabetes is continuing to rise, particularly in low and middle-income countries, creating a situation for healthcare decision makers where optimizing policy decisions is both pressing and increasingly complex.Citation8
As new therapies for T2D become available, tools to evaluate their impact on clinical outcomes and costs are needed to assist decision-makers in the efficient allocation of healthcare resources. The progress in diabetes management has been reflected in advances in computer simulation models of type 2 diabetes as evidenced in the data presented at the regular Mount Hood Diabetes Challenge Meetings.Citation9,Citation10 Economic evaluation in T2D can be challenging because of the chronic nature of the condition and the fact that it can take years or even decades for micro- and macrovascular complications to develop.Citation5 Moreover, recent comparisons of health economic model projections with CVOT data has highlighted the need for ongoing development of T2D models to remain relevant.Citation10 In an environment where healthcare decision makers, perhaps more than ever before, require models of T2D that are transparent, based on robust clinical data, and externally validated in line with published guidelines, there is a need to continually improve modeling standards.Citation11,Citation12 The objective was, therefore, to develop a product-independent, computer simulation model of T2D, using new approaches to long-standing challenges, to provide a resource that can support decision making and inform healthcare policy for a variety of users and audiences.
Methods
Literature review
Development of the PRIME Type 2 Diabetes Model (PRIME T2D Model) was built on a comprehensive review of relevant literature and expert medical and health economic input. To identify published data that could inform model development, a literature review was conducted targeting clinical, epidemiological and modeling studies in T2D. Searches were conducted across the PubMed, EMBASE and Cochrane Library databases on 20 December 2018. The search strategy was designed using a combination of free-text terms and Medical Subject Heading (MeSH) terms (Supplementary Appendix 1), with the objective of retrieving diabetes trials, systematic reviews, meta-analyses, reviews of clinical trials, evidence-based medicine, consensus development conferences, and guidelines. Search results were collated and screened in Sourcerer (Covalence Research Ltd, London, UK), first by study title and abstract, with a subsequent round of screening conducted on the full-text versions of the studies. During full-text screening, studies were categorized as a modeling analysis (reviewed separately) or into one of seven complication groups prior to full-text review: modeling studies, cardiovascular disease, retinopathy, nephropathy, hypoglycemia/ketoacidosis, cataract, diabetic foot, and macular edema.
Model development
The PRIME Type 2 Diabetes Model (PRIME T2D Model) was structured as a discrete-time, patient-level, illness-death model, with each simulated patient being exposed to risks of events in each annual model cycle by a randomly-ordered sequence of risk models in two simulation “arms”. Risk models, coded as individual “controllers”, were developed to model the following complications of T2D: myocardial infarction (first and second events), stroke (first and second events), heart failure, ischemic heart disease, renal failure, neuropathy (severe pressure sensation loss), amputation, foot ulcer, severe vision loss and macular edema. Adverse event risk models were also developed to support modeling of non-severe and severe hypoglycemia based on treatment-specific event rates.
Mortality was captured in a separate controller, utilizing four separate risk equations depending on the patient event history: two logistic for patients having experienced a complication event in the current cycle (one for those with an existing prior history of complication and one for those without), one Gompertz function for patients with a history of events but no event in the current cycle, and one “background mortality” Gompertz function for patients with neither a history of events nor an event in the current cycle. Each mortality risk function was based on the UKPDS Outcomes Model 2 (OM2) risk equations, with an option for the background mortality model to be based directly on age- and sex-indexed country-specific life tables in place of the Gompertz equation employed in the UKPDS OM2.Citation13
The complication and mortality risk controllers were designed to return a probability of the event for each patient in the current model cycle based on the patient characteristics (demographics, risk factors and event history). The probability of each complication is then determined through a stochastic/random walk process (first-order uncertainty) in which the probability is compared with a value drawn from a uniform probability distribution to establish if the event has occurred in the current cycle.Citation14 The myocardial infarction, stroke, heart failure, and ischemic heart disease risk models were implemented using a model averaging technique in which patient-level risk can be evaluated by multiple risk models, comprising at least the UKPDS OM2 and BRAVO models in each case, and Hong Kong registry risk models where applicable.Citation13,Citation15–18 Using this approach, risk equations for a given endpoint were used to estimate risk (for each simulated patient in each model cycle). An average estimate of risk, weighted based on the characteristics of the simulated patient, was then used to assign the risk of an event in line with previously published approaches.Citation19,Citation20 Each risk model included an encoding of the baseline cohort characteristics of the derivation cohort that, for a given simulated cohort, was used to calculate a “distance” between the derivation cohort and the simulated cohort. Over N cohort characteristics, the sum product of the weight
for characteristic j and the absolute deviation of the simulated characteristic value (
) from the derivation cohort value (
) is first calculated for each model, normalized to a percentage deviation by dividing by the derivation value. This sum product is adjusted for the number of cohort characteristics to ensure equivalent weighting for models with equal relative deviations from differing numbers of reported characteristics. Finally, the deviation weight is converted to a proximity weight by taking the complement and raising to the power of a distance penalty factor
which adjusts how harshly deviations are penalized in the final proximity calculation:
The proximity weights are then normalized to the range [0,1] to give normalized proximity weights for each risk model that sum to 1 over all included models:
The vector of characteristic weights β was populated with initial values for known risk factors for cardiovascular complications (HbA1c, systolic blood pressure [SBP], body mass index [BMI], high-density lipoprotein [HDL], low-density lipoprotein [LDL], and estimated glomerular filtration rate [eGFR]), and optimized using a genetic optimization algorithm in which the fitness function was the sum of the root mean squared deviation (RMSD) values over all endpoints in the derivation studies.
For other complications, risk estimations were taken from a variety of published sources. To evaluate the progression of renal disease and development of renal failure, the user may choose to model based on an eGFR trajectory model, developed based on the multivariable regression model published by Zoppini et al., or the UKPDS OM2 risk equation for renal failure.Citation13,Citation21 Neuropathy, defined as severe pressure sensation loss, is estimated based on data from BRAVO.Citation15 Foot ulcer and amputation risk were estimated based on UKPDS risk equations and severe vision loss relied on a model averaging approach with two risk equations.Citation13,Citation15 Macular edema risk was estimated based on data from the ACCORD Eye Study and risk adjustment from a published registry analysis (German/Austrian DPV Database).Citation22,Citation23
In addition to stochastic or first-order uncertainty, the PRIME T2D Model was developed with ubiquitous support for capturing uncertainty around model inputs (heterogeneity, e.g. cohort characteristics) and parameters (second-order uncertainty, e.g. risk equation coefficients). All model inputs and parameters were implemented using a custom data type to describe a central estimate of the value, alongside an optional measure of variance, and the form of the distribution (with support for uniform, normal, lognormal, and beta distributions). Supported variance measures include standard deviations, standard errors with sample sizes, 95% confidence intervals, and interquartile ranges, with each measure appropriately transformed to parameterize the specified distribution.Citation24 Probabilistic sensitivity analysis (PSA) was implemented in the model, in which samples are drawn around all patient baseline characteristics, costs, quality of life utilities, and model coefficients with non-zero variance, and non-parametric bootstrapping with replacement is used to generate the results for each PSA iteration. Random number generation was implemented by way of support for an arbitrary random number generator (RNG) conforming to the Apache Commons Math 3.0 RandomGenerator interface.Citation25 The Mersenne Twister was selected as the default RNG with a random seed that can be specified by the user.Citation26
A series of simple risk factor trajectory options were developed, with every patient risk factor (HbA1c, SBP, BMI, eGFR, LDL, HDL, heart rate, white blood cell count, and hemoglobin) supporting options to either hold the risk factor constant or apply a constant absolute or relative annual change specified by the user. Panel regression equations to model HbA1c and SBP progression were also implemented based on equations in the UKPDS Outcomes Model 1, and an eGFR trajectory model based on Zoppini et al. was developed.Citation19,Citation27
The ability to simulate treatment algorithms was implemented in the PRIME T2D Model by way of a treatment switch controller capable of triggering individual patient-level treatment switches based on an annual probability of treatment switch (e.g. 15% of patients switch treatment each year), a physiological parameter (e.g. HbA1c ≥8%), or a clinical event (e.g. 100% of patients switch treatments in the year following myocardial infarction).
The model is user-editable in terms of costs and utility weights used for any given set of simulations. Costs and health-related quality of life (HRQoL) utility are both captured in the model by way of initial “event” costs and disutilities, which are incurred in the year of an event or onset of a chronic condition such as renal failure, and subsequent “state” costs and disutilities, which are incurred or applied in all years subsequent to the event or onset of the chronic condition. Quality-adjusted life expectancy is estimated using an additive approach.Citation28 Discounting of both cost and HRQoL utilities is implemented to adjust future values to present day equivalents based on user-specified discount rates.
The PRIME T2D Model was programmed in Java 10, and an HTML5 interface was developed using AngularJS. Model settings are stored in a MongoDB document store, and are saved and retrieved from the AngularJS user interface via a Representational State Transfer (REST) application programming interface (API) written in Express.js on Node.js using Passport.js for user authentication. The model reports discounted and undiscounted life expectancy, quality-adjusted life expectancy, and costs, in addition to the cumulative incidence of all modeled complications, and time series illustrating the evolution of risk factors and the mean per-patient evolution of costs and HRQoL across the whole cohort. By default, the web interface allows the user to configure two simulation arms, between which incremental life expectancy, quality-adjusted life expectancy and costs are also presented alongside an incremental cost-effectiveness ratio (ICER) expressed as a cost per quality-adjusted life year (QALY) gained.
Model validation
Model validation was performed according to best practice guidelines.Citation11 Face validity of the PRIME T2D was evaluated by review by experts in diabetes and modeling, including review of model structure, assumptions, outputs and key data sources at an advisory board meeting. To address the question of internal validity, a code audit was performed by an external third-party (HealthMetrics Outcomes Research, Bonita Springs, FL, USA). This process included review of model source code for syntax errors, reproduction of the code in a separate software environment to identify discrepancies, and cross-checking of all numerical data included in the code against source references. Binary, null and extreme input value testing was also performed along with replication tests using equivalent endpoint values from the model source data.
An automated model validation framework was developed to compare the outputs of the PRIME T2D Model against published outcomes of a series of validation exercises. The validation framework was written in Python 3, and automates the execution of the PRIME T2D Model against a series of validation exercises, each consisting of a bundle of JavaScript Object Notation (JSON) files, defining baseline cohort characteristics, treatment effects, and simulation parameters (such as life tables and risk factor trajectory models). The default set of validation exercises during model development included numerous different study designs of anti-diabetic agents spanning numerous therapeutic classes and country settings, namely: the Lipids in Diabetes Study (LDS, with results taken from the UKPDS OM2 manuscript)Citation13, ACCORDCitation29, REWINDCitation30, LEADERCitation31, EMPA-REG OUTCOMECitation32, DEVOTECitation33, Fung et al.Citation34, Wan et al.Citation35, and Shah et al.Citation36 For each validation exercise, the framework uses the absolute estimates of cumulative incidence from the PRIME T2D Model and comparable cumulative incidence numbers from the studies to generate the absolute and relative error for each endpoint, and the mean absolute error (MAE) and root mean square deviation (RMSD) for each study.
Example analysis
An example, UK-focused cost-utility analysis was conceived to illustrate the PRIME T2DM data requirements and outputs. The analysis was based on the results of the Steno-2 randomized controlled trial (RCT) as it illustrated the effect of intensive multifactorial management of patients with diabetes and persistent microalbuminuria targeting all known modifiable risk factors versus conventional therapy in line with Danish treatment guidelines for the period 1988–2000.Citation37,Citation38 In the example analysis, baseline cohort characteristics and treatment effects were taken from the Steno-2 RCT publications.Citation34,Citation35 Treatment effects were maintained for 8 years (the closest integer value to the mean treatment period of 7.8 years in the Steno-2 RCT), after which point all differences in risk factors and costs were abolished through use of a treatment switch.
Costs of T2D complications were taken from a combination of a 2014 publication based on the UKPDS cohort and a 2020 publication evaluating the cost of therapeutic inertia in patients with type 2 diabetes in the UK.Citation39,Citation40 Drug costs were taken from the British National Formulary, covering metformin, sulfonylurea, insulin, calcium antagonists, beta blockers, statins, aspirin, and angiotensin II receptor blockers, with utilization matched to that at the end of the intervention study period in the Steno-2 RCT.Citation35,Citation41 HRQoL utilities were taken from published sources and, wherever possible, derived using the EQ-5D instrument.Citation42–44 All costs were reported in 2019 pounds sterling and future costs and effects were discounted at 3.5% annually based on guidelines on health technology appraisal published by the National Institute for Health and Care Excellence.Citation45
Results
Systematic literature review
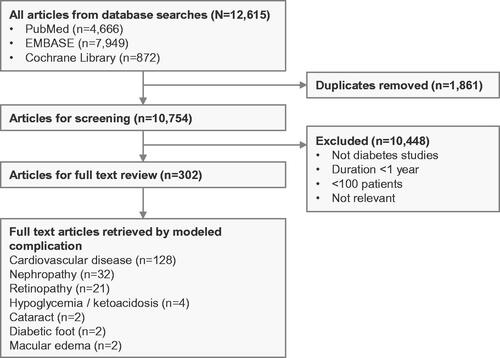
The literature review retrieved 12,615 studies from PubMed, EMBASE, and the Cochrane Library (). Following removal of duplicates, a total of 10,754 unique studies remained. Study titles and abstracts were screened to exclude publications that were not conducted in patients with type 2 diabetes, described studies with duration of follow up of less than 1 year, described studies with fewer than 100 patients, or were not relevant to modeling type 2 diabetes. Of the 10,754 unique studies retrieved, title and abstract screening removed 10,448 studies, leaving 302 studies for full-text screening (). Full-text review was used to identify studies reporting longitudinal data, data on clinical endpoints (including cardiovascular disease [CVD] events, ophthalmic/retinopathy complications, renal disease, diabetic foot complications, neuropathy, acute complications [hypoglycemia or ketoacidosis]), and/or data describing the progression of key risk factors over time (including HbA1c, blood pressure, BMI, serum lipid levels, or estimated glomerular filtration rate). Of the 302 studies, 128 reported data on cardiovascular disease, 21 on retinopathy, 32 on nephropathy, 4 on hypoglycemia/ketoacidosis, 2 on cataract, 2 on diabetic foot, and 2 on macular edema. The remaining studies did not provide useful data on diabetes-related complications for a modeling analysis.
Figure 1. PRISMA flow diagram illustrating the systematic literature review study selection process.
Model development and validation
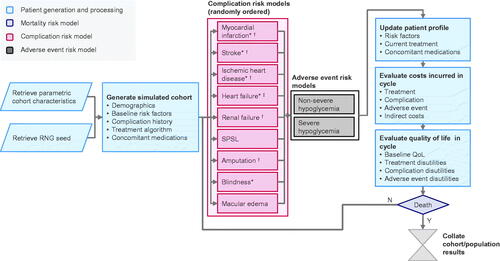
The PRIME T2D Model is accessible over the Internet and has a web interface written in JavaScript and HTML5 that allows a two-arm simulation to be configured using an easy-to-use drag-and-drop interface (https://prime-diabetes-model.com). Access to the model will be free for academic organizations and health technology assessment bodies. To run simulations, users can define cohort characteristics, treatment algorithms and effects on risk factors, risk factor progression, direct and indirect cost inputs, HRQoL utilities and other settings to tailor simulations to specific populations and country settings. The model then performs patient-level simulations (see Methods section for details) according to the schema presented in to evaluate costs, life expectancy, quality-adjusted life expectancy, cumulative incidence of all modeled diabetes complications, mean hypoglycemia and ketoacidosis rates in each simulation arm, along with differences in cost, life expectancy and quality-adjusted life expectancy outcomes between simulation arms and the incremental cost-effectiveness ratio (ICER).
Figure 2. Schematic diagram of the PRIME T2D Model. *Model averaging is used in this controller; †Denotes complications with an increased risk of mortality in the year of complication onset and in subsequent years; ‡Denotes complications with an increased risk of mortality associated with a history of this complication. Abbreviations. QoL, quality of life; RNG, random number generator; SPSL, severe pressure sensation loss.
As an example, the model was used to make long-term projections of outcomes from the Steno-2 study based on changes in risk factors in the intensive and conventional management arms. The simulation was run over a 50-year time horizon and showed that intensive management improved quality-adjusted life expectancy by 0.51 QALYs (95% credible interval: 0.39–0.63) relative to conventional management, while reducing costs by GBP 3,703 (£3,188–4,28) over the 50-year time horizon (, ). The PSA showed that 100% of bootstrap iterations fell in the lower right quadrant of the cost-effectiveness plane (), corresponding to reduced costs and improved quality-adjusted life expectancy in 100% of iterations. Incidence of cardiovascular complications was reduced with intensive management, with reductions from 43.2% to 41.0% of patients experiencing myocardial infarction over 50 years, and 17.6% to 16.6% of patients experiencing stroke in this simulation. Microvascular complication incidence was also reduced, with the cumulative incidence of neuropathy decreasing from 55.3% to 54.3% and the incidence of blindness decreasing from 12.3% to 12.1% with intensive versus conventional therapy.
Figure 3. Cost-effectiveness scatterplot from the example anlaysis of intensive versus conventional multifactorial management in the Steno-2 trial. £, 2019 Pounds Sterling (GBP); QALY, quality adjusted life years. The scatterplot shows data for 1,000,000 simulated patients, with each point representing the mean from 5,000 patients. The ellipsis indicates points inside the 95% credible interval for incremental values.
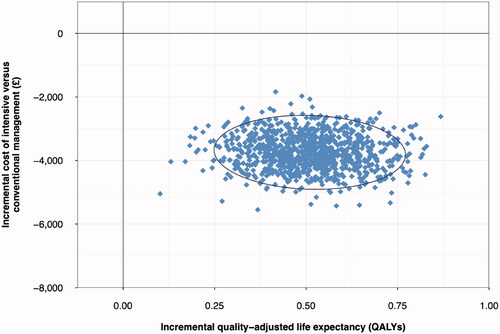
Table 1. Summary health economic outcomes in the example analysis of intensive versus conventional multifactorial management in the Steno-2 trial.
Validation analysis
Validation analysis indicates that the model is capable of reliably estimating published outcomes across a range of studies, time frames, interventions and country-settings (, ). All RMSD values for internal validations (i.e. against studies from which parts of the PRIME T2DM were derived) were 1.1% or less, while all external validation RMSDs were 3.7% or less, reflecting a faithful reproduction of the derivation study outcomes, and a close match to external studies. MAEs were lowest when validating against the ACCORD standard intervention arm and the DEVOTE insulin degludec arm (0.4% for both ACCORD and DEVOTE across all endpoints reported by the studies), while the PRIME T2D Model performed worst against the metformin arm of the Fung et al. study (MAE 1.5%) and the Shah et al. population (MAE 1.9%), the latter of which included cumulative incidence data over a 50-year period, which likely contributed to the relatively high absolute error rate.
Figure 4. Scatterplot of the PRIME T2D Model validation analysis. Each point on the graph represents a cumulative incidence value from the PRIME T2D Model and the corresponding published study value for validation (expressed as cumulative incidence of a given diabetes-related complication). Values from the PRIME T2D Model are plotted as the y-axis and the corresponding cumulative incidence values from the published study on the x-axis. A perfect match would see all points on the y = x line.
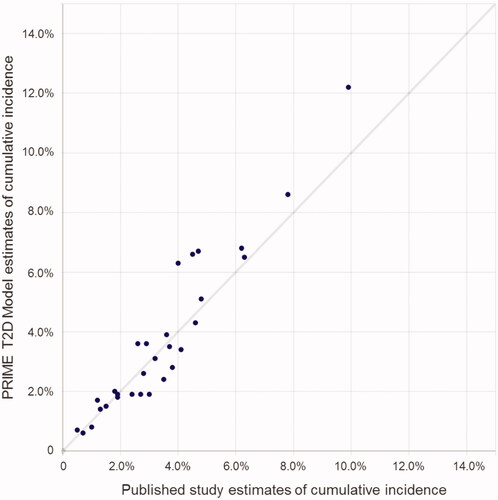
Table 2. Results from PRIME T2D Model validation exercises.
Discussion
The PRIME T2D Model has been designed to perform patient-level simulations to evaluate long-term outcomes for populations with T2D receiving different therapies in a way that is useful for health economic evaluation. The model can report clinical outcomes, quality-adjusted life expectancy, direct and indirect costs, along with standard measures of cost-effectiveness and is capable of probabilistic sensitivity analysis. Based on a systematic literature review, the model was developed in line with good practice guidelines from ISPOR, the International Society for Pharmacoeconomic and Outcomes Research (ISPOR).Citation46 This included a conceptualization phase that incorporated input from external clinical and diabetes modeling experts, a development phase consistent with best practices for individual-level state-transition models, and internal and external model validation.Citation11,Citation44
Several approaches novel to T2D modeling were utilized, such as combining risk formulae using a weighted model averaging approach that takes into account patient characteristics, to evaluate complication risk. The goal with model averaging is to make the model as representative and accurate as possible over a range of settings and populations. The results of external validation analyses for T2D model have been mixed in the past, particularly when the validation population differs from the population used to derive the model or when no opportunity for calibration was afforded.Citation10,Citation47,Citation48 Cardiovascular disease risk estimation in the PRIME T2D Model is based on approach that weights the use of different risk equations based on cohort characteristics to provide more appropriate risk estimates. An analogous approach has been used in other modeling fields,Citation20 and its application in diabetes modeling was previously described from the PRIME Type 1 Diabetes Model.Citation26 Model averaging approach offers considerable potential, and could be extended by incorporation of additional risk equations for macrovascular complications and/or to evaluate the risk of other complications. A limiting factor, however, is comparable endpoint definitions: during model development eight additional risk formulae were considered for inclusion in model average to estimate the risk of macrovascular complications but were precluded due to non-matching endpoints or formulae outputs.
A number of novel features and positive validation data make the PRIME T2D Diabetes Model an attractive option for modeling studies. The model was developed, in line with best practice guidelines, by performing an extensive literature review and selecting the most appropriate data inputs in conjunction with expert clinical input. Model averaging, an approach novel to T2D modeling, was used to estimate the risk of macrovascular complications. This approach makes the model more adaptable in terms of estimating outcomes for different populations. Of particular note is the inclusion of risk equations from the Hong Kong registry data, which helps accommodate risk assessment in South East Asian populations. Simulation of nephropathy complications is based on eGFR progression (with KDIGO staging), providing more granularity around renal function and disease progression than a simple renal failure versus no renal failure approach. User-adjustable hazard ratios for macrovascular complications are included in the user-interface, allowing simplified calibration for individual simulations to capture class- or treatment-specific effects from CVOTs in health economic analyses. The model has been developed using a combination of modern software, bringing the advantages and of a user-friendly interface to set up and run simulations, along with high computing performance and short simulation times.
The credibility of any new health economic model is closely linked to its transparency and validation results. As well as extensive documentation being available to model users, the model code has been verified (code audit by a third-party), internally validated against both studies employed in the development of the model and externally validated against studies that did not inform model development. In addition, the PRIME T2D Model is equipped with a validation framework to accommodate future requirements around internal and external validation. Like all models, however, it has limitations. The model averaging approach for macrovascular complications contains data from three studies. More risk equations would be advantageous, but challenges around input variables, endpoint definitions and outcomes reported made this impracticable. It is hoped, however, that as new risk equations become available there will be opportunities to expand model averaging in the PRIME T2D Model. During development, decisions had to be made around which data to include in the model. These were informed by expert clinical opinion, the perceived reliability of the data reported, the appropriateness of endpoint definitions, the input data required to make estimates of complication risk, and exploratory modeling. Every effort was made to include the most robust and appropriate data in the PRIME T2D Model, however, whilst these decisions are impossible to avoid, it is not known which decisions on data selection is likely to influence the model’s ability to predict outcomes for different populations. In recent years, several other conditions and comorbidities have been linked to type 2 diabetes that are not included in the PRIME T2D Model including depression, asthma and mental health conditions.Citation49 Whilst it is clear that these conditions are likely to impact patients’ quality of life, there is insufficient evidence linking them to specific risk factors (such as HbA1c) that could differ with treatment to justify their inclusion in a health economic model. However, this may well be an avenue of future model development as more evidence becomes available. Similarly, another area of interest for health economic modelers is the long-term evaluation of clinical and cost outcomes for patients with type 1 diabetes. It is noteworthy that the present model is based on data exclusively from populations with type 2 diabetes and, as such, is not designed for health economic evaluation in type 1 diabetes. However, this has been an area of previous investigation and the PRIME Type 1 Diabetes Model was published in 2017.Citation28 The development of that model provided valuable insights for the development of the PRIME T2D Model.
For certain complications, no or limited data were available for external validation meaning that complication risk has only been validated internally against source data. This was due to a paucity of publications that fulfilled the dual criteria of describing long-term (over 3 years) longitudinal data and reporting endpoints that were comparable to the PRIME T2D Model. Moreover, many of the publications identified for validation had limited descriptions of cohort characteristics and/or the therapies patients were taking. In these cases, assumptions had to be made on the missing cohort characteristics and risk factors, based on data from comparable populations (in terms of country, age and duration of diabetes). It is unclear how much this missing data influenced the accuracy of the external validation analysis with the model.
Farmer et al. (2014) noted that there are advantages to patient-level simulation in health economic modeling.Citation50 However, its implementation can be computationally intensive, particularly in for more complex diseases such as diabetes, and this can preclude the use of commonly-used modeling software such as TreeAge or Microsoft Excel. The PRIME T2D Model is coded in Java, which is a comparatively fast and flexible language, and as a result it is currently capable of running simulations on a cohort of 1,000,000 patients, with probabilistic sensitivity analysis in less than 20 min (or less than 12 min without probabilistic sensitivity analysis) on modern commodity hardware (Intel Core™ i9-9980HK CPU at 2.40 GHz).
In summary, the PRIME T2D Model is a product-independent, cost-effectiveness analysis tool that has been developed in line with good practice guidelines. It is a patient-level, discrete time, illness-death simulation model designed to evaluate long-term clinical and cost outcomes for populations with T2D. The model was developed based on an extensive literature review and expert input, and validation analysis has shown that the model is capable of reproducing outcomes from a range of published studies in T2D with long-term follow up. The model offers new approaches to some of the long-standing challenges in the health economic modeling of T2D that, it is hoped, will make it a valuable resource for health economic evaluation of new and existing interventions for T2D.
Transparency
Declaration of funding
This study was supported with funding from Eli Lilly and Company.
Declaration of financial/other relationships
WJV is an employee of Ossian Health Economics and Communications, which received consulting fees from Eli Lilly and Company to support the research described in this paper.
RFP is an employee of Covalence Research Ltd., which received consulting fees from Ossian Health Economics and Communications to support the research described in this paper.
At the time of writing, KN, KB and BO were all employees of Eli Lilly and Company. KN is no longer and employee of Eli Lilly and Company.
Peer reviewers on this manuscript have received an honorarium from JME for their review work but have no other relevant financial relationships to disclose.
Supplemental Material
Download MS Word (15.9 KB)Acknowledgements
The authors are grateful to Prof. Michael Brändle for his valuable input during the model concept phase of this project, and to all of the expert advisors who provided valuable input during the development of the model at the advisory board meeting. We are grateful to the scientists at HealthMetrics Outcomes Research who performed the code audit to ensure the internal validity of the model. The authors are also grateful to Eli Lilly and Company for the provision of funding to support the development of the model.
References
- World Health Organization. Health Topics – Diabetes; [cited 2020 Nov 27]. Available from: https://www.who.int/health-topics/diabetes#tab=tab_1.
- Khan MAB, Hashim MJ, King JK, Govender RD, et al. Epidemiology of type 2 diabetes – global burden of disease and forecasted trends. J Epidemiol Glob Health. 2020;10(1):107–111.
- Bommer C, Sagalova V, Heesemann E, et al. Global economic burden of diabetes in adults: projections from 2015 to 2030. Diabetes Care. 2018;41(5):963–970.
- UK Prospective Diabetes Study Group. Intensive blood-glucose control with sulphonylureas or insulin compared with conventional treatment and risk of complications in patients with type 2 diabetes. Lancet. 1998;352(9131):837–853.
- Holman RR, Paul SK, Bethel MA, et al. 10-Year follow-up of intensive glucose control in type 2 diabetes. N Engl J Med. 2008;359(15):1577–1589.
- Cefalu WT, Kaul S, Gerstein HC, et al. Cardiovascular outcomes trials in type 2 diabetes: Where do We go from here? Reflections from a diabetes care editors’ expert forum. Dia Care. 2018;41(1):14–31.
- Schnell O, Standl E, Cos X, et al. Report from the 5th cardiovascular outcome trial (CVOT) summit. Cardiovasc Diabetol. 2020;19(1):47.
- Sattar N. Advances in the clinical management of type 2 diabetes: a brief history of the past 15 years and challenges for the future. BMC Med. 2019;17(1):1.
- Palmer AJ, Si L, Tew M, et al. Computer modeling of diabetes and its transparency: a report on the eighth mount hood challenge. Value Health. 2018;21(6):724–731.
- Si L, Willis MS, Asseburg C, et al. Evaluating the ability of economic models of diabetes to simulate new cardiovascular outcomes trials: a report on the ninth mount hood diabetes challenge. Value Health. 2020;23(9):1163–1170.
- Eddy DM, Hollingworth W, Caro JJ, et al. ISPOR-SMDM modeling good research practices task force. Model transparency and validation: a report of the ISPOR-SMDM modeling good research practices task force-7. Med Decis Making. 2012;32(5):733–743.
- American diabetes association consensus panel. Guidelines for computer modeling of diabetes and its complications. Diabetes Care. 2004;27(9):2262–2265.
- Hayes AJ, Leal J, Gray AM, et al. UKPDS outcomes model 2: a new version of a model to simulate lifetime health outcomes of patients with type 2 diabetes mellitus using data from the 30 year United Kingdom prospective diabetes study: UKPDS 82. Diabetologia. 2013;56(9):1925–1933.
- Briggs AH, Weinstein MC, Fenwick EA, et al. Paltiel AD; ISPOR-SMDM modeling good research practices task force. Model parameter estimation and uncertainty analysis: a report of the ISPOR-SMDM modeling good research practices task force working group-6. Med Decis Making. 2012;32(5):722–732.
- Shao H, Fonseca V, Stoecker C, et al. Novel risk engine for diabetes progression and mortality in USA: Building, relating, assessing, and validating outcomes (BRAVO). Pharmacoeconomics. 2018;36(9):1125–1134.
- Yang X, So WY, Kong AP, et al. Development and validation of a total coronary heart disease risk score in type 2 diabetes mellitus. Am J Cardiol. 2008;101(5):596–601.
- Yang X, Ma RC, So WY, et al. Development and validation of a risk score for hospitalization for heart failure in patients with type 2 diabetes mellitus. Cardiovasc Diabetol. 2008;7(1):9.
- Yang X, So WY, Kong AP, et al. Development and validation of stroke risk equation for Hong Kong chinese patients with type 2 diabetes: the Hong Kong diabetes registry. Diabetes Care. 2007;30(1):65–70.
- Valentine WJ, Bae J, Boye K, et al. Predicting complications and long-term outcomes in type 1 diabetes: the PRIME Diabetes Model. European Association for the Study of Diabetes Annual Meeting 2015. Podium Presentation, Stockholm, Sweden. Abstract #882
- Wang Y, Wu X, Mo X. A novel adaptive-weighted-average framework for blood glucose prediction. Diabetes Technol Ther. 2013;15(10):792–801.
- Zoppini G, Targher G, Chonchol M, et al. Predictors of estimated GFR decline in patients with type 2 diabetes and preserved kidney function. Clin J Am Soc Nephrol. 2012;7(3):401–408.
- Gower EW, Lovato JF, Ambrosius WT, et al. Lack of longitudinal association between thiazolidinediones and incidence and progression of diabetic eye disease: the ACCORD eye study. Am J Ophthalmol. 2018;187:138–147.
- Hammes HP, Welp R, Kempe HP, et al. Holl RW; DPV initiative—german BMBF competence network diabetes mellitus. Risk factors for retinopathy and DME in type 2 diabetes-results from the german/Austrian DPV database. PLoS One. 2015;10(7):e0132492.
- Wan X, Wang W, Liu J, et al. Estimating the sample mean and standard deviation from the sample size, median, range and/or interquartile range. BMC Med Res Methodol. 2014;14(1):135.
- The Apache Software Foundation. Commons Math: The Apache Commons Mathematics Library; [cited 2020 Dec 1]. Available from: http://commons.apache.org/proper/commons-math/.
- Matsumoto M, Nishimura T. Mersenne twister: a 623-Dimensionally equidistributed uniform Pseudo-Random number generator. ACM Trans Model Comput Simul. 1998;8(1):3–30.
- Clarke PM, Gray AM, Briggs A, et al. UK prospective diabetes study (UKDPS) group. A model to estimate the lifetime health outcomes of patients with type 2 diabetes: the United Kingdom prospective diabetes study (UKPDS) Outcomes model (UKPDS no. 68). Diabetologia. 2004;47(10):1747–1759.
- Valentine WJ, Pollock RF, Saunders R, et al. The PRIME diabetes model: Novel methods for estimating Long-Term clinical and cost outcomes in type 1 diabetes mellitus. Value in Health. 2017;20(7):985–991.
- Gerstein HC, Miller ME, Byington RP, et al. Effects of intensive glucose lowering in Type 2 Diabetes. N Engl J Med. 2008;358(24):2545–2559.
- Gerstein HC, Colhoun HM, Dagenais GR, et al. Dulaglutide and cardiovascular outcomes in type 2 diabetes (REWIND): a double-blind, randomised placebo-controlled trial. Lancet. 2019;394(10193):121–130.
- Marso SP, Daniels GH, Brown-Frandsen K, et al. Liraglutide and cardiovascular outcomes in type 2 diabetes. N Engl J Med. 2016;375(4):311–322.
- Zinman B, Wanner C, Lachin JM, et al. Empagliflozin, cardiovascular outcomes, and mortality in type 2 diabetes. N Engl J Med. 2015;373(22):2117–2128.
- Marso SP, McGuire DK, Zinman B, et al. Efficacy and safety of degludec versus glargine in type 2 diabetes. N Engl J Med. 2017;377(8):723–732.
- Fung CS, Wan EY, Wong CK, et al. Effect of metformin monotherapy on cardiovascular diseases and mortality: a retrospective cohort study on chinese type 2 diabetes mellitus patients. Cardiovasc Diabetol. 2015;14(1):137.
- Wan EYF, Fung CSC, Jiao FF, et al. Five-year effectiveness of the multidisciplinary risk assessment and management Programme-Diabetes mellitus (RAMP-DM) on Diabetes-Related complications and health service Uses-A Population-Based and Propensity-Matched cohort study. Diabetes Care. 2018;41(1):49–59.
- Shah AD, Langenberg C, Rapsomaniki E, et al. Type 2 diabetes and incidence of cardiovascular diseases: a cohort study in 19 million people. Lancet Diabetes Endocrinol. 2015;3(2):105–113.
- Gaede P, Vedel P, Larsen N, et al. Multifactorial intervention and cardiovascular disease in patients with type 2 diabetes. N Engl J Med. 2003;348(5):383–393.
- Gaede P, Lund-Andersen H, Parving H-H, et al. Effect of a multifactorial intervention on mortality in type 2 diabetes. N Engl J Med. 2008;358(6):580–591.
- Alva ML, Gray A, Mihaylova B, et al. The impact of diabetes-related complications on healthcare costs: new results from the UKPDS (UKPDS 84). Diabet Med. 2015;32(4):459–466.
- Bain SC, Bekker Hansen B, Hunt B, et al. Evaluating the burden of poor glycemic control associated with therapeutic inertia in patients with type 2 diabetes in the UK. J Med Econ. 2020;23(1):98–105.
- National Institute for Health and Care Excellence. British National Formulary; [cited 2020 Dec 2]. Available from: https://bnf.nice.org.uk/.
- Clarke P, Gray A, Holman R. Estimating utility values for health states of type 2 diabetic patients using the EQ-5D (UKPDS 62). Med Decis Making. 2002;22(4):340–349.
- Bagust A, Beale S. Modelling EuroQol health-related utility values for diabetic complications from CODE-2 data. Health Econ. 2005;14(3):217–230.
- Wasserfallen JB, Halabi G, Saudan P, et al. Quality of life on chronic dialysis: comparison between haemodialysis and peritoneal dialysis. Nephrol Dial Transplant. 2004;19(6):1594–1599.
- National Institute for Health and Care Excellence. Guide to the methods of technology appraisal 2013; [cited 2020 Dec 1]. Available from: https://www.nice.org.uk/process/pmg9/resources/guide-to-the-methods-of-technology-appraisal-2013-pdf-2007975843781.
- Caro JJ, Briggs AH, Siebert U, et al. ISPOR-SMDM modeling good research practices task force. Modeling good research practices–overview: a report of the ISPOR-SMDM modeling good research practices task force–1. Value Health. 2012;15(6):796–803.
- van Dieren S, Beulens JWJ, Kengne AP, et al. Prediction models for the risk of cardiovascular disease in patients with type 2 diabetes: a systematic review. Heart. 2012;98(5):360–369.
- Laxy M, Schöning VM, Kurz C, et al. Performance of the UKPDS outcomes model 2 for predicting death and cardiovascular events in patients with type 2 diabetes mellitus from a german population-based cohort. Pharmacoeconomics. 2019;37(12):1485–1494.
- Carlsson AC, Wändell P, Ösby U, et al. High prevalence of diagnosis of diabetes, depression, anxiety, hypertension, asthma and COPD in the total population of Stockholm, Sweden – a challenge for public health. BMC Public Health. 2013;13(1):670.
- Farmer AJ, Stevens R, Hirst J, et al. Optimal strategies for identifying kidney disease in diabetes: properties of screening tests, progression of renal dysfunction and impact of treatment – systematic review and modelling of progression and cost-effectiveness. Health Tech Assess. 2014;18(14):1–128.