
 ?Mathematical formulae have been encoded as MathML and are displayed in this HTML version using MathJax in order to improve their display. Uncheck the box to turn MathJax off. This feature requires Javascript. Click on a formula to zoom.
Abstract
Objective
To model changes in prices, utilization, and expenditures of targeted immune modulators (TIMs) for rheumatoid arthritis, accounting for biosimilar entry.
Methods
Using IQVIA National Sales Perspective data between 2013 and 2019, we examined sales and expenditures of biologics and non-biological complex molecules, 20 quarters before and after patent exclusivity milestones. We estimated the impact of a molecule’s exclusivity milestones and biosimilar entry on prices, using a regression discontinuity design (RDD). We then combined the RDD estimate with historical trends to assess the impact of adalimumab’s exclusivity milestones on future TIM expenditures.
Results
Changes in average molecule prices were associated largely with biosimilar uptake. For molecules with relatively high biosimilar uptake (>60%), prices fell considerably (−21.2% to −59.3%) one year after exclusivity milestones, whereas molecules with lower biosimilar uptake (<10%) experienced smaller price decreases (−2.4% to −8.4%). Average price reduction at the molecule level after biosimilar entry was not significant (−18.6%; p = .657). When applying the RDD results after adalimumab’s exclusivity milestones, its projected share of total TIM market expenditures decreased from 48.0% in 2019 to 26.0% in 2025, whereas expenditures on Janus kinase inhibitors increased from 4.0% to 34.0%.
Conclusions
Biologics facing biosimilar competition may experience price decreases, potentially offering substantial savings to payers, patients, and society, although the magnitude of these estimates depends on biosimilar uptake. Formulary placement, along with manufacturer-payer dynamics, may also play a role in determining the impact on price and market uptake of biosimilars.
Introduction
In the US, biologics account for more than one-third of the net drug expenditures in 2017Citation1, totaling $125 billion in 2018, a 50% increase since 2014Citation2,Citation3. Biologics are larger and more complex than small molecules, and are typically developed in a living system, such as a microorganism, a plant cell, or an animal cellCitation4. For some biologics, the US Food and Drug Administration (FDA) has approved biosimilar(s) for commercialization, defined as “a biological product that is highly similar to and has no clinically meaningful differences from an existing FDA-approved reference product”Citation4. Although the introduction of biosimilars may increase competition and reduce prices, there have been relatively few launches of biosimilars, particularly in the US.
Competition between biologics and biosimilars differs materially from branded and generic small molecules. First, biologics are harder to replicate due to the complex nature of molecules, making biosimilars riskier and costlier to develop than generics for small moleculesCitation5. Biosimilars are required by the FDA to show no clinically meaningful difference in terms of their safety, purity, and potency from their biologic reference counterpart. Second, biosimilars—unlike generics—are not perfect copies of the reference product. This is one of the factors that limit physician and patient uptakeCitation6. Third, only two biosimilars have attained the FDA’s “interchangeable” designation so farCitation7, the required label for a pharmacy-level treatment switch. In the absence of this label, switching decisions remain clinical, rather than administrative. Fourth, many high-cost biologics may end up on favorable formulary tiers, compared with their biosimilar alternatives, due to the potential for manufacturer rebatesCitation8–10. All of these factors may have limited the US market penetration of biosimilars in some therapeutic areas. Although the FDA has approved 36 biosimilars across 11 reference productsCitation11, only 21 biosimilars are currently available to patientsCitation11,Citation12.
Biosimilars have the potential to significantly decrease health expenditures, particularly for diseases such as rheumatoid arthritis (RA), where biologics are commonly used. In the US, RA affects about 1.3 million adultsCitation13, and the prevalence continues to rise globallyCitation14. Patients have several treatment choices, known as disease-modifying antirheumatic drugs (DMARDs). These include small molecule DMARDs (e.g. methotrexate), biologic DMARDs such as tumor necrosis factor inhibitors (TNFis: adalimumab, etanercept, infliximab, certolizumab, and golimumab) and other non-TNFi biologics (abatacept, rituximab, sarilumab, and tocilizumab) as well as small molecule Janus kinase inhibitors (JAKinibs: baricitinib, tofacitinib, and upadacitinib). Biologic DMARDs and JAKinibs are known as targeted immune modulators (TIMs)Citation15. In 2018, 16 molecules (including infliximab, etanercept, rituximab, and adalimumab) faced biosimilar competition in Europe, exposing 21% of total biologic market expenditures (€12 billion) to biosimilar competitionCitation16. In the US, few biosimilars with indications for RA, Inflectra (infliximab-dyyb)Citation17, Renflexis (infliximab-abda)Citation18, Truxima (rituximab-abbs)Citation19, Ruxience (rituximab-pvvr)Citation20, and Riabni (rituximab-arrx)Citation21 have received FDA approval and launched commercially.
Although payers often negotiate drug prices and rebates on annual or biennial basis, long-term medication price dynamics are of interest to payers and policymakers that make coverage decisions for RA treatments for at least two reasons: (i) one might expect large price changes over time due to patent expirationCitation22,Citation23, and (ii) non-medical medication switches (e.g. switching due to economic reasons) can adversely affect patient outcomesCitation24, leading to higher overall costs in the long-termCitation25. Recent patient expirations for infliximab and rituximab, as well as an upcoming patent expiration for the TNFi adalimumab, may result in future price reductionsCitation26. The American College of Rheumatology guidelines caution against switching medications for patients with low disease activity or in clinical remission, by stating “arbitrary switching between RA therapies based only on a payer/insurance company policy is not recommended”Citation27. Due to the volume and per-patient spending of RA treatments in US, payers actively engage in price negotiations with manufacturers. Thus, insurance design and volume are likely to affect treatment, and, by extension, cost associated with treatment, both presently and in the future. This study aims to quantify the changes in price, utilization, and expenditure following introduction of adalimumab biosimilars into RA pharmaceutical treatment.
Methods
Study design
We calculated changes in total TIM medication expenditures by molecule, using estimates of the impact of patent exclusivity milestones and biosimilar entry in RA and other therapeutic areas for the US. The therapeutic areas included in the analysis were: anemia, multiple sclerosis, neutropenia, and RA. We estimated changes in prices over time (i.e. 2020–2025) and changes in expected quantity (i.e. market share) due to biosimilar entryCitation28–39, with molecule-quarter as the unit of analysis, by combining retrospective data from IQVIA’s National Sales Perspectives (NSP) dataset with data on exclusivity milestones from BioMed tracker Informa Pharma Intelligence. We used historical data on US biosimilar entry in other disease areas and applied a regression discontinuity design (RDD) to estimate price impacts of biosimilar entry. Using these causal estimates, we then extrapolated market trends to predict future drug price and spending levels.
Molecules used to inform price impact of biosimilar entry
Our analysis leveraged price trajectories following biosimilar market entry for therapeutic areas that met the following criteria: (i) therapeutic area contained ≥1 branded biologic or similar non-biological complex drug (NBCD) that experienced both patent expiration and exclusivity milestones between 2010 and 2018, and (ii) therapeutic area experienced entry of ≥1 biosimilar (non-biological) product before 2018. The first inclusion criterion ensured sufficient post-exclusivity milestones market observation period, and projections were based on recent data and thus reflective of current market dynamics. As many biosimilars do not actually arrive on the market after exclusivity milestones, the second inclusion criterion indicated a practically meaningful exclusivity milestones for the reference product of interest.
Therapeutic areas were excluded if they: (i) did not have FDA-approved biologic or similar NBCD, (ii) did not experience biosimilar competition as outlined above, (iii) saw key molecules primarily distributed through independent pharmacy distributors, i.e. unit of observations reported in NSP is not drug-year or drug-year-indication, and (iv) were oncology drugs, where pricing dynamics exhibit a different pattern compared with RA and other chronic diseasesCitation40. Anemia, neutropenia, and RA therapeutic areas—due to the exclusivity milestones of epoetin alfa, filgrastim (a supportive medication for some side effects of chemotherapy but not used to treat cancer), and infliximab—all met the inclusion criteria. Given the small sample of biosimilars currently marketed in the US, we also added glatiramer acetate—an NBCD used to treat multiple sclerosis—to our list of studied molecules. Although not a biologic, glatiramer acetate is a complex, synthetic compound facing similar hurdles to generic competition as described for biologicsCitation41. Similar to RA, our primary therapeutic area of interest, the market for multiple sclerosis treatments has a number of relatively high-cost treatment options. Over the past decade, glatiramer acetate faced two generic competitors and fulfills all sample inclusion criteria outlined above.
The sample included TIMs (TNFis, non-TNFi biologics, JAKinibs, and biosimilars) as well as therapeutic areas that met the criteria described above and were thus considered good proxies for likely price changes in RA after exclusivity milestones of adalimumab: multiple sclerosis, anemia drugs, RA (infliximab), and neutropenia drugs. presents the full list of FDA-approved biosimilars included in our study sample, along with their biologic reference product. In addition to the FDA approval date, we collected actual or anticipated market launch dates for each product through a targeted web search of pharmaceutical websites and news outletsCitation11,Citation42,Citation43.
Table 1. Key dates for biosimilar entry and exclusivity milestone for each study molecule.
Data source
IQVIA NSP data from 1 December 2013 to 30 November 2019 were the primary data source for this study. NSP contains nationally representative estimates of total therapy units (e.g. pills, tables, or milliliters) of individual pharmaceutical agents sold in the US, as well as estimates of total revenues received by manufacturers of individual agents. NSP data are gathered from warehouse ship-to-invoice data and revenue reported by manufacturers and encompasses over 1.5 billion annual transactions from over 100 pharmaceutical manufacturers and more than 700 distribution centers. These data have been used in many prior studies investigating the impacts of various health policy changes on prices and utilization of drugsCitation44,Citation45, and effects of patent expiration and exclusivity milestones on utilization and prices of both branded and generic drugsCitation46–48. Since exclusivity milestones and biosimilar approval for glatiramer acetate occurred earlier, market data for a longer period (January 2010 to November 2019) were obtained. In addition to our primary analysis dataset, we obtained estimates of disease prevalence and incidence along with dates of FDA approval and US market launch for our study molecules from BioMed tracker Informa Pharma Intelligence and FDA websites.
Price and quantity estimates
NSP data contain information on drug revenue and number of units sold. Thus, some additional calculations were needed to estimate price and quantity of drugs used for patients with RA. Most TIMs have indications for multiple immunologic diseases. Adalimumab, for example, is indicated for RA, psoriatic arthritis, ankylosing spondylitis, juvenile idiopathic arthritis, Crohn's disease, ulcerative colitis, plaque psoriasis, hidradenitis suppurativa, and uveitisCitation49–51. To isolate the quantity sold for each drug’s RA indication, we disaggregated drug sales and utilization by combining each condition’s relative incidence or prevalence rate with treatment dosing information from its FDA label, following a process previously outlined by Snider et al. Citation52
Statistical analysis
Our analysis included four steps: first, we projected prices in the absence of exclusivity milestones for all TIMs included in our study sample, based on historical price trends. Second, we identify the date of exclusivity milestones and estimated the impact of exclusivity milestones on drug prices for infliximab, epoetin alpha, filgrastim, and glatiramer acetate, using a RDD approach and controlling for both drug-class effects and time since exclusivity milestones. Third, we applied estimated exclusivity milestones effects to adalimumab, the only molecule in our study sample with an upcoming exclusivity milestones date, anticipated in Q1, 2023. Fourth, we projected utilization and total expenditures for all TIMs included in our study sample. Each step is described in detail below.
Projecting prices using only current price trends
To project price trends in absence of exclusivity milestones, we calculated average quarterly percent changes within a particular drug class and applied those quarterly percent changes to future prices of drugs within each class. The extrapolation was applied to prices as of the end of 2019, the last observed price in the data. Specifically, we averaged percent change in price from the previous quarter for all drugs within a particular class (i.e. TNFis, JAKinibs, other biologic DMARDs) in each of the four quarters of 2019, and then multiplied each drug’s last observed price with the average percent change estimate of a particular quarter. To project the price of a drug in Q1 of 2020, for instance, we multiplied its price in Q4 of 2019 with the average quarterly percent change in price observed in its drug class during the first quarter of 2019. We repeated this step to project prices for all drugs in our sample until the end of our projection period, Q4 of 2025.
Impact of exclusivity milestones on prices
After projecting prices in absence of exclusivity milestones, we specified RDD models at both the individual drug and molecule levels to estimate percentage changes of average molecule prices and branded drug prices following exclusivity milestones. RDD approaches are used to estimate the effects of a treatment or intervention in settings where treatment status is determined through a known cutoff or assignment variableCitation53–55. In the case of exclusivity milestones, the date of exclusivity loss is known in advance and can impact a branded drug’s periods of market exclusivity and competition. Several studies have used similar methods to estimate effects of patent expirations on prices and demand of pharmaceutical productsCitation22,Citation23, but to date, we are not aware of any RDD studies have explored the impact of biosimilar market entry and exclusivity milestones of biologic drug prices. The impending patent expirations for Humira (adalimumab) present a promising setting to estimate exclusivity milestones pricing effects, using an RDD, specified as follows:
where the price of drug/molecule i in quarter t depended on a drug-specific fixed-effect
initial market launch date
timing of exclusivity milestones approximated by a drug’s first full quarter after exclusivity milestones
), and a discrete variable, counting the number of quarters to (<0) and from (>0) a drug’s exclusivity milestones
Lastly,
is the error term. Our parameter of interest is β1, which measures the effect of exclusivity milestones on the price of a drug/molecule.
To ensure confidence intervals around our point estimates were unbiased, we applied a clustering technique proposed by Kolesár and RotheCitation56, who demonstrated that this approach produces conservative confidence intervals compared with standard clustering procedures or Huber–White standard errors. In addition, to select the optimal bandwidth around the discontinuity (i.e. first exclusivity milestone event), we followed an approach outlined by Calonico et al.Citation57 Analyses were weighted by each molecule’s relative market share within the RA market (defined in our study sample as TNFis, JAKinibs, and other biologic DMARDs), and were conducted in Stata software, version 15.1 (StataCorp, College Station, TX), using the rdrobust commandCitation58.
Projecting the impact of biosimilar entry prices following Humira's exclusivity milestones
Next, we projected future changes in prices, quantities, and expenditures by applying post-exclusivity milestones trends to adalimumab. Humira was the only branded biologic in our sample predicted to have an exclusivity milestone event between 2020 and before 2025; Humira’s anticipated exclusivity milestones event is in Q1, 2023Citation43. Exclusivity milestones price effects were only modeled for adalimumab; all other TIMs followed the non-exclusivity milestones projected trends described above.
To incorporate the effects of exclusivity milestones on adalimumab, the coefficient estimate, from the molecule-level RDD was applied at its anticipated exclusivity milestones date, and quarterly changes in prices were projected according to the pre- and post-exclusivity milestones price trends observed for Remicade (infliximab), the other TNFi experiencing exclusivity milestones in our study sample. To control for timing effects, infliximab’s pre- and post-exclusivity milestones price trends were normalized to its exclusivity milestones date, where exclusivity milestones <0 means pre-exclusivity milestones, exclusivity milestones =0 means exclusivity milestones event quarter, and exclusivity milestones >0 means post-exclusivity milestones. We then matched adalimumab’s exclusivity milestones timeline and projected its price in the face of exclusivity milestones using the equation:
Projecting utilization and expenditure shares
We then estimated weighted drug class average quarterly percent changes in utilization for all drugs in the study sample (number of patient-years) from 2019, using a similar procedure to the one detailed above for non-exclusivity milestones price projections. In particular, a drug’s utilization in Q1 of 2020 was projected by multiplying its utilization in Q4 of 2019 with the average quarterly percent change in utilization observed in its drug class (e.g. TNFis, JAKinibs, other biologic DMARDs) during the first quarter of 2019. We repeated this step to project utilization for all drugs in our sample until the end of our projection period. Following initial utilization projection, we rescaled the total number of patient-years to the last observed size of the RA market (Q4, 2019) to estimate relative changes in utilization and used projected market shares of each drug in the overall RA market (defined in our study sample as TNFis, JAKinibs, and other biologic DMARDs). We then projected expenditures by multiplying each drug’s rescaled quantity projection with its projected price. Our projection assumed overall market dynamics remained constant over the projection period. This approach is comparable to the “current law” method used by both the Congressional Budget OfficeCitation59 and Centers for Medicare and Medicaid Services office of the Actuary when projecting future health care expendituresCitation60.
Results
Impact of exclusivity milestones on prices
For molecules with relatively high biosimilar uptake (>60%; e.g. epoetin alfa and filgrastim), observed prices fell considerably (−21.2% to −59.3%), whereas molecules with low biosimilar uptake (<10%; e.g. infliximab and glatiramer acetate) experienced small price decreases (−2.4% to −8.4%; ).
Figure 1. Change in molecule and branded drug prices, and biosimilar uptake after exclusivity milestone. Source: Calculated changes estimated combining retrospective data from IQVIA’s national sales perspective dataset with data on exclusivity milestones from BioMed tracker Informa Pharma Intelligence.
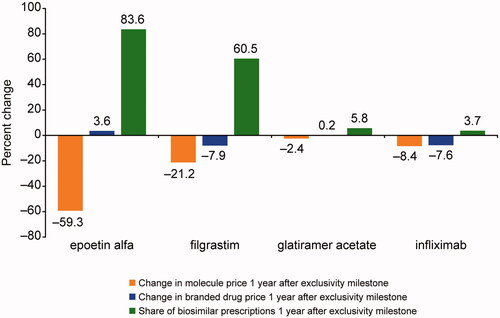
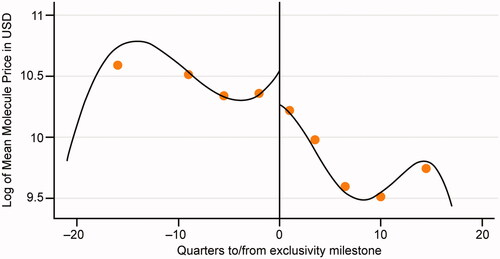
When combining these estimates in our RDD estimation, we found a moderate and not statistically significant reduction in price. Specifically, average price reduction after biosimilar entry based on the RDD was −18.6% (p = .657) at the molecule level and −6.6% (p = .854) at the branded drug level (). Although not statistically significant—likely due to the small number of exclusivity milestones events observed in the data— suggests a discontinuous price drop after exclusivity milestones. More broadly, changes in average molecule prices were associated largely with biosimilar uptake.
Figure 2. Branded drug prices per quarter for selected RA drugs: observed 2013–2019 and projected 2020–2025. DMARD, disease-modifying antirheumatic drug; JAK, Janus kinase; RA, rheumatoid arthritis; TNFi, tumor necrosis factor inhibitor.
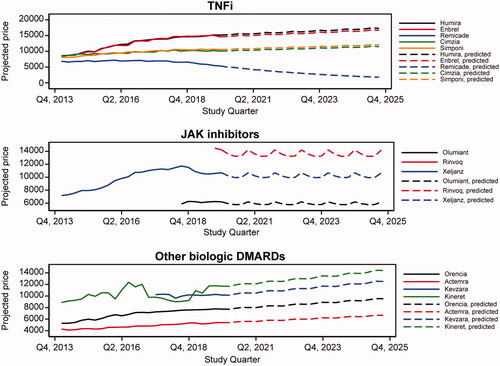
Figure 3. Change in prices after exclusivity milestones, a regression discontinuity approach.
Projected expenditures by drug class
Our model estimated that both utilization and expenditures for TNFis such as adalimumab decreased as a share of the total market due to biosimilar entry. illustrates that combined utilization market share of TNFi was expected to decrease from 54% in 2019 to an estimated 30% in 2025. Conversely, the combined utilization market share of JAKinibs was projected to increase from 4% to 32% over the same timeframe.
Table 2. Projected annual utilization (number of patient-years) for drug classes included in the study sample.
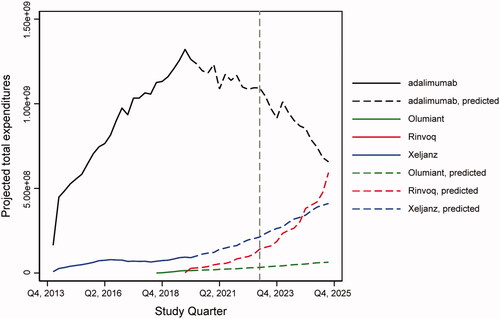
As shown in , when applying the RDD results to adalimumab’s projected price, its share of total RA market expenditures was projected to decrease from 48% in 2019 to 26% in 2025, and its share of TNFi expenditures was projected to remain stable around 70% between 2019 and 2025. In addition, adalimumab was projected to lose 25,802 patients per year between 2019 and 2025, whereas all three JAKinibs included in the sample were projected to gain 16,132 patients per year on average. The projected changes in utilization and expenditures of TNFis, non-TNFi biologics, and JAKinibs are shown in Supplementary Figures 1 and 2, respectively.
Figure 4. Changes in expenditures for adalimumab and JAK inhibitors following exclusivity milestone of adalimumab. Gray line indicates Humira exclusivity milestone. JAK, Janus kinase.
Discussion
Following exclusivity milestones, biologic drug prices were estimated to drop 6.6% for branded biologics and 18.6% for the biologic-biosimilar molecule pair. These results were derived from an RDD of four biologic drugs that have experienced an exclusivity milestone in the US. Estimated price trends followed the anticipated direction but lacked statistical significance, likely due to a lack of power from the small number of biosimilar entries in our data. However, these estimates were in line with previously published estimates of exclusivity milestones effects on drug prices, showing declines of 6.6%–66.0%, between one and five years after exclusivity milestones, depending on drug, indication, and geographic settingCitation23,Citation61,Citation62. Similar to previous literature, this study found that changes in average molecule prices after exclusivity milestones were driven by biosimilar uptake.
When modeling future expenditures, we projected a significant decline in TNFi expenditures as a share of the total RA treatment market. This decline was due to the impact of exclusivity milestones on prices and decreased utilization as patients switch to the newer JAKinibs class of treatments. Specifically, adalimumab’s share of total RA market expenditures was projected to decrease from 48.0% in 2019 to 26.0% in 2025. Due to increased uptake and the fact that no JAKinib experienced exclusivity milestones during our projection period, JAKinibs share of TIM expenditures was projected to increase from 4.0% to 34.0% between 2019 and 2025.
With the potential of biosimilars to decrease overall spending, many payers implement utilization restrictions on biologics. Making expensive biologics more difficult to access may be less effective in reducing long-term cost given an upcoming exclusivity milestones event. Although small molecule drugs are often subjected to “generics-first” policiesCitation63, no such policies exist for biologic drugs. Payers should make sure to keep access to TNFis and their biosimilars, in the face of upcoming exclusivity milestones.
Limitations
The primary limitation of this study is that the results rest on the assumption that market dynamics in US markets for anemia, multiple sclerosis, neutropenia, and RA therapeutic classes are suitable to inform pricing projections for the broader RA market. Among US biologics, markets chosen were the only ones experiencing major exclusivity milestones events during the study period, a fact that makes them particularly relevant to the primary estimation problem. However, the small sample of biologic exclusivity milestones in the US and the molecule-quarter unit of analysis may have led to a lack of statistical significance for RDD results.
This study has other data and methodological limitations as well. The disaggregation approach for measuring drug utilization by indication does not account for potential off-label use, a limitation that we cannot address given the nature of our primary data source and the fact that frequency of off-label use is both highly context-dependent and not available for all molecules in our sample. Furthermore, our estimates assumed previous price and utilization trends continued and did not account for other changes in market dynamics. Although the study had the benefit of using data through the end of 2019, for some TIMs, past history may not be a good predictor of future price or utilization trends. The projected market utilization and expenditure may vary because of the safety concerns associated with JAKinibs and the recent FDA warnings about the increased risk of serious heart-related events, cancer, blood clots, and death on use of these agents. Thus, readers should consider the results an extrapolated projection rather than an estimated forecast. In addition, treatment utilization estimates for this study were based on indications and do not consider that uptake rates may vary by indication in ways not proportional to disease prevalence. Finally, the study used only US data, and the results of biosimilar entry should not be extrapolated to potential price or expenditure impacts in other countries.
Conclusions
Our study shows considerable variation in uptake of biosimilars and molecule prices following exclusivity milestones in the US. RA molecules experiencing biosimilar competition in the US may experience price decreases—offering potential savings to payers, patients, and society—although magnitude of these estimates depends on biosimilar uptake. Biosimilar competition by itself may have a modest impact on total molecule expenditures. Formulary placement, as well as manufacturer-payer dynamics, may play a role in determining price changes and market uptake of biosimilars. Future research should refine estimates as more biosimilars enter the US market.
Transparency
Declaration of funding
The study was sponsored by Amgen Inc.
Declaration of financial disclosures
MH was an employee and stockholder of Amgen Inc., at the time of conduct of this study; MG and AP are employees of PRECISIONheor, which received financial support from Amgen Inc., for the conduct of this study. At the time of the conduct of this study, JS was an employee of PRECISIONheor, which received financial support from Amgen Inc. for the conduct of this study.
Author contributions
Conception/design of the study: EJMH, JS, MG. Acquisition, analysis, or interpretation of data: JS, MG, AP. Drafting and revising: EJMH, JS, MG, AP
Reviewer disclosures
A reviewer on this manuscript has disclosed that they have provided contractual, advice and analysis for Amgen Canada Inc. (not in this space). The other peer reviewers on this manuscript have no other relevant financial relationships or otherwise to disclose.
Supplemental Material
Download MS Word (370.5 KB)Acknowledgements
Julie Wang, of Amgen Inc., and Lakshmi Narendra Bodduluru, of Cactus Life Sciences (part of Cactus Communications) provided editorial assistance for this manuscript, funded by Amgen Inc.
Data availability statement
The datasets generated and/or analyzed during the current study are available from the corresponding author on reasonable request.
References
- Makurvet FD. Biologics vs. small molecules: drug costs and patient access. Med Drug Discov. 2021;9:100075.
- Medicine use and spending in the U.S.: a review of 2018 and outlook to 2023. IQVIA 2019 Report. [cited 2022 Jan 10]. Available from: https://www.iqvia.com/insights/the-iqvia-institute/reports/medicine-use-and-spending-in-the-us-a-review-of-2018-and-outlook-to-2023.
- Brill A, Ippolito B. The economics of biologic drugs: a further response to Bach et al. [cited 2022 Jan 10].
- Biological Product Definitions. U.S. Food and Drug Administration. [cited 2022 Jan 10]. Available from: https://www.fda.gov/files/drugs/published/Biological-Product-Definitions.pdf.
- Blackstone EA, Fuhr JP. The economics of biosimilars. Am Health Drug Benefits. 2013;6(8):469–478.
- Kabir ER, Moreino SS, Sharif Siam MK. The breakthrough of biosimilars: a twist in the narrative of biological therapy. Biomolecules. 2019;9(9):410.
- FDA Approves Cyltezo, the First Interchangeable Biosimilar to Humira. U.S. Food and Drug Administration. [cited 2022 Jan 10]. Available from: https://www.fda.gov/news-events/press-announcements/fda-approves-cyltezo-first-interchangeable-biosimilar-humira.
- Biosimilars gain widespread adoption by health plans. [cited 2022 Jan 10]. Available from: https://Avalere.com/press-releases/biosimilars-gain-widespread-adoption-by-health-plans.
- Socal MP, Bai G, Anderson GF. Favorable formulary placement of branded drugs in Medicare prescription drug plans when generics are available. JAMA Intern Med. 2019;179(6):832–833.
- Ventola CL. Evaluation of biosimilars for formulary inclusion: factors for consideration by P&T committees. P T. 2015;40(10):680–689.
- Biosimilar product information. FDA-approved biosimilar products. U.S. Food and Drug Administration. [cited 2022 Jan 10]. Available from: https://www.fda.gov/drugs/biosimilars/biosimilar-product-information.
- Top 4 Biosimilar Developments of 2021. [cited 2022 Jan 14]. Available from: https://www.managedhealthcareexecutive.com/view/top-4-biosimilar-developments-of-2021.
- Helmick CG, Felson DT, Lawrence RC, et al. Estimates of the prevalence of arthritis and other rheumatic conditions in the United States: Part I. Arthritis Rheum. 2008;58(1):15–25.
- Safiri S, Kolahi AA, Hoy D, et al. Global, regional and national burden of rheumatoid arthritis 1990–2017: a systematic analysis of the global burden of disease study 2017. Ann Rheum Dis. 2019;78(11):1463–1471.
- Targeted immune modulators for rheumatoid arthritis: Effectiveness & value. Institute for Clinical and Economic Review. [cited 2022 Jan 10]. Available from: https://icer.org/wp-content/uploads/2020/10/ICER_RA_Final_Scoping_Document_050919.pdf.
- The impact of biosimilar competition in Europe. October 2019. IQVIA. [cited 2022 Jan 10]. Available from: https://www.iqvia.com/library/white-papers/the-impact-of-biosimilar-competition-in-europe.
- Inflectra® (infliximab-dyyb) Prescribing Information. [cited 2022 Jan 10]. Available from: https://labeling.pfizer.com/ShowLabeling.aspx?id=9271.
- Renflexis (infliximab-abda) Prescribing Information. [cited 2022 Jan 10]. Available from: https://www.organon.com/product/usa/pi_circulars/r/renflexis/renflexis-pi.pdf.
- Truxima (rituximab-abbs) Prescribing Information. [cited 2022 May 5]. Available from: https://www.truxima.com/globalassets/truxima-dtc/pdfs/truxima-prescribing-information.pdf.
- Ruxience (rituximab-pvvr) Prescribing Information. [cited 2022 May 5]. Available from: https://labeling.pfizer.com/ShowLabeling.aspx?id=12090.
- Riabni (rituximab-arrx) Prescribing Information. [cited 2022 July 23]. Available from: https://www.pi.amgen.com/-/media/Project/Amgen/Repository/pi-amgen-com/Riabni/riabni_pi_english.pdf.
- Bhattacharya J, Vogt WB. A simple model of pharmaceutical price dynamics. J Law Econ. 2003;46(2):599–626.
- Vondeling GT, Cao Q, Postma MJ, et al. The impact of patent expiry on drug prices: a systematic literature review. Appl Health Econ Health Policy. 2018;16(5):653–660.
- Reynolds A, Koenig AS, Bananis E, et al. When is switching warranted among biologic therapies in rheumatoid arthritis? Expert Rev Pharmacoecon Outcomes Res. 2012;12(3):319–333.
- Dolinar R, Kohn CG, Lavernia F, et al. The non-medical switching of prescription medications. Postgrad Med. 2019;131(5):335–341.
- Manova M, Savova A, Vasileva M, et al. Comparative price analysis of biological products for treatment of rheumatoid arthritis. Front Pharmacol. 2018;9:1070.
- Singh JA, Saag KG, Bridges SL, Jr, et al. 2015 American college of rheumatology guideline for the treatment of rheumatoid arthritis. Arthritis Rheumatol. 2016;68(1):1–26.
- Enabling competition in pharmaceutical markets. [cited 2022 Jan 10]. Available from: https://www.brookings.edu/research/enabling-competition-in-pharmaceutical-markets/.
- Miller S, Houts J. Potential savings of biogenerics in the United States. St Louis: Express Scripts; 2007. [cited 2022 Jan 10]. Available from: https://www.proquest.com/docview/207119687.
- Congressional Budget Office Cost estimate: S. 1695 Biologics Price Competition and Innovation Act of 2007. [cited 2022 Jan 10]. Available from: https://www.cbo.gov/sites/default/files/110th-congress-2007-2008/costestimate/s16950.pdf.
- National Academies of Sciences, Engineering, and Medicine; Health and Medicine Division; Board on Health Care Services; Committee on Ensuring Patient Access to Affordable Drug Therapies; Nass SJ, Madhavan G, Augustine NR, editors. Making Medicines Affordable: A National Imperative. Washington (DC): National Academies Press (US); 2017. [cited 2017 Nov 30]. Available from: https://www.ncbi.nlm.nih.gov/books/NBK493094/.
- Chandra A, Vanderpuye-Orgle J. Competition in the age of biosimilars. JAMA. 2015;314(3):225–226.
- Grabowski H, Guha R, Salgado M. Biosimilar competition: lessons from Europe. Nat Rev Drug Discov. 2014;13(2):99–100.
- Hung A, Vu Q, Mostovoy L. A systematic review of US biosimilar approvals: what evidence does the FDA require and how are manufacturers responding? J Manag Care Spec Pharm. 2017;23(12):1234–1244.
- Kawalec P, Stawowczyk E, Tesar T, et al. Pricing and reimbursement of biosimilars in Central and Eastern European countries. Front Pharmacol. 2017;8:288.
- Lanthier M, Behrman R, Nardinelli C. Economic issues with follow-on protein products. Nat Rev Drug Discov. 2008;7(9):733–737.
- Mulcahy AW, Hlavka JP, Case SR. Biosimilar cost savings in the United States: initial experience and future potential. Rand Health Q. 2018;7(4):3.
- Mulcahy AW, Predmore Z, Mattke S. The cost savings potential of biosimilar drugs in the United States. Santa Monica, CA: RAND Corporation, PE-127-SANI, 2014.
- Nabhan C, Parsad S, Mato AR, et al. Biosimilars in oncology in the United States: a review. JAMA Oncol. 2018;4(2):241–247.
- Sussell J, Vanderpuye-Orgle J, Vania D, et al. Understanding price growth in the market for targeted oncology therapies. Am J Manag Care. 2019;25(6):273–277.
- Rocco P, Eberini I, Musazzi UM, et al. Glatiramer acetate: a complex drug beyond biologics. Eur J Pharm Sci. 2019;133:8–14.
- Biomedtracker. Informa Pharma Intelligence. [cited 2022 Jan 10]. Available from: https://www.biomedtracker.com/.
- AbbVie, Amgen settlement sets Humira U.S. biosimilar launch for 2023. [cited 2022 Jan 10]. Available from: https://www.reuters.com/article/us-abbvie-amgen-humira-idUSKCN1C32G5.
- Suda KJ, Halbur DJ, Hunkler RJ, et al. Spending on hepatitis C antivirals in the United States, 2009–2015. Pharmacotherapy. 2017;37(1):65–70.
- Yarbrough CR. How protected classes in Medicare part D influence U.S. drug sales, utilization, and price. Health Econ. 2020;29(5):608–623.
- Grabowski H, Long G, Mortimer R. Recent trends in Brand-name and generic drug competition. J Med Econ. 2014;17(3):207–214.
- Grabowski H, Long G, Mortimer R, et al. Updated trends in US brand-name and generic drug competition. J Med Econ. 2016;19(9):836–844.
- Hemphill CS, Sampat BN. Evergreening, patent challenges, and effective market life in pharmaceuticals. J Health Econ. 2012;31(2):327–339.
- HUMIRA (adalimumab) Injection. Prescribing information. North Chicago, IL: AbbVie Inc.
- Cessak G, Kuzawińska O, Burda A, et al. TNF inhibitors–mechanisms of action, approved and off-label indications. Pharmacol Rep. 2014;66(5):836–844.
- Gerriets V, Bansal P, Goyal A, et al. Tumor necrosis factor inhibitors. In StatPearls. Treasure Island (FL): StatPearls Publishing; 2022.
- Snider JT, Sussell J, Tebeka MG, et al. Challenges with forecasting budget impact: a case study of six icer reports. Value Health. 2019;22(3):332–339.
- Imbens GW, Lemieux T. Regression discontinuity designs: a guide to practice. J Econom. 2008;142(2):615–635.
- Lee DS, Lemieux T. Regression discontinuity designs in economics. J Econ Lit. 2010;48(2):281–355.
- Thistlethwaite DL, Campbell DT. Regression-discontinuity analysis: an alternative to the ex post facto experiment. J Educ Psychol. 1960;51(6):309–317.
- Kolesár M, Rothe C. Inference in regression discontinuity designs with a discrete running variable. Am Econ Rev. 2018;108(8):2277–2304.
- Calonico S, Cattaneo MD, Farrell MH. On the effect of bias estimation on coverage accuracy in nonparametric inference. J Am Stat Assoc. 2018;113(522):767–779.
- Calonico S, Cattaneo MD, Farrell MH, et al. Rdrobust: software for regression-discontinuity designs. Stata J. 2017;17(2):372–404.
- Congressional Budget Office. Processes. [cited 2022 Jan 10]. Available from: https://www.cbo.gov/about/processes#methodology.
- National Health Expenditure Data. Spillovers in health care markets: implications for current law projections; Dec 10, 2022.
- Aladul MI, Fitzpatrick RW, Chapman SR. Impact of infliximab and etanercept biosimilars on biological disease-modifying antirheumatic drugs utilisation and NHS budget in the UK. BioDrugs. 2017;31(6):533–544.
- Castanheira M, Ornaghi C, Siotis G. The unexpected consequences of generic entry. J Health Econ. 2019;68:102243.
- Dusetzina SB, Cubanski J, Nshuti L, et al. Medicare part D plans rarely cover brand-name drugs when generics are available: study examines Medicare part D coverage to quantify how often brand-name drugs are designated preferred over generics. Health Aff. 2020;39(8):1326–1333.