
 ?Mathematical formulae have been encoded as MathML and are displayed in this HTML version using MathJax in order to improve their display. Uncheck the box to turn MathJax off. This feature requires Javascript. Click on a formula to zoom.
Abstract
Objectives
Preterm birth occurs in more than 10% of U.S. births and is the leading cause of U.S. neonatal deaths, with estimated annual costs exceeding $25 billion USD. Using real-world data, we modeled the potential clinical and economic utility of a prematurity-reduction program comprising screening in a racially and ethnically diverse population with a validated proteomic biomarker risk predictor, followed by case management with or without pharmacological treatment.
Methods
The ACCORDANT microsimulation model used individual patient data from a prespecified, randomly selected sub-cohort (N = 847) of a multicenter, observational study of U.S. subjects receiving standard obstetric care with masked risk predictor assessment (TREETOP; NCT02787213). All subjects were included in three arms across 500 simulated trials: standard of care (SoC, control); risk predictor/case management comprising increased outreach, education and specialist care (RP-CM, active); and multimodal management (risk predictor/case management with pharmacological treatment) (RP-MM, active). In the active arms, only subjects stratified as higher risk by the predictor were modeled as receiving the intervention, whereas lower-risk subjects received standard care. Higher-risk subjects’ gestational ages at birth were shifted based on published efficacies, and dependent outcomes, calibrated using national datasets, were changed accordingly. Subjects otherwise retained their original TREETOP outcomes. Arms were compared using survival analysis for neonatal and maternal hospital length of stay, bootstrap intervals for neonatal cost, and Fisher’s exact test for neonatal morbidity/mortality (significance, p < .05).
Results
The model predicted improvements for all outcomes. RP-CM decreased neonatal and maternal hospital stay by 19% (p = .029) and 8.5% (p = .001), respectively; neonatal costs’ point estimate by 16% (p = .098); and moderate-to-severe neonatal morbidity/mortality by 29% (p = .025). RP-MM strengthened observed reductions and significance. Point estimates of benefit did not differ by race/ethnicity.
Conclusions
Modeled evaluation of a biomarker-based test-and-treat strategy in a diverse population predicts clinically and economically meaningful improvements in neonatal and maternal outcomes.
PLAIN LANGUAGE SUMMARY
Preterm birth, defined as delivery before 37 weeks’ gestation, is the leading cause of illness and death in newborns. In the United States, more than 10% of infants are born prematurely, and this rate is substantially higher in lower-income, inner-city and Black populations. Prematurity associates with greatly increased risk of short- and long-term medical complications and can generate significant costs throughout the lives of affected children. Annual U.S. health care costs to manage short- and long-term prematurity complications are estimated to exceed $25 billion.
Clinical interventions, including case management (increased patient outreach, education and specialist care), pharmacological treatment and their combination can provide benefit to pregnancies at higher risk for preterm birth. Early and sensitive risk detection, however, remains a challenge.
We have developed and validated a proteomic biomarker risk predictor for early identification of pregnancies at increased risk of preterm birth. The ACCORDANT study modeled treatments with real-world patient data from a racially and ethnically diverse U.S. population to compare the benefits of risk predictor testing plus clinical intervention for higher-risk pregnancies versus no testing and standard care. Measured outcomes included neonatal and maternal length of hospital stay, associated costs and neonatal morbidity and mortality. The model projected improved outcomes and reduced costs across all subjects, including ethnic and racial minority populations, when predicted higher-risk pregnancies were treated using case management with or without pharmacological treatment. The biomarker risk predictor shows high potential to be a clinically important component of risk stratification for pregnant women, leading to tangible gains in reducing the impact of preterm birth.
Introduction
Preterm birth (PTB), defined as delivery earlier than 37 weeks’ gestational age (GA), occurs in approximately 10% of all births and is the leading cause of neonatal deaths in the United StatesCitation1,Citation2. PTB can occur spontaneously (sPTB) or be medically indicated due to concern for the health of the mother or baby. In addition to neonatal morbidity and mortality, the economic impact of PTB is enormous, exceeding $25 billion USD annuallyCitation3. The direct medical care burden, accounting for most of these costs, increases markedly as GA at birth decreases.
Effective intervention to ameliorate PTB and its sequelae requires earlier identification of at-risk pregnancies. A history of prior sPTB, which is a preterm delivery resulting from either spontaneous labor onset, premature rupture of membranes (“water breaking”), or both, is a traditional predictor of PTB but is seen in only approximately 4% of all U.S. pregnancies and predicts only 11% of all sPTBsCitation4,Citation5. Similarly, premature cervical shortening is a widely used predictor of sPTB but has a prevalence of only 2% in U.S. pregnancies and captures only 6% of all sPTBs beyond those identified by prior historyCitation6,Citation7. Furthermore, the use of prior sPTB as a risk factor is not applicable in first pregnancies, while measurement of cervical length requires additional health care resources. Beyond these clinical risk factors, it is well documented that socioeconomically challenged and ethnic and racial minority populations are at substantially greater risk, with many factors in these groups contributing to increased riskCitation3. In particular, PTB rates in the United States in 2020 were 9.1% among non-Hispanic White individuals, 9.8% in Hispanic individuals, and 14.4% among non-Hispanic Black individualsCitation2. There is a clear need for sensitive predictive approaches that apply to all at-risk individuals.
Biomarker-based risk stratification tools offer a precision diagnostic approach to predict increased risk of PTB, particularly among those who show no apparent clinical signs, well in advance of deliveryCitation8. In the prospective Proteomic Assessment of Preterm Risk study (PAPR; NCT01371019), Saade et al.Citation9 described and clinically validated a novel serum proteomic biomarker risk predictor for sPTB that combines the expression ratio of insulin-like growth factor-binding protein 4 (IBP4) to sex hormone-binding globulin (SHBG) with clinical variables. The mass spectrometry assay measuring the IBP4/SHBG ratio has been analytically validatedCitation10. This risk predictor, which identifies 75% of sPTBs, has been reported also to be predictive of indicated PTBCitation11. In a separate clinical utility study, the predictor was shown to benefit patients with PTB (encompassing both sPTB and indicated PTB), as evidenced by reduced neonatal intensive care unit length of stay (LOS) amongst those babies admitted due to PTB in generalCitation12. The PAPR analysis also established a predictive biomarker threshold score that significantly stratifies premature from later GAs at birth and corresponds to a 15% risk – double the average risk of sPTB across U.S. singleton pregnanciesCitation3. This threshold was validated in a secondary analysisCitation13 of the independent, prospective Multicenter Assessment of a Spontaneous Preterm Birth Risk Predictor study (TREETOP; NCT02787213)Citation14. The sensitivity of identifying preterm pregnancies was demonstrated to be 88% at the validated thresholdCitation9,Citation15.
Identifying PTB risk with higher sensitivity than can be achieved using clinical risk factors alone enables precision medicine focus on more at-risk patients using interventions under active study, including intensive case management (increased outreach, PTB education and specialist care)Citation16–18, pharmaceutical treatmentCitation4,Citation6 or their combinationCitation12. The purpose of the current analysis, named ACCORDANT (Analyses aCross Congruent studies ReDucing Adverse pregNancy ouTcomes), was to assess the cost effectiveness of two test-and-treat strategies relative to standard care from a healthcare payer perspective. ACCORDANT modeled differences in outcomes including neonatal and maternal lengths of hospital stay (LOS), neonatal costs, and neonatal morbidity and mortality in a diverse U.S. pregnant population. A secondary analysis of the TREETOP study, ACCORDANT used proteomic biomarker risk predictor results to stratify subjects into PTB risk groups, then applied models of existing clinical interventions to individuals predicted to be at higher risk for premature delivery.
Methods
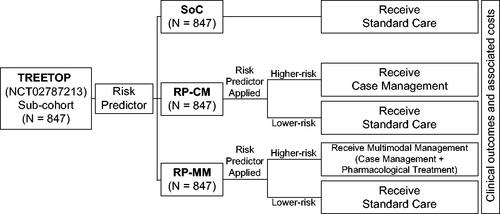
ACCORDANT was conducted according to a prespecified plan, with the components listed below. A study overview appears in . The analysis employed a microsimulation of pregnant individuals from a healthcare payer perspective, assessed from the second trimester of pregnancy through post-delivery maternal and neonatal discharge. The rationale for this methodology was to assess the range of effects on clinical and economic outcomes of modeled interventions in an actual population of pregnant women determined to be at elevated risk by the risk predictor. This report was prepared in alignment with Consolidated Health Economic Evaluation Reporting Standards (CHEERS) 2022 guidanceCitation19,Citation20. All costs were measured and reported in 2019 U.S. dollars.
Figure 1. Schematic overview of the ACCORDANT study. ACCORDANT subjects (N = 847) were routed to three study arms: standard care (SoC) control; risk predictor plus case management intervention (RP-CM); or risk predictor plus multimodal management intervention (case management with pharmacological treatment) (RP-MM). Those in the RP-CM and RP-MM arms were stratified into higher-risk and lower-risk groups based on their proteomic biomarker risk predictor scores, using a previously validated threshold. Subjects predicted to be at higher preterm birth risk were modeled to receive case management or multimodal management. Lower-risk subjects in the RP-CM and RP-MM arms received standard care. The gestational ages at birth of higher-risk subjects were shifted according to published intervention efficacies. Associated outcomes were calculated for the treated groups and for subjects with missing or truncated data in both arms. Outcomes were compared between active arms and the control arm, as a whole and between the most severely affected 10% of each arm by outcome.
ACCORDANT study population
The study population comprised a sub-cohort (N = 847) of subjects enrolled in the Multicenter Assessment of a Spontaneous Preterm Birth Risk Predictor study (TREETOP; NCT02787213)Citation14. TREETOP was an observational study of pregnant women across the United States who were deemed not to be at higher risk for PTB using previous sPTB history or cervical length measurement. Study subjects were independent from those used to develop the risk predictorCitation9 and assess intervention efficacyCitation12,Citation16–18, and they had not been used in previous modeling studies. Subjects represented a geographically, ethnically, and racially diverse cohort of women receiving care at 18 U.S. tertiary care centers. Race and ethnicity were self-identified by participants, and diversity in the cohort was ensured by intentional over-enrollment of Black (19.3% versus 16.9% nationally) and Hispanic (39.2% versus 19.9% nationally) individualsCitation21. Clinical management of patients was via standard of care, as risk predictor test results were masked. Outcomes were observed in TREETOP through the end of the neonatal period (28 days). A sub-cohort of subjects was selected randomly by a third-party statistician as part of a planned first-phase analysis of 34% of TREETOP study completers, with the remainder of subjects reserved for future validation studies. This representative sub-cohort reflected the demographic makeup of the overall study. The TREETOP study was approved by the Institutional Review Board at each participating center, and all participants provided written informed consent prior to study enrollment.
Study arms
Three arms were modeled: (1) a control arm of standard care (SoC) as practiced in TREETOP; (2) an active arm of risk predictor stratification of higher-risk pregnancies to case management (RP-CM) designated as the base case; and (3) an active arm of risk predictor stratification of higher-risk pregnancies to multimodal management (case management with pharmacological intervention) (RP-MM). In both active arms, case management included increased outreach, education and specialist care, reflecting current clinical practice scenarios, and the effects of the two interventions were modeled as a shift in GA at birth. Outcomes were assigned dependent upon GA at birth, actual or modeled depending on the study arm and risk predictor test result.
Studies of interventions to ameliorate PTB risk and effects have reported changes in distribution of GA at birth with treatmentCitation12,Citation16–18. These distributional changes can be accurately quantified as shifts in GA at birth upon treatment that depend on the untreated GA, with larger GA shifts amongst the earliest births and decreasing shifts as GA increases. Therefore, the analysis did not anticipate a significant change in overall PTB rate, nor a shift in mean or median GA at birth across the study population, as most births were term births and were unaffected. The RP-CM and RP-MM arm models, derived from such studies, respectively incorporated expected literature-based probabilistic shifts in GA at birth calculated as a function of the GA at birth observed without intervention in TREETOP. Specifically, the RP-CM and RP-MM models provided GA-specific means and standard deviations of shifts in GA at birth with treatment, relative to TREETOP GA at birth. For each treated subject, the observed GA at birth was shifted by an amount selected randomly from a normal distribution. The mean and standard deviation of the distribution were set by sigmoid functions (Supplemental Figure 1) fitted to tables of numbers of deliveries by GA for untreated and treated women in the intervention studies. The normal distribution derived for each subject represented the expected range of changes in GA at birth with RP-CM or RP-MM strategies compared with SoC, representing the uncertainty in assigning values to the variable shift in GA. Coefficients used in the sigmoid functions are specified in . For illustration, magnitudes of mean shift in GA at birth in each active arm are presented for weeks 28–36 in and Supplemental Table 2.
Figure 2. Shifts in gestational ages at birth applied to subjects who were predicted to be at higher risk for preterm birth and subsequently modeled to receive case management (increased outreach, preterm education and specialist care) or multimodal management (case management with pharmaceutical treatment). Shifts were based on published intervention efficacies.
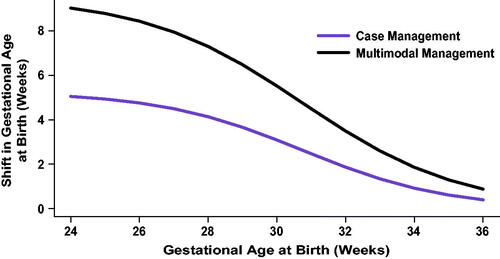
Table 1. Summary of ACCORDANT assumptions.
Outcomes
Measured outcomes included maternal and total neonatal hospital LOS, (comprising both neonatal intensive care unit and nursery care), neonatal costs, and neonatal morbidity and mortality. Data sources used for simulated outcomes are detailed as follows and summarized in .
Model inputs
Input data on GA at birth and clinical outcomes in the SoC arm were sourced from TREETOP. Clinical data were recorded electronically, monitored onsite, and were subject to predefined source document verification. PTB outcomes were adjudicated by an independent panel of three physicians.
TREETOP was the source of a multinomial model of neonatal morbidity and mortality dependent on GA at birth. California and national data (defined below as MIX and COM, respectively) provided the dependence of maternal and neonatal hospital LOS and neonatal cost on GA at birthCitation22,Citation23. Efficacy of interventions for PTB reduction was derived from published studies of stratification of higher-risk pregnancies to RP-CMCitation12,Citation16–18 or RP-MMCitation12 intervention strategies.
Each microsimulation subject had been enrolled in TREETOP with records of maternal and neonatal outcomes adjudicated based on prevailing definitions. Each subject was assigned her own observed TREETOP outcomes unless she was stratified to receive interventions in the RP-CM or RP-MM arms. In instances when a datapoint was missing for any subject, a simulated outcome was assigned.
Risk stratification
In TREETOP, the risk predictor was assayed in all subject samples as they were collected during GA weeks 191/7–206/7, using a validated and standardized laboratory processCitation9,Citation10 that was consistent with clinical intended use. In ACCORDANT, each subject’s laboratory measurement was compared to the validated risk threshold at about twice the baseline rate in U.S. singleton pregnancies, or 15% riskCitation9,Citation13, stratifying subjects to higher- and lower-risk groups.
Simulated interventions
In the RP-CM and RP-MM arms, interventions were applied only to subjects whose risk predictor scores indicated higher PTB risk. Subjects stratified as lower risk in these two arms received standard care. The RP-CM intervention model was based on results from three controlled studiesCitation16–18 on the effect of case management applied to pregnancies stratified to treatment, with higher-risk status determined by pre-specified clinical and/or demographic risk factors. Shifts in GA at birth for the RP-CM model, as indexed by untreated GA at birth, were derived using the metafor R packageCitation29. The RP-MM intervention model was based on the observed effect on GA at birth of applying case management with pharmaceutical treatment (17-α-hydroxyprogesterone caproate). The intervention effect model was fitted to data from the Prediction and Prevention of Preterm Birth studyCitation12 (PREVENT-PTB, NCT03530332), a randomized controlled trial that followed women at otherwise low PTB risk assigned to standard care or to risk predictor screening followed by multimodal interventions. Costs of case management were estimated from the U.S. Centers for Medicare & Medicaid Services physician fee schedule for PREVENT-PTB protocol care (). Costs of pharmaceutical treatment were as publishedCitation25–28.
Neonatal and maternal length of hospital stay
After intervention and to replace missing or truncated TREETOP data, neonatal and maternal hospital LOS were sourced from reports of LOS and associated costs stratified by GA in two studies of large datasets collected in the United States: one (MIX) was based on California state data with a mix of payersCitation22; and the other (COM) was based on commercial payer dataCitation23. MIX and COM support generalizability as their datasets included over 1,000,000 and 750,000 pregnancies, respectively. Neonatal and maternal LOS were indexed by weeks of GA at birth and were mapped to microsimulation subjects based on GA.
Neonatal costs
Neonatal costs associated with the birth hospital admission were generated from MIXCitation22 and COMCitation23 along with LOS, enabling reproduction of the published relationships between cost and LOS. The two datasets reported costs in U.S. dollars. Costs were adjusted to April 2019 values, corresponding to the end of the TREETOP study, using the Producer Price Index by IndustryCitation24 then indexed by weeks of GA at birth and assigned to microsimulation subjects on this basis. The analysis modeled gross savings independent of test price.
Neonatal morbidity and mortality
Assessment of neonatal morbidity and mortality was based on an established scoring systemCitation6. Affected infants were assigned a morbidity and mortality index score that increased from 1 (mild) to 2 (moderate) to 3 (severe) for each additional diagnosis of one of the following: respiratory distress syndrome; bronchopulmonary dysplasia; intraventricular hemorrhage grade III or IV; all stages of necrotizing enterocolitis; periventricular leukomalacia or proven severe sepsis. A score of 4 was assigned to perinatal mortality. The scale used hospital stays to determine index scores if the LOS gave a higher score than did concomitant diagnoses: 1–4 days gave a score of 1; 5–20 days a score of 2; and >20 days a score of 3. For example, level 1 included neonates with at most one adverse outcome and up to four days of hospital stay. While the scale accounts for neonatal intensive care unit stays, total neonatal hospital LOS was used here instead to leverage the universality of hospital admission and for greater simplicity in calculating hospital LOS versus level of care.
Microsimulation subjects received initial neonatal morbidity and mortality index score probabilities based on TREETOP observations (shown in Supplemental Table 1). Probabilities of each level of neonatal morbidity and mortality during each week of GA at birth were derived from TREETOP observations, with smoothing. New index scores resulting from intervention were generated as follows: (1) the GA week change was generated from the intervention; (2) the distribution of index scores was obtained from Supplemental Table 1; and (3) the new index score was generated on each simulation by selecting from this distribution.
Outcome measurement
For microsimulation subjects, measured outcomes were either within error ranges for the values observed in TREETOP if unaffected by intervention, mortality or absent data; otherwise, they were assigned as a function of GA at birth. Microsimulation of study arms generated GAs at birth for either the base distribution (SoC) or shifted distributions (RP-CM and RP-MM). Outcomes were derived from calibrated calculations as probabilistic functions of GA at birth.
Post-intervention LOS and missing or truncated TREETOP neonatal LOS information were simulated. TREETOP truncated collection of LOS for each mother and neonate at 28 days post-delivery, affecting measurements of neonatal but not maternal LOS available for ACCORDANT subjects.
Neonatal LOS was generated by drawing random samples from distributions developed from the COM and MIX data. For each GA at birth, the method of moments was used to derive blended gamma and lognormal distributions from published means and variances. Calibration to source data was confirmed by agreement with published nonparametric estimates. The distributions also were confirmed to be calibrated to the distributions of LOS in TREETOP up to the limit of data collection, reducing artifactual divergence of observed and simulated values. Based on the published observation in COMCitation23 that late-preterm LOS distributions were shaped differently than were early-preterm distributions, distinct distributions were applied to early and late preterm GAs at birth (). A random draw from either the MIX or the COM distribution replaced LOS for subjects whose GA at birth was shifted by intervention and for those with missing/truncated data. For subjects with no GA shift and with valid data, LOS was adjusted based on random draws relative to TREETOP observations by up to the estimated error of LOS measurement of 1 day). Maternal LOS was determined similarly, except only MIX was used. (Maternal LOS was not available in COM.)
Per-day neonatal costs were calculated using the GA-specific total cost and associated LOS in the birth admission separately for the MIX and COM. These per-diem costs were then applied to the LOS assigned to microsimulation subjects. Derivation of simulated cost from simulated LOS maintained the known tight association of cost and LOS and used the probabilistic distribution already generated by the neonatal LOS model. Subjects who underwent intervention also were assigned an intervention cost from weeks 22–35 for progesterone treatment and/or case management (see for details).
ACCORDANT subjects were assigned an initial neonatal morbidity and mortality index score based on TREETOP observations. If the subject’s GA at birth changed, neonatal morbidity and mortality was updated based on multinomial distributions derived from TREETOP and indexed by GA at birth (Supplemental Table 1). As the neonatal morbidity and mortality index is an ordinal scale without numeric error, and as the interventions modeled have been shown to do no detectable harmCitation12,Citation16–18, modeled neonatal morbidity and mortality was restricted to the original observation in untreated subjects and to values no greater than the original observation in treated subjects.
Validation
Face validity was evaluated by expert opinion on model structure, data sources, time horizon and outcomesCitation30. For internal validity, models were calibrated against their source data, code was checked by a separate programmer, and selection of statistical tests was subject to external review. Outlier values were traced and explored. In partially dependent external validation, cost results were compared to the decision-analytic model used in a separate risk predictor cost-effectiveness studyCitation31, and results for RP-MM were compared to direct observation of PREVENT-PTB outcomesCitation12. Sources for predictive validity were unavailable at the time of the analysis.
Uncertainty and statistical analysis
In each simulated trial, all subjects participated in the RP-CM, RP-MM and SoC arms. The routing of all subjects to each arm allowed for demographically unbiased comparisons among arms. While the matched design enabled paired tests or tests of repeated measures, a conservative assumption of independence was applied across arms. For LOS and neonatal cost outcomes, MIX was chosen as the base case, while COM was employed to add variation to the base case. To achieve robust results and assess variance, 500 trial simulations were performed. This number was chosen as a compromise between computational cost and stability of estimates. Effects were quantitated as the median and interquartile range (IQR) across the 500 trials. Analysis of demographic subgroups was underpowered and therefore was assessed as point estimates only.
Representations of uncertainty, standard deviations representing parameter uncertainty and assumptions for study implementation are detailed in . Intervention effects and intervention-dependent outcomes were generated as probabilistic distributions, capturing uncertainty of model and outcome parameters. In each active arm, uncertainty in GA shifts was modeled as random normal error. To address the variability of both long and short LOS, uncertainty was modeled as a mixture of lognormal and gamma distributions.
Significance of changes in neonatal and maternal LOS due to treatment was assessed by a prespecified time-to-event analysis. While multiple approaches give similar results, Cox proportional hazards regression p-values were reported here for the main effect of study arm, either in the study as a whole or in the top 10% of subjects per arm per outcome.
Significance of changes in the number of subjects in each neonatal morbidity and mortality level was assessed using a one-sided Fisher’s Exact test. A one-sided test was pre-specified, as the outcome of interest was reduction in occurrence of higher index scores of neonatal morbidity and mortality, and the modeled interventions have been shown to do no detectable harmCitation12,Citation16–18.
Changes in cost with treatment were assessed by a prespecified bootstrap test of total costs, either in each arm as a whole or in the top 10% of neonates per arm by cost. As cost of prematurity is largely driven by the birth admission, uncertainty in LOS also provided uncertainty in cost. Cost distributions were generated from neonatal LOS distributions through multiplication by GA per-diem costs. Thus, cost uncertainty was derived directly from uncertainty in LOS.
Statistical analyses were performed in R (3.5.1 or higher; Microsoft R Application NetworkCitation32) As this study was exploratory as per International Society for Pharmacoeconomics and Outcomes Research (ISPOR) classificationCitation33, p-values < 0.05 were considered significant.
Results
Of 847 subjects, 308 in the two active arms were identified as having higher PTB risk. Amongst these subjects, the racial and ethnic distribution was 22.4% Black, 47.4% Hispanic, 24% White and 6.2% other groups; this represented a 1.5-fold increase in Black and 1.7-fold increase in Hispanic representation relative to White or other groups (Supplemental Table 3). Application of interventions to higher-risk individuals resulted in median prolongation of gestation of less than one day (RP-CM, 0.3 days; RP-MM, 0.8 days) compared with controls (SoC arm). However, for the subgroup comprising the lowest 10% for GA at birth, the median prolongation of gestation was three days (IQR, 0.64 days) for the RP-CM arm and eight days (IQR, 0.34 days) for the RP-MM arm relative to the SoC arm.
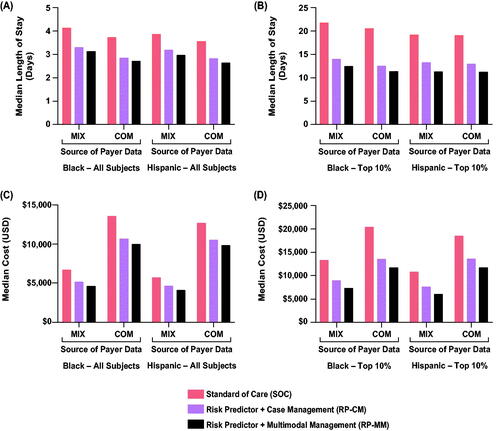
and Supplemental Table 4 detail the impact of the two active arms on neonatal hospital LOS. Across all subjects, neonatal LOS was reduced in the RP-CM arm by 19% (MIX; IQR, 14–23%) and 22% (COM; IQR, 17–26%) and in the RP-MM arm by 26% (MIX; IQR, 22–29%) and 30% (COM; IQR, 25–33%) compared with the SoC arm. For subjects in the top 10% of neonatal LOS, stay was reduced in the RP-CM arm by 33% (MIX; IQR, 25–40%) and 34% (COM; IQR, 26–40%) and in the RP-MM arm by 46% (MIX; IQR, 41–52%) and 47% (COM; IQR, 41–52%) relative to the SoC arm. In all cases, regardless of the active arm or outcome dataset, neonatal LOS reductions versus the control arm were significant. Among self-identified Black individuals, median neonatal hospital LOS point estimates in the base-case scenario (RP-CM) were estimated to fall by 20% (MIX) and 25% (COM) across all subjects and by 35% (MIX) and 39% (COM) in the top 10% of neonatal LOS (; Supplemental Table 5). Among self-identified Hispanic individuals, point estimates of neonatal LOS were seen to be reduced by 17% (MIX) and 21% (COM) across all subjects and by 31% (MIX) and 32% (COM) in the top 10% of neonatal LOS (; Supplemental Table 5). Greater reductions in LOS were estimated when pharmacological treatment (RP-MM) was included.
Figure 3. Impact of test-and-treat strategies on neonatal length of hospital stay. The population assessed was either (A) all subjects or (B) those in the top 10% with respect to length of stay. *p < .05, determined using Cox proportional hazards regression. **p < .001.
Abbreviations. COM, U.S. commercial payer dataset; MIX, U.S. state-based dataset with a mix of insurance payers.
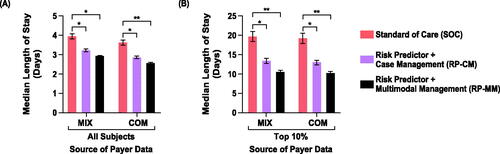
Figure 4. Impact of test-and-treat strategies on neonatal length of hospital stay (A,B) and neonatal costs (C,D) among self-identified Black and Hispanic individuals. The population assessed was either all such subjects (A,C) or those in the top 10% with respect to length of stay or costs (B,D). Abbreviations. COM, U.S. commercial payer dataset; MIX, U.S. state-based dataset with a mix of insurance payers.
Maternal hospital LOS was reduced across all subjects in both the RP-CM (8.5%; IQR, 7–10%) and RP-MM (9.2%; IQR, 8–10%) arms using MIX (Supplemental Table 4). For subjects in the top 10% of maternal LOS, stay was reduced by 16% (IQR, 14–17%) in the RP-CM arm and by 17% (16–19%) in the RP-MM arm. Again, in all cases, the reductions were significant. Maternal LOS point estimates were reduced to a similar degree in Black and Hispanic subgroups (Supplemental Table 5).
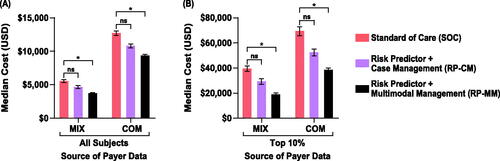
Neonatal costs’ point estimates decreased non-significantly by 16% (MIX IQR, 9–24%; COM IQR, 10–20%) in the RP-CM arm. Point estimates of savings after intervention costs were $900 (MIX) and $2,000 (COM) per screened pregnancy. In the RP-MM arm, neonatal costs across all subjects were significantly reduced, by 34% (MIX; IQR, 29–38%) and 26% (COM, 23–30%), with median savings after intervention costs of $1,800 (MIX) and $3,300 (COM) per pregnancy screened (; Supplemental Table 4). Among RP-CM subjects in the top 10% of neonatal costs, non-significant point estimate decreases of $10,000 (MIX, 27%; IQR, 17–36%) and $17,000 USD (COM; 25%; 16–32%) were seen in cost per screened pregnancy. RP-MM subjects in the top 10% showed significant reductions of $20,000 (MIX, 52%; IQR, 47–57%) and $30,000 (COM, 44%; IQR, 39–49%) per screened pregnancy. The base and sensitivity cost datasets differed in magnitude of cost reduction, with COM cost reductions being approximately double the MIX cost reductions (Supplemental Table 4). However, conclusions from base and sensitivity cost datasets were retained. Among Black individuals, point estimates of neonatal costs in the base-case scenario (RP-CM) decreased by 21% (MIX, COM) across all subjects and by 31% (MIX) and 34% (COM) in the top 10% (; Supplemental Table 5). Among Hispanic individuals, point estimates of neonatal costs were seen to be reduced by 18% (MIX) and 16% (COM) across all subjects and by 29% (MIX) and 26% (COM) in the top 10% (; Supplemental Table 5). Again, further improvements were estimated with the addition of pharmacological treatment (RP-MM).
Figure 5. Impact of test-and-treat strategies on neonatal costs. The population assessed was either (A) all subjects or (B) those in the top 10% with respect to costs. *p < .05, determined using bootstrap intervals. Abbreviations. COM, U.S. commercial payer dataset; MIX, U.S. state-based dataset with a mix of insurance payers; ns, non-significant.
Changes in neonatal morbidity and mortality index scores upon intervention were significant in reduction of the proportion of neonates with scores at or above Level 2 (moderate to severe morbidity or mortality) versus Level 1 (mild morbidity) for both active arms. Reductions in the proportion of neonatal morbidity and mortality Level 2 or higher were 29% (RP-CM) and 41% (RP-MM) (). Comparable decreases also were observed in the Black and Hispanic subgroups, with the proviso that counts of affected babies within subgroups were quite low (Supplemental Table 6).
Table 2. Impact of test-and-treat strategies on neonatal morbidity and mortality.
Discussion
PTB remains the most important complication in obstetrics and neonatology, leading to adverse short- and long-term outcomes for prematurely born neonates. This study assessed the clinical effectiveness and economic benefit of using a risk predictor for identifying higher-risk patients for treatment with well-studied PTB interventions. Our innovative analytical approach combined real-world observational data with simulation of prolonging gestation based on published treatment efficacy to provide real-world effectiveness estimates. We chose several critical metrics to determine whether the modeled studies resulted in improved neonatal outcomes. The results projected significant potential improvements in neonatal morbidity and mortality, neonatal hospital LOS and cost of care. Neonatal improvements occurred without increasing, but rather decreasing, maternal hospital LOS.
The study included a highly diverse racial and ethnic population and demonstrated that the benefits of the prematurity prevention strategy seen in the study population as a whole extended to all minority subgroups. While it is clear that the interventions will need to be applied to a larger proportion of Black and Hispanic women predicted to be at increased sPTB risk, this makes intuitive sense and is clearly worthwhile given the higher known rates of prematurity among these prominent diverse populations. Thus, such a test-and-treat strategy would be promising for groups in this country who are in greatest need of improvement in prematurity-related outcomes.
This study builds upon a previously published modeling studyCitation31, wherein the authors constructed a decision-analytic/Markov cost-effectiveness model evaluating a test-and-treat strategy that used the risk predictor to identify patients at higher risk of PTB, followed by multimodal management. These authors found that the test-and-treat strategy was dominant in most scenarios, including across a range of test sensitivity and specificity values. The current study adds two further assessments: the relationship of risk predictor scores to patient outcomes is based on actual rather than simulated patient data; and a case management intervention is modeled without pharmacological treatments for comparison to multimodal management. Overall, the results modeled in the current analysis are consistent with those observed previously.
In efforts toward identifying and treating of at-risk pregnancies with early interventions (progesterone, cervical cerclage, and others) and acute therapies in symptomatic patients (tocolytics, corticosteroids, magnesium sulfate for neuroprotection and antibiotics). Acute maternal administration of antenatal corticosteroids and magnesium sulfate have been demonstrated to improve outcomes associated with premature deliveryCitation34. Yet the impact of premature delivery has not been materially reduced in the United States. The most consequential cost savings, therefore, are expected when these latter interventions, which can improve clinical outcomes, are applied to the most premature babies.
The current strategy for reducing the consequences of premature delivery is the identification of certain risk factors or specific higher-risk groups and application of approaches that make sense for the etiology associated with their particular risk factor. For small numbers of patients with certain risk factors, an approach such as progesterone therapy for previous preterm delivery or short cervix on endovaginal ultrasound are further examplesCitation4,Citation6,Citation7,Citation35,Citation36. However, these traditional approaches are limited by the fact that risk factors only capture a small percentage (approximately 11%)Citation4,Citation5 of patients who will deliver prematurely, whereas the proteomic biomarker captures the majority (75%) of sPTBsCitation9. Benefit is therefore more likely, since this approach of risk identification holds promise if it identifies a much larger proportion of those destined to deliver prematurely, and intervention or combination of interventions appropriate for the group chosen are appliedCitation31.
While one cannot assume efficacy of progesterone in a broader population, a stronger assertion can be made for studies of the potential benefit for case management. Studies in diverse populations have demonstrated reductions in prematurity, shortened neonatal intensive care unit stays and/or improvements in neonatal morbidity with programs stratifying higher-risk women to case managementCitation16–18,Citation37.
Limitations of this study include the impact of reduced adherence to interventions and the use of data from intervention studies, as opposed to real-world effectiveness. In addition, the ACCORDANT model examined only direct, short-term medical costs; longer-term costs or indirect costs such as decreased workplace or household productivityCitation38, when factored in, would be expected to further enhance the utility of the risk predictor. Strengths of this study include the inclusion of real subjects, the prospective application of the risk predictor to blood samples of these subjects and the development of two intervention models independently of subjects of the microsimulation. Although progesterone for use in women with identifiable risk beyond cervical shortening and previous preterm birth is not established, and adoption of case management has not reached consensus for at risk women, this work suggests that more well-designed controlled studies on these interventions are warranted and have the potential for significant impact. It is important to emphasize that such a risk identification program does not necessarily mean that all those identified to be at higher risk will be amenable to the available interventions to either prevent premature delivery or to ameliorate its consequences. These might include women delivering prematurely due to certain medical complications, such as renal failure, or to obstetrical complications not expected to be preventable, such as placental abruption. When interventions that favorably affect identifiable causes become developed, the risk identification approach will become even more valuable, both from improved outcomes and cost-reduction perspectives.
The results of this modeling exercise are important, demonstrating not only the potential benefits for mothers and babies but also the utility of effectiveness assessments combining real-world data and published evidence. Furthermore, this study provides confidence that future studies and real-world use of test-and-treat strategies are worthwhile, ethically justified for pregnant women and are likely to demonstrate positive results when suitable test performance is paired with interventions inclusive of properly implemented stratified case management. As well, this exercise provides a compelling reason to proceed with prospective studies of progesterone and/or case management in patients identified as higher risk with a well-validated risk predictor for PTB. Finally, these results are based on interventions that are currently used in practice, known to be safe and generally found to be acceptable to pregnant womenCitation16,Citation18,Citation34,Citation39.
Conclusions
High potential exists for the proteomic biomarker risk predictor to be a clinically important component of risk stratification for pregnant women, leading to tangible gains in reducing the impact of PTB.
Transparency
Declaration of funding
This study (funding, study design, execution and reporting) was supported by Sera Prognostics, Inc.
Declaration of financial and other interests
J.B., R.T., A.C.F., A.D.P., T.C.F., T.J.G., J.J.B., J.A.F.Z., G.C.C. and P.E.K. are stockholders, employees or consultants of Sera Prognostics, Inc. All other authors report no conflict of interest.
Author contributions
J.B., G.C.C., J.J.B, and P.E.K conceptualized the study. G.R.M., G.R.S., L.C.L, K.D.H., D.V.C, C.N.S, J.K.B, D.M.H, S.A.L., S.A.S., C.A.M, S.M.W., L.M.P., E.J.S., K.A.B., A.F.H., and A.H.C provided subjects, clinical data, and serum samples for analyses. A.C.F curated data. Formal analyses were done by R.T., J.B. and P.E.K., with methodology designed by J.B, J.J.B, and P.E.K and mentored and reviewed by J.A.F.Z. Code validation was performed by A.D.P. Visualization/data presentation and/or manuscript draft preparation was done by J.B., T.C.F., T.J.G., J.J.B., G.C.C. and P.E.K. The study was supervised by J.J.B. and P.E.K., with P.E.K. serving as project administrator. All authors reviewed, edited, and approved the manuscript.
Reviewer disclosures
Peer reviewers on this manuscript have no relevant financial or other relationships to disclose.
Previous presentations
This study was presented as a poster (Abstract #116429) at the ISPOR (The Professional Society for Health Economics and Outcomes Research) annual conference in Washington, DC, on Wednesday May 18, 2022. In addition, a preprint of this manuscript was published on medRxiv and is available at https://doi.org/10.1101/2021.09.08.21262940.
Supplemental Material
Download PDF (540.6 KB)Acknowledgements
We wish to acknowledge the study coordinators and research personnel at the study sites, the participants in the TREETOP study and the Sera Prognostics, Inc. clinical laboratory and clinical operations teams. Michael Walker, PhD, reviewed statistical test design and selection. Jennifer Logan, PhD, contributed to the writing of this article.
Data availability statement
Data supporting the results presented here can be requested by emailing the corresponding author. Data will not be made available publicly or in any format that may violate a subject’s right to privacy.
References
- Blencowe H, Vos T, Lee AC, et al. Estimates of neonatal morbidities and disabilities at regional and global levels for 2010: introduction, methods overview, and relevant findings from the Global Burden of Disease study. Pediatr Res. 2013;74(Suppl 1):4–16.
- Osterman MJK, Hamilton BE, Martin JA, et al. Births: final data for 2020 (National Vital Statistics Reports Volume 70, Number 17). Centers for Disease Control and Prevention; 2022. [updated 2022 Feb 7; cited 2022 Feb 9]. Available from: https://www.cdc.gov/nchs/nvss/births.htm
- American College of Obstetricians and Gynecologists, Gynecologists’ Committee on practice; Bulletins-Obstetrics. Prediction and prevention of spontaneous preterm birth: ACOG practice bulletin, number 234. Obstet Gynecol. 2021;138(2):e65–e90.
- Petrini JR, Callaghan WM, Klebanoff M, et al. Estimated effect of 17 alpha-hydroxyprogesterone caproate on preterm birth in the United States. Obstet Gynecol. 2005;105(2):267–272.
- Laughon SK, Albert PS, Leishear K, et al. The NICHD consecutive pregnancies study: recurrent preterm delivery by subtype. Am J Obstet Gynecol. 2014;210(2):131 e1–8.
- Hassan SS, Romero R, Vidyadhari D, et al. Vaginal progesterone reduces the rate of preterm birth in women with a sonographic short cervix: a multicenter, randomized, double-blind, placebo-controlled trial. Ultrasound Obstet Gynecol. 2011;38(1):18–31.
- McIntosh J, Feltovich H, Berghella V, et al. The role of routine cervical length screening in selected high- and low-risk women for preterm birth prevention. Am J Obstet Gynecol. 2016;215(3):B2–7.
- Gyamfi-Bannerman C, Ananth CV. Trends in spontaneous and indicated preterm delivery among singleton gestations in the United States, 2005–2012. Obstet Gynecol. 2014;124(6):1069–1074.
- Saade GR, Boggess KA, Sullivan SA, et al. Development and validation of a spontaneous preterm delivery predictor in asymptomatic women. Am J Obstet Gynecol. 2016 May;214(5):633.e1-633–e24.
- Bradford C, Severinsen R, Pugmire T, et al. Analytical validation of protein biomarkers for risk of spontaneous preterm birth. Clin Mass Spectrom. 2017;3:25–38.
- Boggess K, Saade GR, Sullivan SA, et al. Use of a second trimester serum-based proteomic risk classifier for prediction of spontaneous and medically-indicated preterm birth. Presented at the 37th Annual Meeting of the Society for Maternal Fetal Medicine 23–28 January 2017, Poster #336. Am J Obstet Gynecol. 2017;216(1):S204–S205.
- Branch DW, VanBuren JM, Porter TF, et al. Prediction and prevention of preterm birth: a prospective, randomized intervention trial. Am J Perinatol. 2021. DOI:10.1055/s-0041-1732339
- Burchard J, Polpitiya AD, Fox AC, et al. Clinical validation of a proteomic biomarker threshold for increased risk of spontaneous preterm birth and associated clinical outcomes: a replication study. J Clin Med. 2021;10(21):5088.
- Markenson GR, Saade GR, Laurent LC, et al. Performance of a proteomic preterm delivery predictor in a large independent prospective cohort. Am J Obstet Gynecol MFM. 2020;2(3):100140.
- Burchard J, Saade GR, Boggess KA, et al. Better estimation of spontaneous preterm birth prediction performance through improved gestational age dating. J Clin Med. 2022;11:2885.
- Stankaitis JA, Brill HR, Walker DM. Reduction in neonatal intensive care unit admission rates in a medicaid managed care program. Am J Manag Care. 2005;11(3):166–172.
- Newman RB, Sullivan SA, Menard MK, et al. South Carolina partners for preterm birth prevention: a regional perinatal initiative for the reduction of premature birth in a Medicaid population. Am J Obstet Gynecol. 2008;199(4):393.e1–393.e8.
- Newnham JP, White SW, Meharry S, et al. Reducing preterm birth by a statewide multifaceted program: an implementation study. Am J Obstet Gynecol. 2017;216(5):434–442.
- Husereau D, Drummond M, Augustovski F, et al. Consolidated health economic evaluation reporting standards 2022 (CHEERS 2022) statement: updated reporting guidance for health economic evaluations. Value Health. 2022;25(1):3–9.
- Husereau D, Drummond M, Augustovski F, et al. Consolidated health economic evaluation reporting standards (CHEERS) 2022 explanation and elaboration: a report of the ISPOR CHEERS II good practices task force. Value Health. 2022;25(1):10–31.
- Martin JA, Hamilton BE, Osterman MJK, et al. Births: final data for 2019. Natl Vital Stat Rep. 2021;70(2):1–51.
- Phibbs CS, Schmitt SK, Cooper M, et al. Birth hospitalization costs and days of care for mothers and neonates in California, 2009–2011. J Pediatr. 2019;204:118–125 e14.
- Beam AL, Fried I, Palmer N, et al. Estimates of healthcare spending for preterm and low-birthweight infants in a commercially insured population: 2008–2016. J Perinatol. 2020;40(7):1091–1099.
- Federal Reserve Bank of St. Louis. FRED economic data: producer Price Index by Industry: selected Health Care Industries (PCUASHCASHC) 2022. [cited 2022 Feb 26]. Available from: https://fred.stlouisfed.org/series/PCUASHCASHC
- Fried I, Beam AL, Kohane IS, et al. Utilization, cost, and outcome of branded vs compounded 17-alpha hydroxyprogesterone caproate in prevention of preterm birth. JAMA Intern Med. 2017;177(11):1689–1690.
- Cohen AW, Copel JA, Macones GA, et al. Unjustified increase in cost of care resulting from U.S. Food and Drug Administration approval of Makena (17alpha-hydroxyprogesterone caproate). Obstet Gynecol. 2011;117(6):1408–1412.
- Cahill AG, Odibo AO, Caughey AB, et al. Universal cervical length screening and treatment with vaginal progesterone to prevent preterm birth: a decision and economic analysis. Am J Obstet Gynecol. 2010;202(6):548 e1–548 e8.
- Kowalski JT. A guide to the cost of progesterone for prevention of preterm labor. Proc Obstet Gynecol. 2011;1(3):9. Available from: http://ir.uiowa.edu/pog/
- Viechtbauer W. Conducting meta-analyses in R with the metafor package. J Stat Soft. 2010;36(3):1–48.
- Eddy DM, Hollingworth W, Caro JJ, et al. Model transparency and validation: a report of the ISPOR-SMDM modeling good research practices task force-7. Med Decis Making. 2012;32(5):733–743.
- Grabner M, Burchard J, Nguyen C, et al. Cost-effectiveness of a proteomic test for preterm birth prediction. Clinicoecon Outcomes Res. 2021;13:809–820.
- Microsoft R Application Network [cited 2022 Aug 1]. Available from: https://mran.microsoft.com/open
- Berger ML, Sox H, Willke RJ, et al. Good practices for real-world data studies of treatment and/or comparative effectiveness: recommendations from the joint ISPOR-ISPE special task force on real-world evidence in health care decision making. Value Health. 2017;20(8):1003–1008.
- Garite TJ, Combs CA. Obstetric interventions beneficial to prematurely delivering newborn babies: antenatal corticostetroids, progesterone, magnesium sulfate. Clin Perinatol. 2012;39(1):33–45.
- Meis PJ, Klebanoff M, Thom E, et al. Prevention of recurrent preterm delivery by 17 alpha-hydroxyprogesterone caproate. N Engl J Med. 2003;348(24):2379–2385.
- Romero R, Conde-Agudelo A, Da Fonseca E, et al. Vaginal progesterone for preventing preterm birth and adverse perinatal outcomes in singleton gestations with a short cervix: a meta-analysis of individual patient data. Am J Obstet Gynecol. 2018;218(2):161–180.
- Manuck TA, Henry E, Gibson J, et al. Pregnancy outcomes in a recurrent preterm birth prevention clinic. Am J Obstet Gynecol. 2011;204(4):320 e1–320 e6.
- Behrman RE ,Butler AS. Institute of Medicine (US) Committee on understanding premature birth and assuring healthy outcomes. In: Behrman RE, Butler AS, editors. Societal costs of preterm birth. Preterm birth: causes, consequences, and prevention. Washington (DC): National Academies Press (US); 2007.
- Hillemeier MM, Domino ME, Wells R, et al. Effects of maternity care coordination on pregnancy outcomes: propensity-weighted analyses. Matern Child Health J. 2015;19(1):121–127.