
Abstract
Background
Several disease-modifying treatments (DMTs) for relapsing-remitting multiple sclerosis (RRMS) reduce relapse rates and slow disease progression. RRMS DMTs have varying efficacy and administration routes; DMTs prescribed first may not be the most effective on relapses or disease progression. Here, we aimed to quantify the benefit of initiating ofatumumab, a high-efficacy DMT, earlier in the treatment pathway.
Methods
Aggregate data from a real-world cohort of patients with RRMS, who were eligible for dimethyl fumarate (DMF) or ofatumumab treatment within the UK National Health Service (N = 615), were used to produce a simulated patient cohort. The cohort was tracked through a discrete event simulation (DES) model, based on the Expanded Disability Status Scale (EDSS), with a lifetime time horizon. Outcomes assessed were: mean number of relapses, time to wheelchair (EDSS ≥7), and time to death. Two modeling approaches were used. The first compared outcomes between two treatment sequences (base case: ofatumumab to natalizumab versus DMF to ofatumumab). The second incorporated a time-specific delay of 1–5 years for switching from DMF to ofatumumab; the difference in outcomes as a function of increasing delay to ofatumumab are reported.
Results
Compared with delayed ofatumumab, fewer relapses and increased time to wheelchair were predicted for earlier ofatumumab in the treatment-sequence approach (mean relapses over the lifetime time horizon: 8.63 versus 9.00; time to wheelchair: 17.55 versus 16.60 years). Time to death was similar for both sequences. At Year 10, a numerically greater proportion of patients receiving earlier ofatumumab had mild disease (EDSS 0–3: 44.12% versus 40.06%). Greater differences, reflecting poorer outcomes, were predicted for relapses and time to wheelchair with increasing delays to ofatumumab treatment.
Conclusions
The DES model provided a means by which the magnitude of benefit associated with earlier ofatumumab initiation could be quantified; fewer relapses and a prolonged time to wheelchair were predicted.
Introduction
Multiple sclerosis (MS) is a chronic, neurodegenerative autoimmune disorder characterized by a slowing or blocking of nerve transmission to and from the brain and spinal cordCitation1,Citation2. The disease affects around 130,000 people in the United Kingdom (UK), and approximately 85% of patients begin with relapsing-remitting multiple sclerosis (RRMS)Citation3–5.
RRMS is characterized by sudden deterioration, defined as a relapse, followed by periods of stable remissionCitation4,Citation5. Patients may recover wholly or partially from relapses; however, progressive disability eventually becomes apparent, independent of relapses. At this stage, the transition to secondary-progressive MS (SPMS) begins and cumulative disability with or without relapses is evidentCitation6.
For patients with RRMS, the median time from disease onset to progressively worse disability, measured using the Expanded Disability Status Scale (EDSS)Citation7, varies within the literature but has recently been reported as 29.8 years from onset to EDSS 6.0 (requiring a walking aid)Citation8. Other reports place this value in the range of 15–32 yearsCitation9–11. Furthermore, a higher number of relapses is associated with increased disability (higher EDSS scores), reduced time to disability, and a shorter interval to progressive diseaseCitation12–15. A more recent study has also reported that disability progression may occur independently of relapses in patients with RRMSCitation16.
Despite no cure, a number of disease-modifying therapies (DMTs) are approved by the National Institute for Health and Care Excellence (NICE) for use in patients with MS in the UKCitation17. These treatments have varying levels of efficacy in reducing the annualized relapse rate and slowing disability progressionCitation16, as defined by the Association of British NeurologistsCitation18. High efficacy treatments, such as natalizumab, have average relapse reduction of substantially greater than 50%, while moderate, or modest treatments, such as dimethyl fumarate (DMF) and teriflunomide, are those with an average relapse reduction of 30–50%Citation18,Citation19. Not only is the relative efficacy of the DMT important in slowing disability progression and reducing relapses, but earlier introduction of DMTs and, more specifically high-efficacy DMTs, has been shown to reduce the number of relapse events and disability accrual compared with lower-efficacy DMTs, or delayed treatmentCitation20–22.
Ofatumumab is a high-efficacy DMT for relapsing forms of MS, which can be self-administered once a month, and was recommended by NICE in 2021 for use in adult patients with active RRMS, defined by clinical or imaging featuresCitation23. The ASCLEPIOS I (NCT02792218) and ASCLEPIOS II (NCT02792231) trials both evaluated the efficacy of ofatumumab as compared with teriflunomide, a modest-efficacy oral DMT, in patients with MSCitation24. The results showed ofatumumab to significantly lower the relapse rate, as well as lowering the proportion of patients with 3- and 6-month confirmed disability worsening, versus teriflunomideCitation24.
Patients and clinicians usually decide upon their treatment preference. This has been shown to be influenced by the method and frequency of DMT administrationCitation25,Citation26 and, despite higher-efficacy DMTs being available, may lead to modest-efficacy oral DMTs being prescribed in the first instance. Should a patient not respond well to initial treatment, an escalation approach may be employed, by which a higher-efficacy DMT is prescribed in the second instance.
In this study, we modeled a simulated cohort of patients with RRMS in the UK to evaluate the potential benefits, with respect to the number of relapses and disease progression, of earlier ofatumumab initiation compared with delayed initiation after receiving first-line DMF.
Methods
Patient population
The patient population in the model was simulated based on aggregate data from a real-world cohort of patients with RRMS who were treated within the UK National Health Service (NHS) (N = 615; data collated by RN and HK from the Imperial College Healthcare NHS Trust). These patients were considered eligible for either DMF or ofatumumab as a first-line DMT at the time of data collation. The cohort comprised a ratio of 2:1 female-to-male with mean ages of 45.5 years (standard deviation [SD] : 11.2) and 43.9 years (SD: 12.0), respectively. The percentage of patients in each EDSS health state is presented in . The data used in this study were anonymized and aggregated, thus Institutional Review Board clearance was not required. As with previous modeling approaches, half-point EDSS scores were rounded down to the nearest whole number. From the aggregate data, 615 individual patient records were simulated and each patient record was run through the model 1,000 times, to give a total number of 615,000 simulated patients (see Results for details on computational stability testing).
Table 1. The percentage of the real-world cohort in each EDSS health state at baseline.
Model structure
A discrete event simulation (DES) model has previously been developed in Microsoft Excel and C++ to assess the cost-effectiveness and cost-utility of MS treatments, taking a NHS and Personal Social Services (PSS) perspective (Supplementary Figure S1)Citation27,Citation28. The previously published model was adapted to address the new decision problem and determine the difference in patient outcomes when using ofatumumab as a first- or second-line treatment for patients with RRMS.
In the model, and as per the previous publications, disability progression was based on transitions through EDSS health states and relapses were incorporatedCitation27,Citation28. Patient attributes (age, sex, EDSS health state) were set at model initiation and the patient history was tracked throughout the lifetime horizon. Variations could occur in age, time since treatment initiation on the current DMT, utility, MS phenotype (RRMS or SPMS), EDSS health state, current relapse (yes or no), experiencing an adverse event, and mortality multiplierCitation27,Citation28.
Based on the attributes of the patient cohort used, the natural history of RRMS or SPMS, and clinical/safety inputs, the model provided a stochastic simulation of events that may occur for each patient during the modeled time period. The time to an event such as an EDSS transition, transition from RRMS to SPMS, a relapse, treatment discontinuation, an adverse event, or death was recorded by the simulation clockCitation27,Citation28. The model records the time to event for all possible events for each patient. Following the occurrence of an event, each patient’s attributes are updated and the process is repeated until death occurs.
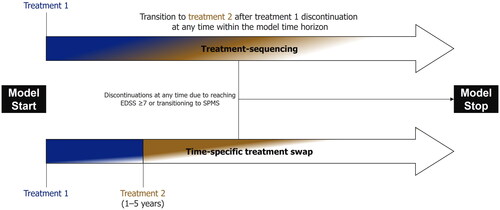
Mortality, including adjustments for age and gender, was incorporated using data from the Office for National Statistics for the years 2016–2018, aligning with the NICE appraisal of ofatumumabCitation23. This was further adjusted to account for the risk of mortality associated with having MS, based on data reported by Pokorski et al. and using multipliers accepted by NICE in technology appraisals of RRMS DMTs, such as ofatumumabCitation23,Citation29. To assess the difference in outcomes between early versus delayed ofatumumab, two modeling approaches were implemented, as shown in .
Figure 1. Schematic diagrams of the modeling approaches employed in this analysis. In both modeling approaches, patients could discontinue treatment with RRMS DMTs due to transitioning to SPMS or reaching EDSS ≥ 7. In the treatment-sequencing approach, patients could discontinue the first treatment, in line with the rate of all-cause discontinuation, at any time and move onto the second-line DMT. In the time-specific treatment swap, patients remaining on DMT were switched to the second treatment at a specified time point. EDSS, Expanded Disability Status Scale.
Treatment-sequencing
The first, base case approach evaluated two treatment sequences to compare early versus delayed ofatumumab. These treatment sequences were based on current clinical practice and comprised of ofatumumab followed by natalizumab (early ofatumumab) and DMF followed by ofatumumab (delayed ofatumumab). Two DMTs were required in each treatment sequence to provide comparable time on treatment across both, reducing any influence of longer time without receiving a DMT on the outcomes (as would be the case in a comparison of a sequence with only one DMT versus two DMTs). Cladribine, although considered to have slightly reduced efficacy compared with natalizumabCitation19, may also be used in clinical practice; thus, a scenario analysis was explored in which this replaced natalizumab as a second-line treatment (see Scenario analyses, below). Discontinuation was modeled to occur if a patient reached EDSS ≥7 or transitioned from RRMS to SPMS, as per the NHS England treatment algorithmCitation30. If either of these events occurred, patients were modeled to receive best supportive care (BSC) until death. For patients transitioning to SPMS, this was a simplifying assumption because siponimod may be initiated in certain NHS patients in clinical practiceCitation31, but was not included in this model. Discontinuation events linked to DMTs were modeled based on clinical trial data for all-cause discontinuations for each DMT. In this case, patients transferred to a consecutive line of DMT; if they were discontinuing the second-line DMT of the sequence, patients received BSC until death.
Time-specific treatment swap
The second modeling approach incorporated a specific time point at which all patients receiving DMF were modeled to switch to ofatumumab. Increasing arbitrary delays of 1–5 years were tested. During the specified delay period patients were modeled to receive DMF. The difference in outcomes was compared with patients who were modeled to initiate ofatumumab without a delay.
Clinical inputs
Natural history data pertaining to the transition between EDSS health states for patients with RRMS were taken from the British Columbia data set, as per the NICE appraisal of ofatumumab (Supplementary Table S1a)Citation23. EDSS transitions for those with SPMS were obtained from the placebo arm of the EXPAND clinical trial of siponimod, supplemented by SPMS-specific transitions data from the London Ontario database (Supplementary Table S1b)Citation32,Citation33. RRMS to SPMS transition probabilities were also obtained from the London Ontario database (Supplementary Table S1c).
A treatment effect for each DMT was incorporated by adjusting the transition probability based on the hazard ratio of 6-month confirmed disability progression for each DMT versus placebo, as reported in a network meta-analysis (NMA) published by Samjoo et al.Citation34 For ofatumumab, this value was 0.54 and for DMF and natalizumab the hazard ratios were 0.68 and 0.46, respectively. The relapse frequencies for patients with RRMS and SPMS, which varied by EDSS health state, were those recommended for use in the NICE appraisal of ofatumumab and sourced from the appraisal of beta interferon/glatiramer acetateCitation23,Citation35. DMT efficacy on relapse frequency was modeled by applying the annualized relapse rate ratio for each (ofatumumab: 0.30; DMF: 0.50; natalizumab: 0.31, obtained from Samjoo et al.Citation34) to the natural history values of relapse rates. Relapse frequencies by EDSS state are shown in .
Table 2. Annual relapse rates for patients with RRMS and SPMS, as reported in the NICE appraisals of ofatumumab and beta interferon/glatiramer acetateCitation23,Citation35.
It was assumed in the model that prior treatment with a DMT did not affect the subsequent efficacy of the second-line DMT. As such, the hazard ratios and annualized relapse rate ratios for ofatumumab were assumed to be the same, regardless of whether patients initiated these from the beginning of the model or after a period of treatment with DMF. This assumption was considered reasonable given the trial data of the intervention and comparators in the NMA were derived from populations which included both treatment-naïve and treatment-experienced patients.
Disease-related outcomes
Outcomes explored in the treatment-sequencing approach include the mean number of relapses, time to wheelchair (defined as the time from initiation of DMT to progression to an EDSS health state ≥7) and time to death for the two treatment regimens (early versus delayed ofatumumab).
In the time-specific treatment-swap approach, differences between the aforementioned outcomes were evaluated and quantified by comparing the outcomes in patients who initiated ofatumumab from the start of the model and those who had varying times of delay (1–5 years), having received DMF in the intervening period.
Patients progressing to EDSS ≥7 (wheelchair bound) were also tracked in order to determine the mean time to wheelchair. Time to wheelchair was defined as the time to a patient’s first event that led to progression to EDSS ≥7. If a patient died before reaching EDSS ≥7, the time to wheelchair was assumed to be equal to time to death.
Scenario analyses
A scenario was explored in which an alternative hazard ratio for 6-month confirmed disability progression was employed for ofatumumab. The alternative value was reported from a scenario NMA conducted by Samjoo et al.Citation34 in which the clinical data from the ASCLEPIOS trial were re-analyzed using the protocol from the OPERA trial of ocrelizumab. As a result, the scenario hazard ratio for ofatumumab was 0.43; values for natalizumab and DMF remained the same (0.46 and 0.68, respectively).
In a further scenario analysis, sources for the natural history transition probabilities and annualized relapse rates were varied and the results evaluated in the treatment-sequence model. Furthermore, London Ontario database data for RRMS transitions, which do not allow improvements in EDSS state, were evaluated as an alternative to the British Columbia data used in the base case. In addition, alternative natural history annualized relapse rates were sourced from the NICE appraisal of natalizumab (TA127)Citation36.
A clinically-relevant scenario in which patients received cladribine, rather than natalizumab, as a second-line treatment after ofatumumab, was modeled. The hazard ratio for 6-month confirmed disability progression for cladribine, as obtained from Samjoo et al.Citation34, was 0.54 and the annualized relapse rate ratio was 0.42.
Results
Computational stability
The model results vary according to the seed value (that is, the value used as an input to propagate the sequence provided by the random number generator) set in the inputs due to the stochastic nature of the model. Initially, using a seed value of 1 for the random number generator, cohort iteration settings of 1–4,000 were tested and the variation in the results was evaluated using the relative change as a percentage of the mean. Following this, the cohort iteration was fixed at 1,000 (which had been determined to be sufficient to provide stable results) and the stability of key outcomes (relapses avoided, time to wheelchair and time to death), with respect to variation in the seed (1–25), was evaluated. The variation was found to be acceptable. For further analyses, a seed value of 1 was chosen to enable reproducible numerical results. The results of the analysis for time to wheelchair using a fixed cohort value of 1,000 and seed values of 1–25 are presented in Supplementary Table S2.
Improved outcomes with earlier ofatumumab initiation
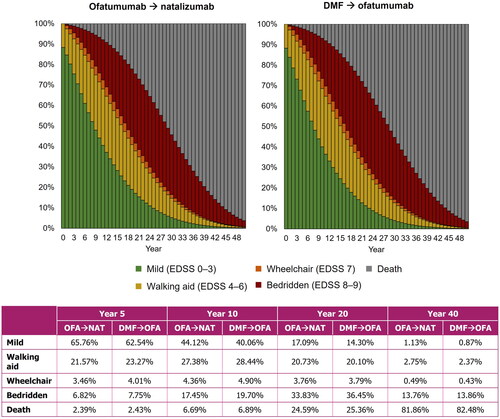
Results from the comparison of early versus delayed ofatumumab treatment sequences are presented in . Patients who received delayed ofatumumab treatment were predicted to experience a mean of 9.00 relapses, compared with 8.63 for patients who had no delay. Furthermore, early ofatumumab treatment was predicted to increase time to wheelchair (time from DMT initiation to EDSS ≥7). Mean time to death was similar between the two treatment regimens. highlights the proportion of patients in broad EDSS categories (mild, walking aid, wheelchair, and bedridden) for both treatment sequences from Year 0–50 with the proportions detailed for Years 5, 10, 20, and 40. Although the differences were small, delayed ofatumumab was predicted to result in a numerically higher proportion of patients with more severe disease and higher level of disability, compared with those receiving ofatumumab as a first-line treatment, at all timepoints detailed. The greatest difference was observed at Year 10.
Figure 2. Key model outcomes for early (ofatumumab → natalizumab) versus delayed (DMF → ofatumumab) ofatumumab treatment. DMF, dimethyl fumarate; EDSS, Expanded Disability Status Scale.
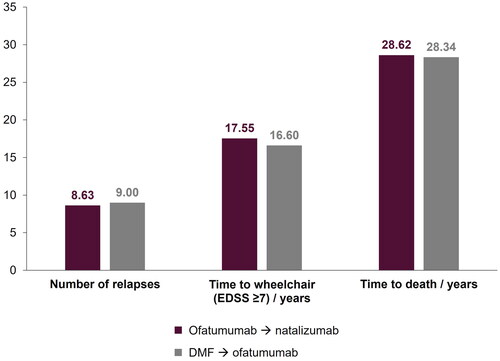
Figure 3. Proportion of patients in each EDSS category for both treatment sequences. DMF, dimethyl fumarate; EDSS, Expanded Disability Status Scale; OFA, ofatumumab; NAT, natalizumab.
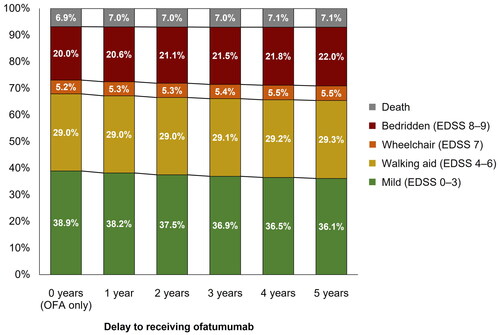
Results from the delayed treatment-swap modeling approach are shown in for the difference in mean number of relapses and mean time to wheelchair. Compared with patients receiving ofatumumab from the start of the model, patients experiencing increasing delays to ofatumumab were estimated to have increasingly poor outcomes. Over the modeled lifetime, a delay of 5 years was estimated to result in 0.34 more relapse events on average and progression to wheelchair 0.58 years sooner. Furthermore, and as shown in , a longer delay to receiving ofatumumab resulted in fewer patients with milder disease at Year 10 of the model (no delay: 38.9%; 5-year delay: 36.1%), and higher proportions of patients in EDSS states 7–9 (no delay: 25.2%; 5-year delay: 27.5%).
Figure 4. The difference in mean number of relapses (a) and mean time to wheelchair (b) by increasing delays to receiving ofatumumab.
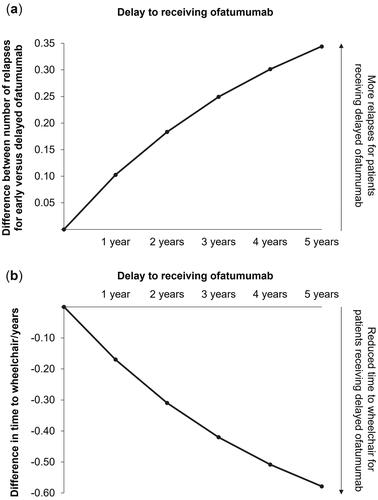
Figure 5. Proportion of patients in each EDSS category at Year 10 of the model by time-specific delay to receiving ofatumumab treatment. EDSS, Expanded Disability Status Scale; OFA, ofatumumab.
Scenario analyses
As shown in , use of the alternative hazard ratio for ofatumumab provided similar results to the base case with respect to the number of relapses and mean time to death predicted for both treatment sequences. As anticipated, the lower hazard ratio for 6-month confirmed disability progression resulted in an increase in the time to wheelchair, from 17.55 to 18.14 years, for early ofatumumab. For delayed ofatumumab, the results were similar for the base case and scenario (16.60 versus 16.93 years).
Table 3. Results from scenario analyses exploring alternative model inputs.
Results from the scenario analyses exploring alternative natural history transition probabilities and annualized relapse rates are also presented in . Compared with the base case, in which the British Columbia database was used, use of the London Ontario database resulted in small decreases for each outcome across the ofatumumab to natalizumab and DMF to ofatumumab treatment sequences. In particular, the mean time to wheelchair was predicted to decrease for both of the aforementioned sequences, though a larger decrease was observed for the ofatumumab to natalizumab sequence. Despite the decrease, earlier ofatumumab was still predicted to lead to better outcomes compared with delayed ofatumumab.
As expected, use of the alternative annualized relapse rate values did not affect the time to wheelchair or time to death predicted in the model. However, the mean number of relapses increased for both treatment sequences. Despite the increase, ofatumumab followed by natalizumab was still predicted to result in fewer relapses than DMF followed by ofatumumab.
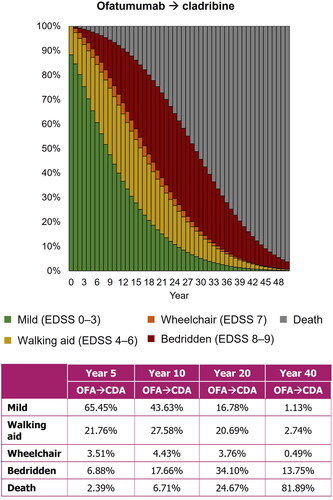
The treatment-sequence scenario in which patients received ofatumumab followed by cladribine estimated a mean of 8.70 relapses, 17.47 years to wheelchair, and 28.60 years to death. shows the proportion of patients in each EDSS state from Year 0–50 in the model. Modeling cladribine as an alternative second-line DMT, following ofatumumab, provided less favorable outcomes than in the base case, but earlier initiation of ofatumumab was still predicted to benefit patients when compared with a delay to high-efficacy treatment.
Figure 6. Scenario analysis of the treatment sequence approach for patients receiving ofatumumab followed by cladribine. CDA, cladribine; EDSS, Expanded Disability Status Scale; OFA, ofatumumab
Discussion
In this analysis, a DES model was used to predict the effect of early treatment with ofatumumab on the number of relapses, time to wheelchair, and time to death for patients with RRMS in the UK. Two modeling approaches were used: the first compared treatment sequences with ofatumumab as either a first- or second-line DMT; the second used a time-specific delay to receiving ofatumumab.
In the base case of the treatment-sequencing approach, first-line ofatumumab was followed by natalizumab for patients who discontinued treatment. This regimen was modeled in line with clinical practice, based on clinical expert opinion. It was assumed that discontinuation of high-efficacy ofatumumab would warrant a switch to a second-line drug of similar efficacy and with an alternative mechanism of action, as in clinical practice. In addition, a scenario was explored in which cladribine replaced natalizumab as the second-line DMT. Outcomes were compared with those predicted when ofatumumab was initiated as a second-line DMT, after initial DMF treatment.
Results from this approach quantified the benefit to initiating ofatumumab earlier. First-line ofatumumab, followed by either natalizumab or cladribine, demonstrated more favorable outcomes when compared with second-line ofatumumab (after initial DMF treatment). Earlier ofatumumab treatment was predicted to provide a long-term benefit to patients in terms of the mean number of relapses experienced, and in prolonging the mean time to wheelchair. The model also predicted that delayed ofatumumab treatment may result in a higher proportion of patients with more severe disease throughout the modeled time period, with the difference between early and delayed treatment greatest at Year 10.
A further scenario was explored in which an alternative hazard ratio value for ofatumumab versus placebo was used. Given the lack of direct comparisons between treatments, an NMA was used as the source of hazard ratio data for each DMT versus placeboCitation34. A scenario NMA was also conducted based on re-analysis of ASCLEPIOS data in line with the protocol from the OPERA trial of ocrelizumab. The result was a change from 0.54 in the base case to 0.43 in the scenario and incorporating this into the DES model led to a more favorable time to wheelchair outcome for earlier ofatumumab treatment. Further scenario analyses exploring different data sources for natural history transition probabilities and annualized relapse rate values gave results which were in alignment with the base case. The largest difference was observed in the mean number of relapses when using alternative annualized relapse rate values. In general, the results are in agreement with several prospective studies exploring delayed high-efficacy DMT initiation in patients from various registriesCitation20–22. As expected, the time to death was predicted to be similar for both treatment regimens, resulting from the exclusion of a direct treatment effect on patient mortality.
The introduction of time-specific delays to receiving ofatumumab provides further support for the predicted benefits of initiating ofatumumab at an earlier stage. The results demonstrated a trend in which an increased delay was associated with a shorter time to wheelchair for patients with RRMS. Both modeling approaches highlighted a clinical benefit with respect to the proportion of patients with mild disease at later timepoints. In both cases, a smaller proportion of patients were estimated to require a walking aid after 10 years when ofatumumab was provided without a delay. Loss of mobility and requirement for a walking aid or wheelchair are detrimental to quality of life, ability to perform daily activities, and mental wellbeingCitation37–39. By introducing a high-efficacy DMT at an earlier stage of the disease, it may be possible to prolong the time before mobility is decreased, as predicted by the results reported here. In addition, the results may support the need for improved assessments of treatment response which would enable switching of DMTs before a patient experiences a relapse or disease progression and to improve long-term outcomes.
Whilst the results reported here focus on the clinical efficacy, it should be noted that the safety profile of DMTs is also an important factor for patients and clinicians to consider when initiating treatment. Studies have shown that patients may prefer a treatment with more frequent, but milder, side effectsCitation25,Citation40; thus, a high-efficacy treatment may not be considered if it is associated with more serious side effects. On the other hand, patients with more severe disease may be more likely to favor a high-efficacy treatment after consideration of the overall benefit–risk assessmentCitation26.
The DES model provides a means by which treatment sequencing can be simulated to incorporate the effects of a delay to initiating a high-efficacy DMT. Patients can be modeled to receive an alternative, modest-efficacy DMT in the intervening period. A strength of this approach is the ability to capture the time to wheelchair (EDSS ≥7), a significant progression in RRMS, with considerable impact on patients’ quality of life. Tracking the patient cohort over time provides a natural modeling of the events associated with RRMS and allows the baseline characteristics of each simulated patient to be incorporated into the events and time to event results evaluated. An additional strength is the inclusion of aggregate patient data used to simulate the patient cohort. Data were obtained from a real-world patient cohort of those with RRMS in the UK who would be eligible for either ofatumumab or DMF treatment at the time of data collection. As a result, the model outputs are relevant to patients with RRMS treated within the NHS.
An absence of data relating to the effect of prior treatment on subsequent DMT efficacy required the assumption that the hazard ratio and annualized relapse rate ratio values would be applicable to treatments used as first- or second-line DMTs. This assumption was considered a valid interpretation of the available data given that the trials analyzed in the NMA largely included both treatment-naïve and treatment-experienced patients in the analysis sets.
One specific limitation of the DES model is the increased complexity compared with a Markov model, though this may be negated by the ability to explore additional decision problems, such as that presented hereCitation41. Additional limitations of the DES model approach are generally consistent with those anticipated for a Markov model, particularly given the alignment to a Markov-type structure in this analysis. Of note is the requirement for assumptions and imperfect data informing the inputs. An example of this is in the use of values calculated in the NMACitation34, given the absence of data directly comparing the efficacy of ofatumumab to both DMF and placebo. Despite this, the use of such an approach is common in NICE appraisals when direct comparisons are not available. Finally, the severity of relapses avoided was not modeled due to an absence of data to inform model inputs. While it may be possible to incorporate this into the model, only annualized relapse rate ratios for the overall treatment effect on relapses are available from the NMACitation34, thus this could not be included in this analysis.
This analysis supports prior, real-world studies reporting the benefits of earlier initiation of high-efficacy DMTsCitation20–22. While modest-efficacy oral RRMS DMTs represent an effective and readily administered option for patients, the long-term outcomes may not be as favorable as earlier initiation of high-efficacy therapies. Self-administration, as for ofatumumab, may also increase uptake of high-efficacy therapies as first-line treatments with the potential to benefit patients, as well as supporting the NHS Long Term Plan to increase ‘out-of-hospital’ careCitation30,Citation42.
Conclusion
The DES model provided a means by which the magnitude of benefit associated with earlier ofatumumab initiation could be quantified. Earlier treatment with ofatumumab was predicted to reduce the number of relapses experienced by patients and prolong the time to wheelchair when compared to delayed initiation. Therefore, reducing the time to initiation of a high-efficacy treatment is likely to positively impact disease progression.
Transparency
Declaration of funding
This research was funded by Novartis Pharmaceuticals UK Ltd.
Declaration of financial/other interests
SMM and LG are employees of Costello Medical, who were contracted by Novartis Pharmaceuticals UK Ltd to undertake the work. HK has no disclosures. RN has carried out paid advisory boards for Novartis, Roche and Biogen. Vice Chair of NICE HTA Committee C. Received grant funds from the UK MS Society. JL is an employee of Novartis Pharmaceuticals UK Ltd and shareholder of Novartis.
Author contributions
Substantial contributions to study conception and design: SMM, LG, JL; substantial contributions to analysis and interpretation of the data: SMM, LG, HK, RN, JL; drafting the article or revising it critically for important intellectual content: SMM, LG, HK, RN, JL; final approval of the version of the article to be published: SMM, LG, HK, RN, JL.
Reviewer disclosures
Peer reviewers on this manuscript have no relevant financial or other relationships to disclose.
Previous presentations
There are no previous presentations of this work.
Supplemental Material
Download MS Word (52.5 KB)Acknowledgements
The authors would like to acknowledge Blake Liu, MS, Costello Medical, Boston, MA, USA and Josh Micallef, BSc, Costello Medical, London, UK for support with updating and programming the model. The original model was developed by the authors of the original publication (Maciej Maruszczak and David Slater; J Med Econ 2017;20(5):474–82).
References
- Peterson LK, Fujinami RS. Inflammation, demyelination, neurodegeneration and neuroprotection in the pathogenesis of multiple sclerosis. J Neuroimmunol. 2007;184(1-2):37–44.
- Gelfand JM. Chapter 12 - Multiple sclerosis: diagnosis, differential diagnosis, and clinical presentation. In: Goodin DS, editor. Handbook of clinical neurology. Vol. 122. Elsevier; 2014. p. 269–290.
- Multiple Sclerosis Trust – How common is multiple sclerosis? 2022. https://mstrust.org.uk/a-z/how-common-multiple-sclerosis
- Multiple Sclerosis Trust. Types of MS. Relapsing remitting MS (RRMS). 2022. https://www.mssociety.org.uk/about-ms/types-of-ms/relapsing-remitting-ms
- Compston A, Coles A. Multiple sclerosis. Lancet. 2008;372(9648):1502–1517.
- Tremlett H, Yinshan Z, Devonshire V. Natural history of secondary-progressive multiple sclerosis. Mult Scler. 2008;14(3):314–324.
- Kurtzke JF. Rating neurologic impairment in multiple sclerosis. Neurology. 1983;33(11):1444–1452.
- Simonsen CS, Flemmen HØ, Broch L, et al. The course of multiple sclerosis rewritten: a Norwegian population-based study on disease demographics and progression. J Neurol. 2021;268(4):1330–1341.
- Leray E, Yaouanq J, Le Page E, et al. Evidence for a two-stage disability progression in multiple sclerosis. Brain. 2010;133(7):1900–1913.
- Tremlett H, Zhao Y, Rieckmann P, et al. New perspectives in the natural history of multiple sclerosis. Neurology. 2010;74(24):2004–2015.
- Confavreux C, Vukusic S, Moreau T, et al. Relapses and progression of disability in multiple sclerosis. N Engl J Med. 2000;343(20):1430–1438.
- Koch-Henriksen N, Thygesen LC, Sørensen PS, et al. Worsening of disability caused by relapses in multiple sclerosis: a different approach. Mult Scler Relat Disord. 2019;32:1–8.
- Lublin FD, Baier M, Cutter G. Effect of relapses on development of residual deficit in multiple sclerosis. Neurology. 2003;61(11):1528–1532.
- Scalfari A, Neuhaus A, Degenhardt A, et al. The natural history of multiple sclerosis, a geographically based study 10: relapses and long-term disability. Brain. 2010;133(7):1914–1929.
- Scott TF, Diehl D, Elmalik W, et al. Multiple sclerosis relapses contribute to long-term disability. Acta Neurol Scand. 2019;140(5):336–341.
- Lublin FD, Häring DA, Ganjgahi H, et al. How patients with multiple sclerosis acquire disability. Brain. 2022;145(9):3147–3161.
- Multiple Sclerosis Trust. Disease modifying therapies. 2022. https://www.mssociety.org.uk/about-ms/treatments-and-therapies/disease-modifying-therapies.
- Scolding N, Barnes D, Cader S, et al. Association of british neurologists: revised (2015) guidelines for prescribing disease-modifying treatments in multiple sclerosis. Pract Neurol. 2015;15(4):273–279.
- Samjoo IA, Worthington E, Drudge C, et al. Efficacy classification of modern therapies in multiple sclerosis. J Comp Eff Res. 2021;10(6):495–507.
- Buron MD, Chalmer TA, Sellebjerg F, et al. Initial high-efficacy disease-modifying therapy in multiple sclerosis: a nationwide cohort study. Neurology. 2020;95(8):e1041–e1051.
- He A, Merkel B, Brown JWL, et al. Timing of high-efficacy therapy for multiple sclerosis: a retrospective observational cohort study. Lancet Neurol. 2020;19(4):307–316.
- Iaffaldano P, Lucisano G, Butzkueven H, et al. Early treatment delays long-term disability accrual in RRMS: results from the BMSD network. Mult Scler. 2021;27(10):1543–1555.
- National Institute for Health and Care Excellence. Ofatumumab for treating relapsing multiple sclerosis (TA699). 2021. https://www.nice.org.uk/guidance/ta699.
- Hauser SL, Bar-Or A, Cohen JA, ASCLEPIOS I and ASCLEPIOS II Trial Groups, et al. Ofatumumab versus teriflunomide in multiple sclerosis. N Engl J Med. 2020;383(6):546–557.
- Bottomley C, Lloyd A, Bennett G, et al. A discrete choice experiment to determine UK patient preference for attributes of disease modifying treatments in multiple sclerosis. J Med Econ. 2017;20(8):863–870.
- Utz KS, Hoog J, Wentrup A, et al. Patient preferences for disease-modifying drugs in multiple sclerosis therapy: a choice-based conjoint analysis. Ther Adv Neurol Disord. 2014;7(6):263–275.
- Montgomery SM, Kusel J, Nicholas R, et al. Costs and effectiveness of fingolimod versus alemtuzumab in the treatment of highly active relapsing-remitting multiple sclerosis in the UK: re-treatment, discount, and disutility. J Med Econ. 2017;20(9):962–973.
- Montgomery SM, Maruszczak MJ, Slater D, et al. A discrete event simulation to model the cost-utility of fingolimod and natalizumab in rapidly evolving severe relapsing-remitting multiple sclerosis in the UK. J Med Econ. 2017;20(5):474–482.
- Pokorski RJ. Long-term survival experience of patients with multiple sclerosis. J Insur Med. 1997;29(2):101–106.
- Treatment Algorithm for Multiple Sclerosis Disease-Modifying Therapies (NHS England Reference: 170079ALG). 2019. https://www.england.nhs.uk/commissioning/wp-content/uploads/sites/12/2019/03/Treatment-Algorithm-for-Multiple-Sclerosis-Disease-Modifying-Therapies-08-03-2019-1.pdf
- National Institute for Health and Care Excellence. Siponimod for treating secondary progressive multiple sclerosis (TA656). 2020. https://www.nice.org.uk/guidance/ta656
- Kappos L, Bar-Or A, Cree BAC, EXPAND Clinical Investigators, et al. Siponimod versus placebo in secondary progressive multiple sclerosis (EXPAND): a double-blind, randomised, phase 3 study. Lancet. 2018;391(10127):1263–1273.
- Schur N, Gudala K, Vudumula U, et al. Cost effectiveness and budget impact of siponimod compared to interferon beta-1a in the treatment of adult patients with secondary progressive multiple sclerosis with active disease in Switzerland. Pharmacoeconomics. 2021;39(5):563–577.
- Samjoo IA, Worthington E, Drudge C, et al. Comparison of ofatumumab and other disease-modifying therapies for relapsing multiple sclerosis: a network meta-analysis. J Comp Eff Res. 2020;9(18):1255–1274.
- National Institute for Health and Care Excellence. Beta interferons and glatiramer acetate for treating multiple sclerosis (TA527). 2018. https://www.nice.org.uk/guidance/ta527
- National Institute for Health and Care Excellence. Natalizumab for the treatment of adults with highly active relapsing–remitting multiple sclerosis (TA127). 2007. https://www.nice.org.uk/guidance/ta127
- Jones KH, Jones PA, Middleton RM, et al. Physical disability, anxiety and depression in people with MS: an internet-based survey via the UK MS register. PLoS One. 2014;9(8):e104604.
- Sutliff MH. Contribution of impaired mobility to patient burden in multiple sclerosis. Curr Med Res Opin. 2010;26(1):109–119.
- Yildiz M. The impact of slower walking speed on activities of daily living in patients with multiple sclerosis. Int J Clin Pract. 2012;66(11):1088–1094.
- Bauer B, Brockmeier B, Devonshire V, et al. An international discrete choice experiment assessing patients’ preferences for disease-modifying therapy attributes in multiple sclerosis. Neurodegener Dis Manag. 2020;10(6):369–382.
- Noon KM, Montgomery SM, Adlard NE, et al. When does economic model type become a decisive factor in health technology appraisals? Learning from the expanding treatment options for relapsing–remitting multiple sclerosis. J Med Econ. 2018;21(10):983–992.
- The NHS Long Term Plan. 2019. https://www.longtermplan.nhs.uk/wp-content/uploads/2019/08/nhs-long-term-plan-version-1.2.pdf