
Abstract
Aims
To compare cost offsets and contributing factors (false-negative rates and confirmatory imaging requirements, potentially leading to longer waiting times for diagnosis) as well as long-term cost effectiveness associated with the diagnostic and treatment pathways for colorectal cancer liver metastases (CRCLM) in the US, Japan, and China according to initial imaging modality used. Gadoxetate disodium (ethoxylbenzyl-diethylenetriaminepentaacetic acid)-enhanced magnetic resonance imaging (EOB-MRI) was compared to multidetector computed tomography (MDCT), extracellular contrast media enhanced-MRI (ECCM-MRI) (the US and China only) and contrast-enhanced ultrasound (CEUS).
Materials and methods
Decision tree models were developed to simulate the clinical pathway, from first diagnostic test to initial treatment decision, based on local clinical guidelines and validated by experts. Input data were derived from the literature (up to 31st December 2020) as well as from interviews with local experts. A Markov model extension was built to evaluate the number of false-negative patients and associated costs, over a lifetime horizon.
Results
The decision-tree models showed that, increasing proportionate use of initial EOB-MRI resulted in a cost-offset per patient (excluding false-negative patients) in all countries (USD 201 for the US, JPY 6,284 for Japan and CNY 446 for China) driven by reductions in follow-on diagnostic procedures and unnecessary treatment. The use of EOB-MRI was also associated with a shorter average waiting time to a final diagnosis and treatment decision compared to MDCT, ECCM-MRI and CEUS. The Markov model showed that with an increase in EOB-MRI use, there are fewer false-negative diagnoses over a lifetime horizon. In all three countries, the incremental cost-effectivenes ratio (ICER) was below standard willingness-to-pay thresholds.
Conclusion
The findings of these models demonstrate that use of EOB-MRI early in the diagnostic pathway for CRCLM results in short-term cost savings, as well as being cost effective in the long term.
Introduction
In 2020, colorectal cancer was the third most common type of cancer and the second leading cause of cancer deaths worldwide, being responsible for 1,931,590 (10%) of new cancer cases and 935,173 (9.4%) of cancer deathsCitation1. The liver is the most common site of metastasis in colorectal cancer, with up to 50% of patients developing liver metastases during the course of their diseaseCitation2,Citation3.
Hepatic resection and/or ablational techniques in patients with colorectal cancer liver metastases (CRCLM) remains the only option for potential cureCitation4. While the literature gives highly variable five-year survival rates for CRCLM, patients initially diagnosed with resectable disease trend towards having higher rates (16–71%) than those with unresectable disease (33–50%). At the time of diagnosis, most CRCLM patients have unresectable diseaseCitation5. Increased survival rates of these initially unresectable patients were driven by the increase in successful treatment (downstaging) to allow resection. However, survival times following conversion chemotherapy and surgery in patients with initially unresectable disease are still lower than those in patients undergoing primary liver resectionCitation5. Therefore, patients could potentially benefit from accurate diagnostic and pre-operative imaging to detect and characterise lesions at a resectable stageCitation6.
Diagnostic guidelines in the US, Japan and China recommend several different imaging modalities for the diagnosis and staging of CRCLM, including contrast-enhanced multidetector computed tomography (CE-MDCT), contrast-enhanced magnetic resonance imaging (MRI) and contrast-enhanced ultrasound (CEUS)Citation7–10. Several studies have demonstrated that MR imaging delivers better sensitivity in the diagnosis of CRCLM compared with other modalities. A meta-analysis by Floriani et al. reported a sensitivity of 81.1% for MRI compared with 63.0% for ultrasound and 74.8% for CTCitation11, while Niekel et al. reported a sensitivity of 88.2% for MRI and 83.6% for CTCitation12. Hepatocyte-specific contrast agents such as gadoxetate disodium (EOB) have been shown to have increased sensitivity in the detection of CRCLM compared with other modalities. Vreugdenburg et al. reported a 94.9% sensitivity for EOB-MRI compared with 74.2% for contrast-enhanced CT (CECT) and Asato et al. reported a 91.4% sensitivity for EOB-MRI compared with 80.9% for CECTCitation13,Citation14.
This diagnostic performance is reflected in previous studies of economic impact, with EOB-MRI showing benefits in the diagnosis of CRCLMCitation15,Citation16. A 2009 study showed that EOB-MRI can be cost saving compared with extracellular contrast media MRI (ECCM-MRI) and multidetector CT (MDCT), due to improved pre-operative planning and fewer intra-operative changesCitation15. Zech et al. showed in 2016 that the diagnostic work-up cost using EOB-MRI was cost saving compared with ECCM-MRI and MDCT because of fewer additional imaging procedures and similar diagnostic workup costs versus other modalitiesCitation16. Additionally, significantly more patients were eligible for surgery in the EOB-MRI group compared to the other two groups, allowing more patients to undergo potentially curative surgery. Studies to date have not investigated the cost offsets (from initial imaging assessment to diagnosis and treatment decision) associated with EOB-MRI use, nor have they compared EOB-MRI to CEUS.
In a previously published study, the authors evaluated the health economic impact of diagnostic modality selection for patients suspected of having hepatocellular carcinoma (HCC)Citation17. A new analysis has been conducted to evaluate the clinical and economic consequences of modality selection within the specific context of CRCLM. This analysis accounts for the impacts of differences in staging, treatment options, relative diagnostic accuracy and treatment outcomes on further imaging requirements, incorrect diagnostic outcomes, time to diagnosis and cost offsets.
The current study evaluated the cost offsets and contributing factors (e.g. confirmatory imaging requirements and time to diagnosis and treatment decision) as well as long-term cost-effectiveness associated with CRCLM diagnostic pathways according to the initial imaging modality selected. Three country settings were evaluated (China, Japan and the US). The cost of the CRCLM diagnostic pathway was simulated from initial imaging procedure to treatment selection via a decision-tree model. In the US and China model, MDCT could be followed by ECCM-MRI, EOB-MRI and biopsy, CEUS could be followed by ECCM-MRI, EOB-MRI and biopsy, ECCM-MRI by EOB-MRI and biopsy, and EOB-MRI by biopsy only. In the Japan model, MDCT could be followed by EOB-MRI and CEUS, CEUS could be followed by EOB-MRI and EOB-MRI could be followed by CEUS. We hypothesised that despite an increased cost of contrast agent, EOB-MRI would be associated with a cost offset compared with other imaging modalities. In order to understand longer-term outcomes, lifetime treatment, as well as quality-adjusted life years (QALY) and the incremental cost-effectiveness ratio (ICER), were calculated using an extension Markov model. Different willingness-to-pay thresholds in each country were used; in the US it was 100,000 USD/QALY, in China it was of 242,928 CNY/QALY (3 times GDP per capita), while in Japan it was 5,000,000 JPY/QALY. In the US and China, EOB-MRI was compared with ECCM-MRI, MDCT and CEUS, while in Japan, EOB-MRI was compared with MDCT and CEUS due to local guideline differences. These countries were chosen since they perform high proportions of liver procedures as well as to allow insights into consistencies and differences in results across different countries and healthcare systems.
Methods
Model structure and perspective
This analysis uses an equivalent methodology to a previous assessment of diagnostic modality performance in HCCCitation17. This assumptions around treatment pathway and inputs are specific to CRCLM and have been separately validated with expert clinicians. A decision-tree model was built in MS Excel to simulate the CRCLM clinical pathway for different initial imaging modalities (from initial imaging procedures to treatment selection). Upon entering the model and at each decision node, patients were distributed to subsequent steps following calculations (outlined in Supplementary Table 1) that took into account the model inputs described below.
To model long-term cost-effectiveness of initial modality selection and costs associated with false-negative patients, an extension Markov model was developed.
This study was conducted from the payer perspective in each country, since the evaluation of costs is the primary outcome of the model.
Patient population
Patients entering the model were defined as those who had primary colorectal cancer with suspected liver metastases (patients who have received screening and been identified as having suspected CRCLM). The data from the literature used to inform the inputs for this model were validated as being representative of this patient population and current practice through expert interviews. The default patient number entering the model was 1,000.
Model input data
Input data for the model were derived from either the literature or, where literature data was not available, based on expert interviews with radiology stakeholders in each country. The radiology stakeholders were chosen as those who are decision makers within the diagnostic and treatment pathway for CRCLM patients in each country. This approach was in line with previous studies in this areaCitation15,Citation18 and ISPOR guidelines regarding HEOR researchCitation19. Data inputs retrieved from published literature were identified in targeted searches conducted in MEDLINE PubMed using MeSH terms. Initially the search was focused on papers published between 2015 and the end of 2020; however, this was expanded to include 2004 (when the use of gadoxetate disodium as an MRI contrast agent was first approved) to 31st December 2020 due to limited data. The literature search objectives, inclusion and exclusion criteria and search strings can be found in Supplementary Tables 2–4.
For the US model inputs, 11 interviews were undertaken, with four radiologists (all board-certified from academic settings), three oncologists (two from the community setting and one from the academic setting), two hospital pharmacists (one from the community setting and one from the academic setting), and two radiology administrators (both from the academic setting). For the Japan model inputs, three interviews were conducted with GI surgeons and one with a radiologist, all based in teaching or university hospitals; while for the China model inputs, two radiologists were interviewed as well as a hepatologist and a pharmacy director, all based at university hospitals. Where model data were taken from expert interviews, an average (mean) of the values reported by experts was taken to be the input value in the model. In the US, to reduce bias from extreme values, the lowest and highest reported values were excluded from the calculation.
For more information on model input data sources and the reasons for their use in the model, please see Supplementary Table 5.
Sensitivity and specificity
Sensitivity and specificity inputs were identified from the literature. Where possible, local studies or (if not available) meta-analyses comprising multiple studies were used to identify the sensitivity and specificity of each of the diagnostic modalities (). Biopsy was assumed to have a sensitivity and specificity of 100%, as used in previous health economic studiesCitation18. ECCM-MRI was excluded from the model in Japan because it is not recommended in the local clinical guidelines.
Table 1. Sensitivity and specificity of diagnostic modalities.
Prevalence
In line with previous publications in this areaCitation18, assumed prevalence of liver metastases in suspected CRCLM patients was taken from the expert interviews. In the US, it was reported to be 44%, in Japan 40% and in China 50%.
Follow-on confirmatory diagnostic procedures
For the US and Japan model inputs, percentages of follow-on confirmatory procedures required for each imaging modality were taken from expert interviews due to a lack of published evidence. For the China model inputs, frequency of follow-on confirmatory procedure data for MDCT, ECCM-MRI and EOB-MRI were taken from the literatureCitation18 (). Low CEUS usage in China meant that the published literature and Chinese expert interviews did not provide estimates for follow-on procedures; therefore, a conservative estimate that was lower than the values reported for CEUS in the US and Japan was chosen as an input.
Table 2. Percentage of follow-on confirmatory imaging procedures required, by imaging modality.
Waiting times for/between diagnostic procedures
Each step of the decision tree was assigned a time duration (), allowing the time for a diagnostic pathway to be modelled and compared across modalities. The length of time to final diagnosis and treatment decision consisted of the time to initial imaging for any given modality, as well as time between follow-on imaging procedures (if required), which was determined by how many rounds of diagnostic procedures patients got before a final diagnostic decision was made. The time between imaging procedures differed depending on the outcome of the initial imaging procedure being positive or negative. These timescales are listed in .
Table 3. Waiting times for/between diagnostic procedures.
Cost inputs
Diagnosis and treatment cost inputs ( and ) were estimated for each country based on local database records and previous studies. For the US model inputs, costs were based on the CMS claims database (average submitted charge amount)Citation23 as well as the RED BOOK from Micromedex list of drug pricesCitation24 (accessed November 2020), while for the Japan model inputs, costs were derived from the Ministry for Health, Labour and Welfare’s (MHLW) database for medical insurance claims and other medical fee informationCitation25 and the National Health Insurance drug price listCitation26. For the China model inputs, costs were derived from a previous health economic study by He et al.Citation18 and adjusted for inflation to 2021 using the Chinese consumer price index for healthcare, as well as interview data.
Table 4. Diagnosis costs.
Table 5. Treatment costs.
Decision tree
Decision-tree models for each country were based on local clinical guidelines for the diagnosis and treatment of CRCLMCitation7–10. The decision trees simulated the clinical pathway of patients with suspected CRCLM from initial imaging procedures to treatment selection. They were validated in expert interviews with radiology stakeholders in the US, Japan and China.
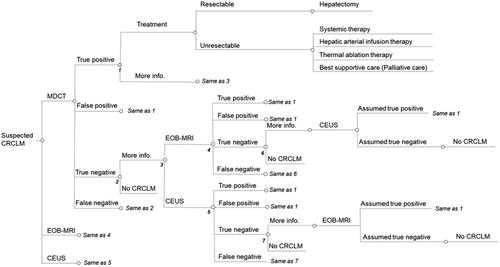
The decision-tree structures comprised 10 steps for the US and China () and seven for Japan (). In the US and China, patients were initially imaged with MDCT, ECCM-MRI, EOB-MRI or CEUS, while in Japan, patients were initially imaged with MDCT, EOB-MRI or CEUS. Biopsy was considered from the second round of diagnosis in the US and China; however, biopsy was not considered as an option in the diagnosis of CRCLM in Japan due to lack of inclusion in clinical guidelines.
Figure 1. Decision tree for the US and China. Based on local clinical guidelines and validated in expert interviews. Abbreviations. CRCLM, colorectal cancer liver metastases; MDCT, multidetector computed tomography; EOB-MRI, gadoxetic acid-magnetic resonance imaging; ECCM-MRI, extracellular contrast media-magnetic resonance imaging; CEUS, contrast-enhanced ultrasound; TACE, transarterial chemoembolization; SBRT, stereotactic body radiotherapy.
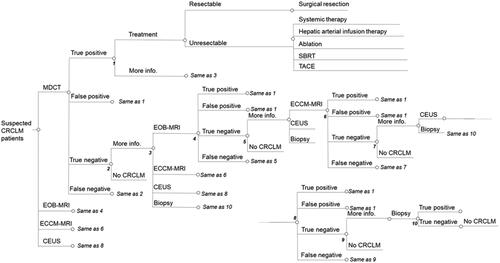
Figure 2. Decision tree for Japan. Based on local clinical guidelines and validated in expert interviews. Abbreviations. CRCLM, colorectal cancer liver metastases; MDCT, multidetector computed tomography; EOB-MRI, gadoxetic acid-magnetic resonance imaging; ECCM-MRI, extracellular contrast media-magnetic resonance imaging; CEUS, contrast-enhanced ultrasound.
After initial imaging, patients received either a positive (including true positive and false positive), negative (including true negative and false negative) or indeterminate diagnosis. Patients with a positive CRCLM diagnosis underwent treatment and these patients were designated as having resectable or unresectable disease with patients designated as resectable undergoing surgical resection (including all false-positive patients) and patients designated as unresectable undergoing one out of a range of possible treatment options. The distribution of patients to surgery and non-surgical treatment options were derived from expert interviews in each of the three countries. Patients classified as indeterminate proceeded for further imaging or biopsy and patients with a negative CRCLM diagnosis did not receive treatment and were not associated with any further steps.
Increasing proportionate use of EOB-MRI
To put the model results into the context of clinical practice, we tested model results using proportionate use of each modality. The original and alternative proportions are shown in . For the distribution of modalities in subsequent rounds of diagnoses, see Supplementary tables 6–12. For each comparison, EOB-MRI proportion was increased by 35% points from baseline to enable comparison between lower and higher levels of EOB-MRI use.
Table 6. Current and alternative distributions of each modality.
Markov model extension
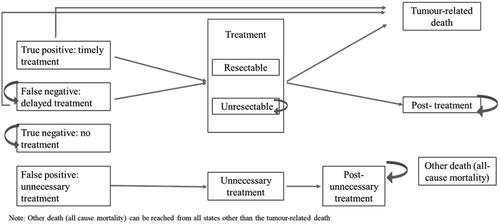
A Markov model extension was built to evaluate the number of false-negative patients and associated costs, over the long-term in the US, China and Japan. The model began after the decision-tree model and ran over a lifetime horizon. For each country, the model had 11 health states to which patients could be assigned. The Markov diagrams are shown in and . Inputs for the model were derived from the literature;Citation5,Citation29–32 where there were gaps in the literature, expert elicitation interviews were used to fill these (Supplementary tables 13–15). Costs assigned to each stage of treatment were the same as for the decision-tree model ( and ).
Figure 3. China and Japan Markov model diagram.
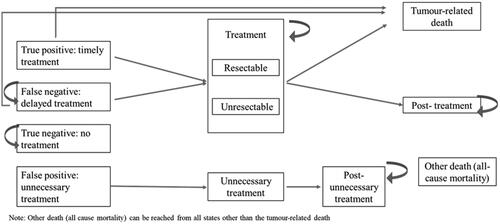
Figure 4. US Markov model diagram.
Sensitivity analyses
Several sensitivity analyses were undertaken for both the decision tree models and the Markov model extension.
For the both the decision tree models and the Markov model, a one-way deterministic sensitivity analysis was conducted to evaluate the relative importance of different inputs on the cost offset. To test that the model results held true within the range of values presented in the literature and reported by experts, upper and lower values for key inputs were tested to understand the impact on cost offset. Tornado plots were generated to show the top 12 model inputs in terms of their impact on cost offset for the decision tree models, and on the ICER for the Markov model. Upper and lower limits were chosen to be at the extremes or outside of the range of values identified across the literature or reported by experts in interviews, and if this information was unavailable, parameters were varied by ±25%.
A two-way sensitivity analysis for the decision tree models was undertaken for EOB-MRI sensitivity and specificity to assess the cost-offset results when EOB-MRI sensitivity and specificity are varied simultaneously.
A scenario analysis was also undertaken for the decision tree models to understand the cost offset when the distribution of patients among the initial imaging modalities was varied. In the scenario analysis, the distribution of EOB-MRI was varied from 10% to 70% (10%, 40%, 55% and 70%) compared with 9.3% in the US, 25% in Japan and 18% in the China model.
For the Markov model, a probabilistic sensitivity analysis was done to understand the probability of the increased use of EOB-MRI being cost-effective.
Results
EOB-MRI had a higher true positive rate and lower false negative rate compared with other modalities
In all three countries, the percentage of patients diagnosed as true positive was closest to reported prevalence (45% in the US, 40% in Japan, 50% in China) in patients initially imaged with EOB-MRI. In the US, it was 42.8%, compared with 38.4% for MDCT, 40.3% for ECCM-MRI and 42.2% for CEUS. In Japan, EOB-MRI had 36.6% true positives compared with 34.6% for MDCT and 36.5% for CEUS. In China, EOB-MRI had 48.3% true positives, compared with 42.4% for MDCT, 45.4% for ECCM-MRI and 45.7% for CEUS.
EOB-MRI also had the lowest proportion of false-negative diagnoses compared with other modalities in all three countries . In the US it was 2.2% for EOB-MRI compared with 6.6% for MDCT, 4.7% for ECCM-MRI, and 2.8% for CEUS. In Japan, the rate of false negatives was 3.4% for EOB-MRI compared with 5.4% for MDCT and 3.5% for CEUS, while in China false-negative rates were 1.7% for EOB-MRI compared with 7.6% for MDCT, 4.6% for ECCM-MRI and 4.3% for CEUS.
Figure 5. - False-negative rates for each modality in each country. ECCM-MRI not recommended in the guidelines in Japan, therefore there is no column for ECCM-MRI in Japan. Abbreviations. US, United States; MDCT, multidetector computed tomography; EOB-MRI, gadoxetic acid-magnetic resonance imaging; ECCM-MRI, extracellular contrast media-magnetic resonance imaging; CEUS, contrast-enhanced ultrasound.

In Japan, EOB-MRI had the lowest proportion of false-positive diagnoses compared with other modalities (1.9% compared to 2.0% for MDCT and 4.0% for CEUS), while in China and the US, MDCT had the lowest proportion of false-positive diagnoses. In the US, 3.0% of patients initially diagnosed with MDCT had a false-positive diagnosis compared to 4.4% for ECCM-MRI, 4.5% for CEUS and 6.9% for EOB-MRI. In China, 4.3% of patients initially diagnosed with MDCT had a false-positive diagnosis compared to 5.1% for ECCM-MRI, 5.6% for CEUS and 4.6% for EOB-MRI.
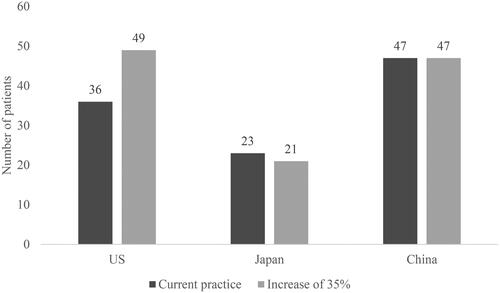
With EOB-MRI there was a reduced risk that patients who do have CRCLM will receive a false-negative diagnosis. Increasing the proportion of patients initially imaged with EOB-MRI by 35%, resulted in a decrease in the number of false-negative diagnoses (from 58 to 44 out of 1,000 in the US; from 46 to 41 in Japan; and from 53 to 38 in China) (). In Japan, increasing the proportion of patients initially imaged with EOB-MRI resulted in a decrease in patients receiving unnecessary treatment (from 23 to 21). In China, unnecessary treatment patient numbers stayed constant (47), and in the US the number increased (from 36 to 49 out of 1,000) (). The increase in patients receiving unnecessary treatment in the US is due to more patients receiving a false-positive diagnosis, when the proportion of EOB-MRI as the initial imaging modality is increased. This is driven by the reduced specificity of EOB-MRI compared to other modalities, as reported by Vreugdenburg et al.Citation14, and the higher biopsy usage rate of other modalities.
Figure 6. Number of patients out of 1,000 receiving a false-negative diagnosis in current practice compared to an increase in EOB-MRI usage by 35%. Abbreviations. US, United States; EOB-MRI, geodetic acid-magnetic resonance imaging.
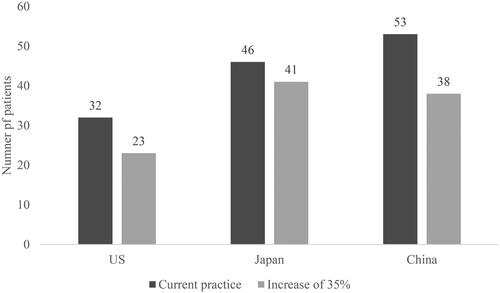
Figure 7. Number of patients out of 1,000 receiving unnecessary treatment in current practice compared to an increase by 35% in the use of EOB-MRI. Abbreviations. US, United States; EOB-MRI, gadoxetic acid-magnetic resonance imaging.
Patients initially imaged with EOB-MRI required fewer confirmatory diagnostic procedures
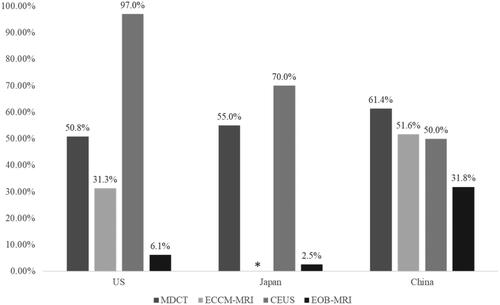
Follow-on confirmatory diagnostic requirements are shown in . In the US and Japan, requirements for follow-on confirmatory diagnostic procedures were highest in patients initially receiving CEUS (97% in the US and 70% in Japan), followed by CE-CT (50.8% in the US and 54.5% in Japan) then ECCM-MRI (31.3% in the US) and finally EOB-MRI (6.1% in the US and 2.5% in Japan). In China, follow-on confirmatory diagnostic requirements were highest in patients initially imaged with MDCT (61.4%) followed by ECCM-MRI (51.6%) then CEUS (50.0%) and EOB-MRI (31.8%).
Figure 8. Percentage of follow-on confirmatory diagnostic procedures required, by imaging modality. ECCM-MRI is not recommended in Japan, and therefore there is no column for ECCM-MRI in Japan. Abbreviations. US, United States; MDCT, multidetector computed tomography; EOB-MRI, gadoxetic acid-magnetic resonance imaging; ECCM-MRI, extracellular contrast media-magnetic resonance imaging; CEUS, contrast-enhanced ultrasound.
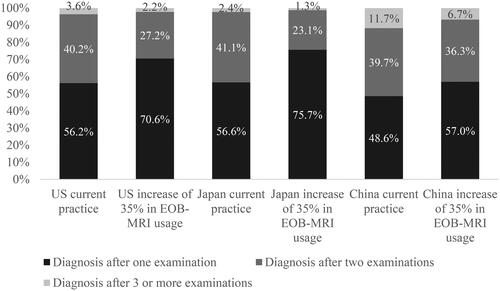
As a consequence of increasing the proportion of patients initially imaged with EOB-MRI from current levels (9.3% for the US, 25% for Japan and 18% for China) by 35% points there was an increase in the percentage of patients receiving a final diagnosis after one examination (). In the US, increasing EOB-MRI usage from 9.3% to 44% resulted in the proportion of patients receiving a final diagnosis after one examination increasing by 14.4% from 56.2% to 70.6%, and decreasing from 40.2% to 27.2% in patients receiving a final diagnosis after two examinations. The percentage of patients requiring three or more examinations decreased from 3.6% to 2.2% when the proportion of patients initially imaged with EOB-MRI was increased by 35%. In Japan, the proportion of patients receiving a final diagnosis after one examination increased by 19.1% from 56.6% to 75.7% and decreased by 18.0% from 41.1% to 23.1% in patients receiving a final diagnosis after two examinations. The percentage of patients requiring three or more examinations decreased from 2.4% to 1.3% when the proportion of patients initially imaged with EOB-MRI increased by 35%. In China increasing EOB-MRI usage by 35%, from 18% to 53%, resulted in the proportion of patients receiving a final diagnosis after one examination increasing by 8.4% from 48.6% to 57.0% and decreasing by 3.4% from 39.7% to 36.3% in patients receiving a final diagnosis after two examinations. The percentage of patients requiring three or more examinations decreased from 11.7% to 6.7% when the proportion of patients initially imaged with EOB-MRI increases from 18% to 53%.
Figure 9. Distribution of patients according to number of examinations to achieve final diagnosis. Abbreviation. US, United States.
Patients initially imaged with EOB-MRI had shorter times from initial consultation to diagnosis and treatment decision
The average time from initial consultation to final diagnosis and treatment decision for each modality (Supplementary figure 1) was estimated based upon the time to initial imaging and duration between imaging procedures, considering the percentage of patients requiring further imaging after each initial imaging modality. This resulted in average time to diagnosis and treatment decision being the highest for patients initially imaged with CEUS in the US and Japan (5.7 weeks in the US and 11.3 weeks in Japan) and MDCT in China (20.2 weeks) and lowest in patients initially imaged with EOB-MRI (1.6 weeks in the US, 2.4 weeks in Japan and 8.6 weeks in China). MDCT had an average waiting time to diagnosis of 3.4 weeks in the US and 9.9 weeks in Japan, ECCM-MRI had an average waiting time of 2.8 weeks in the US and 15.6 weeks in China and CEUS had an average waiting time of 15.1 weeks in China.
The model results showed that increasing the proportion of patients initially imaged with EOB-MRI by 35% points decreased average waiting time to final diagnosis and treatment decision by 0.61 weeks in the US, 2.73 weeks in Japan and 3.24 weeks in China (Supplementary figure 2).
Increasing the proportionate use of EOB-MRI resulted in a cost offset per patient
In all three countries, there was a cost offset per patient (excluding false-negative patients) for diagnosis and treatment of CRCLM when the use of EOB-MRI as a first-line imaging modality increased from current rates by 35% points. In the US there was a total cost offset of USD 201 per patient, in Japan there was a total cost offset of JPY 6,284 per patient and in China there was a total cost offset of CNY 446 per patient. In the US, the primary contribution was a reduction in biopsy costs (USD 163) and scan costs (USD 103) due to fewer patients having to undergo further diagnostic procedures. This reduction in diagnostic costs offsets the increase in unnecessary treatment costs per patient (USD 97). In Japan and China, there was a reduction in unnecessary treatment cost per patient of JPY 3,404 and CNY 270 respectively due to the increased accuracy of EOB-MRI compared with other modalities. In Japan the majority of the cost offset was due to a reduction in contrast agent costs (JPY 3,575) as well as a reduction in unnecessary treatment (JPY 3,404) due to the increased accuracy of EOB-MRI compared with other modalities. In China, the primary driver of cost offset was a reduction in scan cost (CNY 713).
Contrast agent cost is a very small proportion of total costs of care for CRCLM. In the US, the model shows that increasing the proportion of patients imaged with EOB-MRI by 35% points resulted in per-patient costs of care for CRCLM increasing by USD 333 from USD 11,832 to USD 11,991, with the contrast agent costs representing 1.5% and 1.4% (USD 181 and USD 174) respectively. In Japan, the model showed that increasing the proportion of patients imaged with EOB-MRI from 25% to 60% resulted in per-patient costs decreasing from JPY 628,766 to JPY 636,431, with contrast agent cost being JPY 16,569 and JPY 15,536, representing 2.6% and 2.4% respectively. In China, the model showed that increasing the proportion of patients imaged with EOB-MRI from 18% to 53% resulted in per-patient costs increasing from CNY 48,574 to CNY 49,991, with contrast agent cost being CNY 827 and CNY 986, representing 1.7% and 2.0%, respectively.
Using EOB-MRI as a first-line imaging modality decreased false-negative patient numbers over a lifetime horizon
An extension Markov model was built to quantify the lifetime costs and number of false-negative patients and was run with a 6-month cycle length over a lifetime horizon. This aligns with clinical guidelines that recommend surveillance every 6 months for patients at risk of CRCLMCitation10,Citation33. When the number of patients initially imaged with EOB-MRI increased by 35%, the number of false-negative patients decreased from 113 to 86 out of 1,000 in the US, from 173 to 143 out of 1,000 in China, and from 663 to 583 in Japan. Average treatment cost per patient slightly increased due to increased accuracy of diagnosis, and therefore, more patients receiving treatment in their lifetime. In the US it increased from 30,341 USD to 30,858 USD, in China from 91,381 CNY to 92,987 CNY, and 1,313,349 JPY to 1,331,326 JPY in Japan. In the US, the alternative practice produced a gain of 0.02 QALYs at an incremental cost of 562 USD, yielding an ICER of 34,144 USD. With a theoretical willingness-to-pay of 100,000 USD, the probability of alternative practice being cost effective compared to the current practice was 92%. In China, the alternative practice produced an additional gain of 0.02 QALYs at an incremental cost of 1,584 CNY, yielding an ICER of 69,488 CNY/QALY. With a willingness-to-pay of 242,928 CNY/QALY (3 times GDP per capita), the probability of alternative practice being cost-effective compared to the current practice was 100%. In Japan, the alternative practice produced an additional gain of 0.01 QALY at an incremental cost of 16,973 JPY, yielding an ICER of 1,354,691 JPY. With a willingness-to-pay of 5,000,000 JPY, the probability of alternative practice being cost-effective compared to current practice was 91%.
Sensitivity and scenario analyses
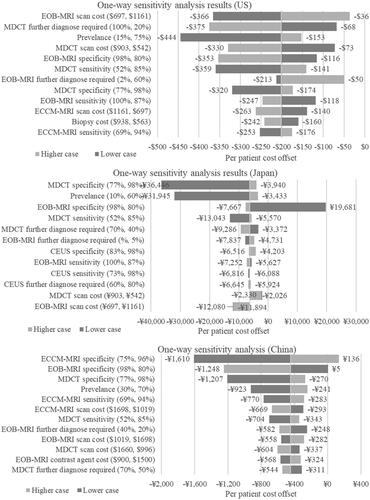
A one-way sensitivity analysis () showed that in the US model, the inputs that had the most impact on the per patient cost-offset result were EOB-MRI scan cost, the percentage of patients requiring further imaging after an initial MDCT scan, and prevalence of CRCLM. For CRCLM prevalence, the lower case of 15% resulted in a cost offset of USD 444 and the upper case of 75% resulted in a cost offset of USD 153. When EOB-MRI scan cost was lowered to USD 697, the cost offset is USD 366 and if increased to USD 1,161 the cost offset is USD 36. In Japan, the inputs that had the most impact on the per patient cost-offset result were MDCT specificity, CRCLM prevalence and EOB-MRI specificity. When MDCT specificity was lowered to 77%, the cost offset was JPY 36,446 and if it was increased to 98% the cost offset was JPY 3,940. For CRCLM prevalence, the lower case of 10%, resulted in a cost offset of JPY 31,945 and the upper case of 60% resulted in a cost offset of JPY 3,433 while for EOB-MRI specificity, the lower case of 80% resulted in a cost increase of JPY 19,681, and the upper case of 98% resulted in a cost offset of JPY 7,667. In the China model, the inputs that had the most impact on the per patient cost-offset result were ECCM-MRI specificity, EOB-MRI specificity, and MDCT specificity. When ECCM-MRI specificity was lowered to 75%, the cost offset was CNY 1,610 and if it was increased to 96%, there was a cost increase of CNY 136. When EOB-MRI specificity was lowered to 80%, there was a cost increase of CNY 5 and if increased to 98% the cost offset was CNY 1,248.
Figure 10. One-way sensitivity analysis results. The numbers in the brackets after the variables show the upper and lower limits tested in the one-way sensitivity analysis. Abbreviations. US, United States; MDCT, multidetector computed tomography; EOB-MRI, gadoxetic acid-magnetic resonance imaging; ECCM-MRI, extracellular contrast media-magnetic resonance imaging; CEUS, contrast-enhanced ultrasound.
A two-way sensitivity analysis for EOB-MRI sensitivity and EOB-MRI specificity was carried out to assess the cost offset under different EOB-MRI sensitivities and specificities. The results for the US model show that there is only a cost increase when a) both EOB-MRI sensitivity and specificity are lower than 85%, b) sensitivity is lower than 87% and specificity is lower than 76% or c) sensitivity is less than 75% and specificity is less than 88%. The results for the Japan model show that there is only a cost increase when a) EOB-MRI sensitivity is lower than 65% and specificity is lower than 97% or b) sensitivity is lower than 84% and specificity is lower than 94%. The results for the China model show that there is only a cost increase when a) both EOB-MRI sensitivity and specificity are lower than 85%, b) sensitivity is lower than 87% and specificity is lower than 82% or c) sensitivity is less than 63% and specificity is less than 88%.
Scenario analyses were undertaken to understand the cost-offset results with different proportions of initial imaging modalities. The distributions for each modality are shown in , and cost-offset results in Supplementary figure 3. The results demonstrate that there is always a cost offset when EOB-MRI usage is increased from baseline values, and if EOB-MRI usage is lower than current practice, there is a cost increase.
Table 7. Current practice and alternative scenario modality distributions for scenario analyses.
A one-way sensitivity analysis was undertaken which showed that the value that affected the ICER the most was the post treatment utility in the US and China, and the true negative utility value in Japan. In the US, the lower case of 0.53 resulted in an ICER of 107,515 USD while the upper case of 0.89 resulted in an ICER of 20,295 USD. In China, the lower case of 0.53 resulted in an ICER of 99,591 CNY while the upper case of 0.89 resulted in an ICER of 53,359 CNY. In Japan, the lower case of 0.68 resulted in an ICER of 3,405,856 JPY while the upper case of 1.00 resulted in an ICER of 1,068,651 JPY. For detailed results see Supplementary figure 4.
Discussion
In this study, we hypothesised that EOB-MRI would be associated with a cost offset compared with other imaging modalities in the diagnosis of CRCLM. The results of three models in the US, China and Japan consistently demonstrated cost offsets per patient when increasing the use of EOB-MRI as first-line imaging modality in the diagnosis of CRCLM, as well as lower rates of further diagnostic imaging and shorter times to final diagnosis.
It should be noted that false-negative patients were excluded from the cost-offset analysis due to their future diagnosis and treatment costs falling outside of the decision-tree model time horizon (from initial consultation to a final diagnosis and treatment decision) as well as uncertainties around the future costs that they would incur. Since these models show that EOB-MRI has the lowest false-negative rate compared with the other diagnostic modalities, patients initially imaged with EOB-MRI have the least uncertainty regarding future treatment and diagnosis costs. The Markov model shows that this is also true over a lifetime horizon, with fewer false-negative diagnoses when there is an increase in EOB-MRI use. There was a slight increase in total average patient costs over a lifetime horizon due to increased accuracy of diagnosis and, therefore, more patients undergoing treatment in their lifetime. However, in all three countries, the ICER was far below standard willingness-to-pay thresholds. All the results of the sensitivity analysis, (except one value for the US) are also within the willingness-to-pay thresholds, suggesting that increasing the use of EOB-MRI as an initial imaging modality for CRCLM diagnosis is cost effective.
The 2016 guideline for diagnostic imaging in Japan recommends EOB-MRI at a grade A (firm scientific evidence strongly recommending the procedure), dynamic CT at grade B (scientific evidence recommending the procedure) and ultrasonography (including CEUS) as grade C1 (there is no scientific evidence, but the procedure is recommended)Citation8. The guideline recommends that EOB-MRI has a superior diagnostic profile compared with ultrasound and CT and, therefore, it is strongly recommended in the diagnosis of CRCLM. Our results show that in Japan, patients imaged with EOB-MRI have the lowest false-negative and highest true-positive rate compared with other modalities; consequently, our results demonstrate that better alignment of clinical practice with guidelines will have cost as well as clinical benefits.
In China, guidelines recommend that MRI using a liver-cell-specific contrast agent should be used where necessaryCitation10. Like in Japan, our results for the US model show that EOB-MRI is associated with the lowest rate of false negatives compared with other modalities. The 2017 ACR (American College of Radiology) Appropriateness Criteria for suspected liver metastases state that MRI and multiphase CT (with and without contrast) are the primary imaging modalities in the assessment of liver metastasesCitation9 and 2020 ACR Appropriateness Criteria for liver lesion initial characterization states that MRI and CT (with and without contrast) are usually appropriate, and that CEUS is usually or may be appropriate for liver lesion characterizationCitation7. However, unlike in Japan, no preferential position is currently given to EOB-MRI within the guidelines. The US, China and Japan models developed for this study have shown the benefits of increasing EOB-MRI use from a cost-offset perspective but increasing EOB-MRI use can also result in benefits for patients. The VALUE trial showed that using EOB-MRI resulted in fewer surgical plan modifications during surgery (28% compared with 47% for CECT and 32% for ECCM-MRI) and fewer patients having an increase in surgery duration due to modified surgical plans (13% compared with 29% for CECT and 16% for ECCM-MRI).Citation34
Our model results are consistent with previous studies that have been conducted comparing the use of EOB-MRI with other modalities for the diagnosis of CRCLM. Two previous health economic studies have been conducted; a 2009 study with European patients in Germany, Italy and SwedenCitation15 and a multinational study (Switzerland, Sweden, Italy, Spain, Thailand, Austria, Germany and Korea) as part of the VALUE (multicentre randomized comparison study to eVALUatE outcomes and resource needs of imaging and treatment following gadoxetic acid-enhanced MRI of the liver, in comparison with ECCM-MRI and CE-CT in patients with a history of colorectal cancer and known or suspected metachronous liver metastases) trialCitation16,Citation34. The European study compared EOB-MRI with ECCM-MRI and MDCT and reported lower rates of further imaging required after EOB-MRI (8.6%) compared with ECCM-MRI (18.5%) and MDCT (23.5%). This trend was also reported in the VALUE trial with further imaging requirements being 0% for EOB-MRI compared with 17.0% for ECCM-MRI and 39.3% for CE-MDCT, consistent with the results in this study. The 2009 study found that EOB-MRI was cost saving compared with both ECCM-MRI and MDCT in Sweden, and compared with ECCM-MRI in Italy and Germany; while the VALUE trial found that the diagnostic work-up cost (calculated using the cost of imaging procedure, cost of contrast media and the cost of a consensus meeting) of using EOB-MRI resulted in savings compared with ECCM-MRI in all countries except Thailand and compared with CE-MDCT in all countries except Korea and Spain. It was unclear what the drivers of the increased cost of EOB-MRI compared with other modalities were in Thailand, Korea and Spain. The consistency of our results with previous studies, as well as across markets within this study suggest that the trends observed reflect the benefits of using EOB-MRI as a first-line imaging modality in the diagnosis of CRCLM. Our model results were also consistent with a previously published comparative study that was conducted for the diagnosis of HCCCitation17. Most of the findings for the CRCLM indication were similar to those for HCC. An important difference was that EOB-MRI did not have the lowest rate of false-positive results compared to other modalities in CRCLM (while it did in HCC). This was due to lower reported specificity for EOB-MRI for the detection of CRCLM versus HCC. However, EOB-MRI was consistently cost effective across both indications - and the preferred option for delivering a rapid diagnostic result.
Our study had some limitations. Firstly, the decision tree models are a simplification of the clinical pathway, and it assumes that all patients would have the same access to imaging and are able to undergo all imaging modalities. The models cannot capture all the variation and complexities of the real-life clinical decision-making pathway and therefore, only the key pathways and outcomes were included in the model. In interviews with some US experts, it was stated that PET-CT may be used in the diagnosis of CRCLM; however, due to lack of inclusion in the US guidelines, it was not included in the decision tree. Due to the costs that PET-CT examinations incur, its inclusion in the model would likely increase costs, and therefore its exclusion may represent a conservative estimate of the cost benefits of the use of EOB-MRI early in the diagnostic pathway. An assumption of 100% accuracy of biopsy was made, which may be untrue in clinical practice; however, this assumption has been made in previous diagnostic modelsCitation18. Secondly, some model inputs were estimated from interviews with clinical experts due to lack of published evidence specific to the countries being considered. Thirdly, only direct treatment costs were included in the models and associated productivity and quality of life losses were not included; however, available literature suggests that advanced disease is associated with lower quality of life.Citation35 We also used Medicare charges as a basis for US cost inputs, despite not all CRCLM patients in the US falling into the Medicare population. Finally, the additional Markov model investigating long-term patient outcomes and associated costs is associated with a number of assumptions including that patients do not relapse, and that treatment with resection is curative. These assumptions were validated in expert interviews. This highlights the need for further studies to evaluate the real-world impact of different diagnostic strategies and their long-term impact on patient outcomes and system costs.
Conclusion
The models that have been developed in this study consistently demonstrate that early use of EOB-MRI in the diagnostic pathway for CRCLM delivers the most rapid path to accurate diagnosis, as well as downstream cost-savings, despite an initial higher cost of contrast agent. They also show that using EOB-MRI is cost-effective in the long term.
Transparency
Author contributions
All authors were involved with all aspects of this work (including conception and design; analysis and interpretation of the data and drafting and review of the paper) and agree to be accountable for all aspects of the work.
Reviewer disclosures
Peer reviewers on this manuscript have received an honorarium from JME for their review work but have no other relevant financial relationships to disclose.
Both Editor in Chief helped with adjudicating the final decision on this paper.
Supplemental Material
Download MS Word (157.6 KB)Acknowledgements
We would like to acknowledge Gemma Zhu who provided vital input to the development of the model in its early stages. We would also like to thank Antonio Remiro-Azócar and Marie DiFiore for their review and input to the project.
Declaration of financial/other relationships
MB, GK, DZ, NF and ME are employed by Bayer AG. AC, GJ and JH are employed by Wickenstones Ltd., the agency involved in the development and execution of this study.
Additional information
Funding
References
- Globocan. Colorectal cancer Fact Sheet 2020. 2020. https://gco.iarc.fr/today/data/factsheets/cancers/10_8_9-Colorectum-fact-sheet.pdf
- Manfredi S, Lepage C, Hatem C, et al. Epidemiology and management of liver metastases from colorectal cancer. Ann Surg. 2006;244(2):254–259.
- van der Pool AE, Damhuis RA, Ijzermans JN, et al. Trends in incidence, treatment and survival of patients with stage IV colorectal cancer: a population-based series. Colorectal Dis. 2012;14(1):56–61.
- Zarour LR, Anand S, Billingsley KG, et al. Colorectal Cancer liver metastasis: evolving paradigms and future directions. Cell Mol Gastroenterol Hepatol. 2017;3(2):163–173.
- Adam R, Kitano Y. Multidisciplinary approach of liver metastases from colorectal cancer. Ann Gastroenterol Surg. 2019;3(1):50–56.
- Oliva MR, Saini S. Liver cancer imaging: role of CT, MRI, US and PET. Cancer Imaging. 2004;4(Spec No A):S42–S46.
- Chernyak M, Horowitz JM, Kamel IR, et al. ACR Appropriateness Criteria® liver lesion-initial characterization. J Am Coll Radiol. 2020;17(11S):S429–S446.
- Guideline JcfTJI. Japanese imaging guideline. 2016. http://www.radiology.jp/content/files/diagnostic_imaging_guidelines_2013_e.pdf
- Kaur H, Hindman NM, Al-Refaie WB, et al. ACR Appropriateness criteria(®) suspected liver metastases. J Am Coll Radiol. 2017;14(5s):S314–s325.
- Xu J, Fan J, Qin X, et al. Chinese guidelines for the diagnosis and comprehensive treatment of colorectal liver metastases (version 2018). J Cancer Res Clin Oncol. 2019;145(3):725–736.
- Floriani I, Torri V, Rulli E, et al. Performance of imaging modalities in diagnosis of liver metastases from colorectal cancer: a systematic review and meta-analysis. J Magn Reson Imaging. 2010;31(1):19–31.
- Niekel MC, Bipat S, Stoker J. Diagnostic imaging of colorectal liver metastases with CT, MR imaging, FDG PET, and/or FDG PET/CT: a meta-analysis of prospective studies including patients who have not previously undergone treatment. Radiology. 2010;257(3):674–684.
- Asato N, Tsurusaki M, Sofue K, et al. Comparison of gadoxetic acid-enhanced dynamic MR imaging and contrast-enhanced computed tomography for preoperative evaluation of colorectal liver metastases. Jpn J Radiol. 2017;35(4):197–205.
- Vreugdenburg TD, Ma N, Duncan JK, et al. Comparative diagnostic accuracy of hepatocyte-specific gadoxetic acid (Gd-EOB-DTPA) enhanced MR imaging and contrast enhanced CT for the detection of liver metastases: a systematic review and meta-analysis. Int J Colorectal Dis. 2016;31(11):1739–1749.
- Zech CJ, Grazioli L, Jonas E, et al. Health-economic evaluation of three imaging strategies in patients with suspected colorectal liver metastases: gd-EOB-DTPA-enhanced MRI vs. extracellular contrast media-enhanced MRI and 3-phase MDCT in Germany, Italy and Sweden. Eur Radiol. 2009;19(Suppl 3):S753–S763.
- Zech CJ, Justo N, Lang A, et al. Cost evaluation of gadoxetic acid-enhanced magnetic resonance imaging in the diagnosis of colorectal-cancer metastasis in the liver: results from the VALUE trial. Eur Radiol. 2016;26(11):4121–4130.
- Blankenburg M, Elhamamy M, Zhang D, et al. Evaluation of the health economic impact of initial diagnostic modality selection in patients suspected of having HCC in China and the USA. J Med Econ. 2022;25(1):1015–1029.
- He X, Wu J, Holtorf AP, et al. Health economic assessment of Gd-EOB-DTPA MRI versus ECCM-MRI and multi-detector CT for diagnosis of hepatocellular carcinoma in China. PLoS One. 2018;13(1):e0191095.
- Briggs AH, Weinstein MC, Fenwick EA, et al. Model parameter estimation and uncertainty analysis: a report of the ISPOR-SMDM modeling good research practices task force working group-6. Med Decis Making. 2012;32(5):722–732.
- Mao Y, Chen B, Wang H, et al. Diagnostic performance of magnetic resonance imaging for colorectal liver metastasis: a systematic review and meta-analysis. Sci Rep. 2020;10(1):1969.
- Cantisani V, Grazhdani H, Fioravanti C, et al. Liver metastases: contrast-enhanced ultrasound compared with computed tomography and magnetic resonance. World J Gastroenterol. 2014;20(29):9998–10007.
- Shiozawa K, Watanabe M, Ikehara T, et al. Comparison of contrast-enhanced ultrasonograpy with Gd-EOB-DTPA-enhanced MRI in the diagnosis of liver metastasis from colorectal cancer. J Clin Ultrasound. 2017;4;45(3):138–144.
- Medicare Provider Utilization and Payment Data: Physician and Other Supplier PUF CY2017 [Internet]. 2017. Available from https://data.cms.gov/Medicare-Physician-Supplier/Medicare-Provider-Utilization-and-Payment-Data-Phy/fs4p-t5eq/data.
- RED BOOK Online from Micromedex [Internet]. Available from: http://www.micromedexsolutions.com/.
- Database for medical insurance claims and other medical fee information [Internet]. Available from: https://shinryohoshu.mhlw.go.jp/shinryohoshu/searchMenu/.
- List of items listed on the NHI drug price standard and information on generic drugs [Internet]. Available from: https://www.mhlw.go.jp/topics/2020/04/tp20200401-01.html.
- Goossens N, Singal AG, King LY, et al. Cost-effectiveness of risk score-stratified hepatocellular carcinoma screening in patients with cirrhosis. Clin Transl Gastroenterol. 2017;8(6):e101–e101.
- Durand-Zaleski I, Roche B, Fagniez P-L, et al. Economic Implications of hepatic arterial infusion chemotherapy in treatment of nonresectable colorectal liver metastases. J Natl Cancer Inst. 1997;89(11):790–795.
- Chen H, Chen L. Estimating cost-effectiveness associated with all-oral regimen for chronic hepatitis C in China. PLoS One. 2017;12(4):e0175189.
- Nishie A, Goshima S, Haradome H, et al. Cost-effectiveness of EOB-MRI for hepatocellular carcinoma in Japan. Clin Ther. 2017;39(4):738–750.e4.
- Raoof M, Jutric Z, Haye S, et al. Systematic failure to operate on colorectal cancer liver metastases in California. Cancer Med. 2020;9(17):6256–6267.
- Roberts KJ, Sutton AJ, Prasad KR, et al. Cost-utility analysis of operative versus non-operative treatment for colorectal liver metastases. Br J Surg. 2015;102(4):388–398.
- Hashiguchi Y, Muro K, Saito Y, et al. Japanese Society for Cancer of the Colon and Rectum (JSCCR) guidelines 2019 for the treatment of colorectal cancer. Int J Clin Oncol. 2020;25(1):1–42.
- Zech CJ, Korpraphong P, Huppertz A, et al. Randomized multicentre trial of gadoxetic acid-enhanced MRI versus conventional MRI or CT in the staging of colorectal cancer liver metastases. Br J Surg. 2014 May;101(6):613–621.
- Kohn CG, Singh P, Korytowsky B, et al. Humanistic and economic burden of hepatocellular carcinoma: systematic literature review. Am J Manag Care. 2019;25(2 Spec No):Sp61–sp73.