
Abstract
Objectives
The aim of the present study was to determine incidence-based short- and long-term healthcare costs attributable to community-acquired pneumonia (CAP) from the healthcare payer perspective in Ontario, Canada.
Methods
We conducted a retrospective population-based matched cohort study of residents in Ontario, Canada using health administrative data. We identified subjects with an incident episode of CAP (exposed subjects) between 1 January 2012 and 31 December 2014. The index date of each episode was based on the first inpatient or outpatient claim for pneumonia. Exposed subjects were matched without replacement to unexposed subjects from the general population using hard and propensity score matching on age, sex, income quintile, rural residence, comorbidities, and healthcare costs prior to index date. Attributable costs represented the mean difference in costs between the exposed subjects and their matched pairs.
Results
We identified 692,090 subjects with at least one episode of CAP between 1 January 2012 and 31 December 2014. Adults aged 65 years and older had the highest annual incidence rate of 50.1 episodes per 1,000 person-years, while adults aged 18–64 years and children (aged 0–17) had incidence rates of 12.9 and 24.7 episodes per 1,000 person-years, respectively. The majority of episodes involved care exclusively in the outpatient setting (92.6%), with most of these episodes involving a single physician visit. The mean attributable costs were $1,595 (95% CI: $1,572–$1,616) per outpatient CAP episode and $12,576 (95% CI: $12.392–$12,761) per inpatient CAP episode. Attributable costs were significantly higher for adult subjects and those with time spent in the intensive care unit. Alternative case definitions yielded different results, although demonstrated the same overall trends across groups.
Conclusion
CAP is associated with substantially increased acute and long-term healthcare costs compared to unexposed subjects. This study highlights the burden of CAP in both the inpatient and outpatient setting, and will serve to inform strategic healthcare planning for future interventions and healthcare programs.
Introduction
Community-acquired pneumonia (CAP) is a common acute respiratory condition that disproportionately affects young children, older adults, and patients with chronic or immunocompromising conditionsCitation1,Citation2. The severity of CAP can vary considerably between cases, with the majority of episodes only requiring care in the outpatient settingCitation3. Nevertheless, CAP remains a substantial cause of morbidity and mortality, with many patients requiring hospitalization, intensive care unit admission, or mechanical ventilationCitation4–6. In 2017, pneumonia represented the sixth most common cause of death in Canada when considered alongside influenzaCitation7. The overall incidence of all-cause pneumonia hospitalizations in Canada ranged from 611 per 100,000 people in those under 5 years of age to 3,002 per 100,000 in those over the age of 80Citation1. There is considerable variation in incidence rates between provinces, with Ontario having the lowest incidence across the countryCitation1. In the Ontario Burden of Infectious Disease Study (ONBOIDS), pneumonia was identified as the most burdensome infectious disease syndrome in terms of the years and quality-of-life lost to infection. The study estimated that, each year, pneumonia was responsible for an average of 1,954 deaths and 252,473 health care utilization episodes in the provinceCitation8.
Several Canadian studies have attempted to quantify the economic burden of CAP, with estimated costs per case ranging from $1,836 to $8,993Citation9–12. However, these studies have been limited to specific populations, were conducted more than 10 years ago, or focused exclusively on hospitalization costs. To fully understand the population-level impact of CAP on the healthcare system, it is important to capture healthcare resource utilization and costs across patient populations and settings. This includes incorporating outpatient costs and the consequences of disease sequelae after the acute phase of illness, as recent research in other countries has demonstrated that patients with pneumonia can have higher measured healthcare costs up to 3 years afterwardsCitation13,Citation14. Given the recent focus on the impact and management of respiratory infections, high-quality economic evidence is important for strategic health system planning to adequately assess the full spectrum of potential benefits from interventions. The purpose of our study is to assess the epidemiology and attributable healthcare costs of CAP among residents of all ages in Ontario, Canada.
Methods
Study design
We conducted a population-based matched cohort study of individuals with CAP to examine attributable healthcare costs up to 1 year post-index date, using health administrative data held at ICES (formerly known as the Institute of Clinical Evaluative Sciences). ICES is an independent, non-profit research institute whose legal status under Ontario’s health information privacy law allows it to collect and analyze health care and demographic data, without consent, for health system evaluation and improvement. It houses a repository of individually-linked health service records for residents eligible for publicly funded healthcare in Ontario, Canada (this excludes temporary visa holders, immigrants/former residents in the 3 month wait period for the Ontario Health Insurance Plan (OHIP), and undocumented/non-status residents)Citation15. These datasets are linked using unique encoded identifiers and analyzed at ICES. Our study received ethics approval from the institutional review boards at Sunnybrook Health Sciences Centre and the University of Toronto.
Cohort
We identified exposed subjects (subjects with incident episodes of CAP from 1 January 2012 through 31 December 2014) and followed them up to 1 year after the onset of the incident episode in our primary analysis. Exposure was determined using physician billing claims recorded in the OHIP database, emergency department (ED) visit information from the National Ambulatory Care Reporting System (NACRS), and hospitalization information from the Canadian Institute for Health Information’s Discharge Abstract Database (CIHI-DAD)Citation15. In the absence of validated algorithms to identify subjects with incident episodes of CAP, we included subjects with at least one healthcare encounter attributed to pneumonia using the International Statistical Classification of Diseases and Related Health Problems, 10th Revision, Canada (ICD-10CA) codes J12–J18 for ED visits and hospitalizations, or International Statistical Classification of Diseases and Related Health Problems, 8th Revision (ICD-8) code 486 for OHIP physician services. For the ICD-8 code 486, Canadian validation studies of outpatient pneumonia have reported a sensitivity of 38–60%, specificity of 100%, and positive predictive value of 90–91%Citation16,Citation17. For subjects with multiple episodes in the recruitment period, only one randomly selected episode was considered in our analysis. Hospitalizations were included if pneumonia was coded as the most responsible diagnosis, and excluded if pneumonia was identified as a post-admission diagnosis or if the subject had been hospitalized for any reason in the preceding 14 days in order to reduce the likelihood of including hospital-acquired pneumonia. Episode length was defined as the time from first to last CAP claim (ICD-10CA J12-J18, ICD-8 486). We defined CAP claims greater than 30 days apart as a new episode. Hence the index date for a new episode was the first CAP claim after a minimum 30-day period from the last claim. Episodes were classified as “inpatient” if they included at least one pneumonia hospitalization, with all others being classified as “outpatient”.
Due to the significant differences in comorbidities and pre-index date healthcare costs, we created four separate matched cohorts, applying patient care setting of the episode (inpatient vs. outpatient) and age group (0–17, 18+) as the stratifying variables. Setting of care was identified as an important variable on which to stratify given the large discrepancy in costs between the two types of episodes, as well as the fact that it acts as a proxy for the severity of each episode. We further stratified on age given the differing relationship of increasing age with healthcare costs in each age group. Namely, as children age, the average costs tend to be lower, while greater age is associated with increased costs of care once adults reach advanced ages.
The pool of unexposed subjects was defined as Ontario residents without a CAP claim over the course of the recruitment period. Index dates within the recruitment period were randomly assigned to the pool of unexposed subjects, after which baseline covariates were collected from linked databases.
We matched each exposed subject to one unexposed subject using a combination of hard and propensity score matching on a limited number of baseline covariatesCitation18. We matched exposed subjects 1:1 to unexposed subjects using nearest neighbor matching without replacement within a specified caliper distance. The propensity score was estimated via a logistic regression model that used exposure status as the outcome variable (exposed vs. unexposed). In order to match exposed subjects to unexposed subjects with comparable baseline healthcare resource utilization, we specified a number of influential baseline covariates that were likely to have a direct impact on future healthcare costs. After testing for the balance of the pre-specified baseline covariates, we selected a model with the following dependent variables: age, sex, rural residence, income quintile, comorbidities, and healthcare costs prior to the index date (see the Supplementary Appendix 1 for additional details). Comorbidities were encoded using the Johns Hopkins ACG System (Version 10.0) Aggregated Diagnosis Groups (ADGs) which measures an individual’s health resource utilization by assigning their ICD codes into diagnosis groupsCitation19. To summarize these groups, we also employed resource utilization bands (RUB), which summarize the ADGs into ordinal groups based on their predicted resource utilization. The bands range from 0 (non-user) to 6 (very high resource user) based on their recorded ADGs prior to the index dateCitation19. Finally, healthcare costs prior to index date accounted for short-term (30 days prior to the index date) and long-term (1 year prior to index date) healthcare costs.
Subjects were hard matched 1:1 on sex and age (± 1 year), with subsequent nearest neighbor matching of the propensity score within calipers equal to 0.2 of the standard deviation of the logit of the propensity scoreCitation20. The balance of the measured baseline covariates was assessed using standardized differences, with values less than 0.1 indicating negligible differences between the baseline characteristics of the matched subjects.
Analysis
Healthcare costs were calculated from the perspective of the Ontario Ministry of Health, including all publicly-funded healthcare services: (1) inpatient hospitalizations, (2) same-day surgery procedures, (3) emergency department visits, (4) outpatient medications (for those aged ≥ 65 years or on social assistance), (5) physician services, (6) non-physician services (e.g. physiotherapy), (7) outpatient laboratory tests, (8) rehabilitation services, (9) complex continuing care admissions, (10) homecare services, (11) long-term care admissions, (12) dialysis clinic visits, (13) cancer clinic visits, and (14) assistive devices. These costs were tabulated using person-level costing methods established by ICES – details regarding the components and calculations health administrative databases are provided in the costing guidelines by Wodchis et al.Citation21. We estimated healthcare costs attributable to CAP by calculating the mean difference between the matched exposed and unexposed subjects. To determine 95% confidence intervals (95%CI) we used non-parametric bootstrapping methods. We calculated attributable costs for each CAP episode, as well as 30 days, 6 months, and 1 year after the subject’s index date. Follow-up was equivalent between both exposed and unexposed subjects from their respective index dates. As a sensitivity analysis, we also examined the attributable cost burden over an expanded follow-up time of 2 and 3 years after the index date. The proportion of episode costs represented by different services was examined for both inpatient and outpatient episodes (e.g. physician visits, emergency department visits, hospitalizations, prescription drugs). All costs were evaluated in 2021 Canadian dollars. Finally, population data for the years 2012–2014 from Statistics Canada were used to convert episode counts to annual incidence ratesCitation22.
Sensitivity analyses
To date, there has been no consistent validated case definition to identify episodes of CAP from health administrative datasets. A number of different case definitions have been employed in previous studies and, to address this potential variability, we conducted analyses to assess the impact of alternative criteria.
For inpatient episodes, we included two alternative definitions to identify exposed subjects (Supplementary Appendix 2). The first alternative definition (“sensitive definition”) expanded the inpatient CAP episodes to include hospitalizations where pneumonia was coded as either the most responsible diagnosis or a pre-admission comorbidity. This provided the most sensitive definition, as it included the broadest range of CAP hospitalizations. The second alternative definition (“tailored definition”) adopted a narrower approach and included all hospitalizations where pneumonia was either (1) the most responsible diagnosis or (2) was a secondary diagnosis with a most responsible diagnosis of related complications including sepsis, meningitis, respiratory failure, acute respiratory distress syndrome (ARDS), empyema, or chronic obstructive pulmonary disease (COPD) exacerbation/infection. In all definitions, we excluded subjects for whom pneumonia was classified as a post-admission comorbidity to limit the inclusion of hospital-acquired pneumonia. In these alternative definitions, we also expanded the considered ED visits to include COPD with lower respiratory tract infections or exacerbations as long as there was a concomitant pneumonia code.
For outpatient episodes, we conducted a sensitivity analysis where we excluded all outpatient CAP episodes that had any hospitalization costs in the 30 days after index date (“restricted definition”). This was done to remove episodes where a non-CAP hospitalization (hospitalizations without any pneumonia codes) was included in the costing periods after index date (e.g. congestive heart failure), thereby substantially increasing the overall estimated costs attributable to CAP.
Results
Study cohort
We identified 692,090 subjects with at least one episode of CAP between 1 January 2012 and 31 December 2014. The mean age of the subjects was 46.5 years, 51.8% were female, and 16.1% were identified as high resource users of the healthcare system at baseline (highest resource utilization band).
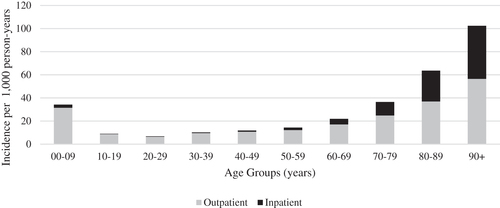
The total number of episodes over this time period was 847,328; an average of 1.22 episodes per exposed subject. This consisted of 784,950 outpatient episodes and 62,378 inpatient episodes. The number of total episodes per subject varied from 1 to 20, although this distribution was heavily right-skewed with most subjects experiencing a single episode (83%). This distribution differed by age, with adults 65 years and older being more likely to experience more than one episode (23.6%) over the recruitment period than the younger age groups (13.5%). The overall annual incidence of CAP for the cohort was 21.0 episodes per 1,000 person-years, although there was substantial variation between age groups. Adults aged 65 years and older had the highest annual incidence rate of 50.1 episodes per 1,000 person-years, while adults aged 18–64 years and pediatric subjects (aged 0–17 years) had incidence rates of 12.9 and 24.7 episodes per 1,000 person-years, respectively (). The average length of episodes was 5.0 days, which differed significantly between inpatient (14.9 days) and outpatient (4.2 days) episodes.
Figure 1. Incidence of outpatient and inpatient episodes of care for community-acquired pneumonia by age group over the recruitment period of 2012–2014.
Most episodes of CAP were treated exclusively in the outpatient setting (92.6%), with 75% of these episodes consisting of a single day of patient care. Of the outpatient episodes, 33% involved treatment in the emergency department. There was a notable difference between age groups in the proportion of episodes involving a hospitalization. Specifically, among adults aged 65 years and older, inpatient episodes represented 12.3% of the total, compared to 4.6% among those younger than 65 years. The mean length of stay for CAP hospitalizations was 8.2 days, with 10% of subjects requiring intensive care.
Matching results
Across the four matched cohorts, we successfully matched 96.6% to 99.7% of exposed subjects to unexposed subjects from the general Ontario population ( and ), with all standardized differences being less than 0.1 (see Supplementary Appendix 3 for full details). The lowest successful matching rate was for adult outpatient episodes (96.6%), with the matching rate of the remaining groups all exceeding 99%. In general, the unmatched subjects had higher pre-index healthcare costs and more comorbidities. A comparison of the matched and unmatched exposed subjects for each cohort is presented in Supplementary Appendix 4.
Table 1. Demographics of exposed subjects with outpatient episodes of care and unexposed subjects before and after matching.
Table 2. Demographics of exposed subjects with inpatient episodes of care and unexposed subjects before and after matching.
Outcomes
CAP episodes were associated with increased healthcare utilization and higher healthcare costs. The mean attributable costs were $1,595 (95% CI: $1,572–$1,616) per outpatient CAP episode and $12,576 (95% CI: $12.392–$12,761) per inpatient CAP episode. The largest proportion of the attributable costs were accrued in the first 10 days of each episode (Supplementary Appendix 5). When these episode costs were applied to the average annual incidence of outpatient and inpatient episodes over the 3 year recruitment period, it represented a cumulative annual cost of $261 million for inpatient episodes and $417 million for outpatient episodes.
There was a substantial difference in costs between age groups for both CAP outpatient and inpatient episodes ( and ). While the mean attributable cost of outpatient episodes increased with age, the attributable cost of inpatient episodes was highest among adults aged 18–64, and lowest among pediatric subjects. Subjects aged 18–64 years had lower rates of early mortality (within 30 days) after inpatient episodes compared to adults 65 years and older (4.8% vs 15.1%) and a shorter mean length of stay (7.0 days vs. 9.6 days). Inpatient episodes where subjects were admitted to an intensive care unit had higher costs than those who were not ($33,772 vs. $10,230), due to higher resource use and longer overall hospital length of stay (15.3 days vs. 7.4 days). Relative to subjects living outside rural areas, subjects who lived in rural areas had lower attributable costs for both inpatient ($10,792 vs. $12,884) and outpatient episodes ($1,438 vs. $1,617). Among outpatient episodes, single-day episodes were associated with significantly lower attributable costs relative to multi-day episodes ($322 vs. $5,770).
Table 3. Mean attributable healthcare costs with 95% confidence intervals (CI) for outpatient community-acquired pneumonia episodes by age group.
Table 4. Mean attributable healthcare costs with 95% confidence intervals (CI) for inpatient community-acquired pneumonia episodes by age group.
In terms of costs beyond the initial episode, exposed subjects with outpatient CAP episodes had mean attributable cumulative 30-day, 6-month, and 1-year costs of $2,346 (95% CI: $2,325–$2,367), $3,971 (95% CI: $3,918–$4,023), and $4,749 (95% CI: $4,672–$4,823), respectively. Subjects with inpatient CAP episodes had mean attributable 30-day, 180-day, and 1-year costs of $11,514 (95% CI: $11,403–$11,624), $17,643 (95% CI: $17,333–$17,934), and $20,766 (95% CI: $20,282–$21,210), respectively.
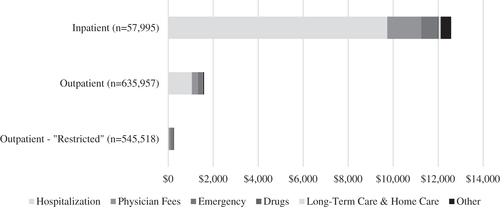
The largest cost components among subjects with inpatient CAP episodes were hospitalization costs (77%), physician service fees (12%), and emergency department services (6%), accounting for 95% of attributable costs (). In contrast, attributable costs for subjects with outpatient services were more evenly distributed between non-pneumonia hospitalizations (66%), physician service fees (17%), and emergency department services (11%). When subjects with hospitalization costs in the 30 days after index date were excluded, the proportion of the costs represented by emergency department services (43%) and physician service fees (41%) increased significantly.
Figure 2. Source of attributable healthcare costs for inpatient and outpatient episodes of community-acquired pneumonia. Outpatient sensitivity analysis (“Restricted definition”) has excluded any episodes with any hospitalization costs in the first 30 days after index date.
Thirty-day all-cause mortality was significantly higher among exposed subjects than the corresponding matched unexposed subjects, although this varied substantially with setting of care and age. Among adults 65 years and older, 30-day all-cause mortality for exposed subjects (inpatient and outpatient) was 9.8%, significantly higher than for adults aged 18–64 years and pediatric subjects (1.0% and 0.03%, respectively). Inpatient mortality rates were significantly higher across all age groups relative to outpatient mortality rates (10.3% vs 3.8%). Exposed subjects with inpatient CAP episodes who died in the first 30 days post-index date demonstrated lower attributable healthcare costs per episode relative to exposed subjects who survived 30 days ($12,513 vs. $13,121) due to shorter episode lengths (9.4 days vs. 15.3 days). Notably, the absolute value of the pre-CAP baseline healthcare costs of the subjects who died within the first 30 days were much higher relative to those who survived ($5,508 vs. $2,602 in the 30 days prior to index date), as well as representing a significantly older population (81.2 years vs. 59.3 years).
Among the different types of ICD-10CA CAP codes in administrative data, “Unspecified Pneumonia” (J18.9) accounted for 78% of included inpatient CAP episodes in our primary analysis (most responsible diagnosis). When the attributable costs for episodes with unspecified CAP were compared to those with an agent specified code in the administrative data (e.g. J13 – Pneumonia due to Streptococcus pneumoniae), we found that episodes identified using code J18.9 were associated with significantly lower attributable costs relative to those with a specified etiologic agent ($11,902 vs. $15,028). Similarly, hospitalizations for unspecified CAP were found to have significantly shorter lengths of stay, likely contributing to the lower attributable costs. Furthermore, hospitalizations with a secondary ICD-10CA code for complications of CAP (sepsis, meningitis, empyema, respiratory failure, shock) were found to be associated with significantly higher attributable episode costs ($40,194 vs. $10,809), representing 6% of inpatient episodes in the primary analysis.
Sensitivity analyses
When examining the attributable costs for extended follow-up times, it was found that subjects with CAP episodes continued to accrue excess costs up to 3 years after their index date, relative to their matched pairs. Specifically, in the 2 and 3 years after the index date of the inpatient CAP episode, cumulative attributable healthcare costs were found to be $23,986 (95% CI: $23,195–$24,733) and $25,705 (95% CI: $24,648–$26,703), respectively, while for outpatient episodes, the attributable costs were found to be $5,632 (95% CI: $5,510–$5,752) and $6,174 (95% CI: $6,018–$6,3493) over the same period.
With regards to the impact of the alternative episode algorithms, it was found that the inpatient alternatives resulted in a higher number of included inpatient CAP episodes and a lower number of outpatient CAP episodes over the recruitment period. In addition, these analyses generated higher attributable cost estimates for inpatient CAP episodes (see Supplementary Appendix 6 for full results). Nevertheless, these algorithms generated similar results in terms of the trends observed in attributable healthcare costs across age groups.
In terms of the outpatient sensitivity analysis, it was found that excluding subjects with any hospitalization costs in the first 30 days resulted in significantly lower attributable costs. As shown in , this decrease was primarily the result of eliminating non-pneumonia hospitalization costs included in the episodes. This resulted in the exclusion of approximately 14% of the original outpatient episodes (see Supplementary Appendix 6 for full results).
Discussion
Our analysis provides a population-based assessment of the epidemiology and healthcare costs associated with CAP in the Canadian setting. By taking advantage of local comprehensive health administrative databases, we were able to quantify the individual level costs and healthcare utilization for subjects with CAP from a number of important and policy-relevant subgroups. Our results provide insight into the substantial burden CAP imposes on the healthcare system due to its high incidence and severe health consequences.
Exposed subjects were found to have substantially higher healthcare costs than comparable unexposed subjects for up to 1 year post-index date. In our sensitivity analyses, these increased costs were present up to 3 years after the original index date. However, because exposed subjects had fewer survivors at these time points, time may have introduced unobserved differences between exposed and unexposed subjects. Nevertheless, the higher costs accrued after the defined episode of CAP may indicate the presence of long-term sequelae or an overall deterioration of health (especially in older adults), potentially leading to increased healthcare utilization such as a transition to long-term care after hospitalization. This is supported by evidence from a number of other studies that suggest inpatient episodes of pneumonia are associated with decreased long-term survival and increased healthcare costsCitation4,Citation13,Citation14,Citation23–29. Similar to other recent North American studies of CAP, the short- and long-term mortality rates observed in our study were increased in exposed subjects relative to matched unexposed subjectsCitation28–30. Regarding the long-term economic impact of CAP on exposed subjects, two recent studies from the United States examining insurance claims databases have demonstrated similar long-term increases in healthcare costs after episodes of CAP, consistent with our findings in Ontario, CanadaCitation13,Citation14. These studies used similar definitions and exclusions as our analysis, with one of the studies also using a retrospective matched cohort strategy. These excess costs were shown to persist for up to 2 years in one study (which examined inpatient and outpatient CAP episodes as a single group), while the other study (which only considered inpatient CAP episodes) demonstrated substantial attributable costs persisting up to 3 years. This consistency across jurisdictions lends further support to the potential for long-term differences in post-CAP morbidity requiring healthcare utilization.
Our CAP incidence estimates were generally similar to those found by other recent Canadian studies examining the incidence of CAP in the inpatient settingCitation1,Citation6,Citation31. However, our estimated CAP incidence was notably higher than those reported in recent studies from the United States using similar methodologies with administrative databases such as Medicare and the Optum Research DatabaseCitation5,Citation28,Citation32. The reason for these discrepancies is unclear; however, it may reflect differences in treatment-seeking behavior and healthcare access, infection rates, or coding practices, particularly since most US healthcare databases use ICD-9 coding as opposed to the ICD-10CA coding system used in Canada. The estimates of incidence also varied between the episode algorithm used in the primary analysis and the two alternative algorithms included in the sensitivity analysis. In particular, there was a larger number of inpatient CAP episodes identified in the sensitivity analyses, with a concomitant increase in the estimated attributable healthcare costs for these episodes. This higher incidence was the product of expanding the inclusion criteria for CAP inpatient episodes, while the higher costs were the result of including patients with more severe illness. This is due to the nature of the coding system used in health administrative databases; for example, patients who present with CAP that worsens in hospital to become sepsis upon admission will most likely have sepsis listed as their most responsible diagnosis. This type of CAP episode was excluded from the primary analysis; however, it is likely to have been more severe than hospitalizations where CAP is listed as the most responsible diagnosis, thereby leading to higher attributable costs. This aligns with our finding that inpatient episodes using a broader, more sensitive definition, where CAP is listed as a primary or pre-admission diagnosis overall, had higher levels of attributable healthcare costs per subject (Supplementary Appendix 6). A similar rationale underlies the observed differences in costs between hospitalizations with “Unspecified Pneumonia” (J18.9) as the most responsible diagnosis and those with a pathogen specified code (e.g. J13 – Pneumonia due to Streptococcus pneumoniae). This is likely a product of the fact that patients with uncomplicated CAP often don’t have cultures drawn to identify an etiologic agent in accordance with recent guideline recommendations, or are discharged prior to the culture results becoming availableCitation33. In contrast, those with more severe presentations or risks for atypical infections will generally require cultures to guide appropriate medical management, and as a result will have higher associated healthcare costs.
To the best of our knowledge, our analysis is the first population-based study to estimate the incidence of outpatient CAP across all age groups and its associated costs in Canada using health administrative data. Despite the fact that the attributable costs per outpatient episode are an order of magnitude less compared to inpatient episodes, the high incidence of these episodes contributes to a substantial cumulative burden. In fact, in our primary analysis, the average cumulative healthcare costs per year associated with outpatient episodes was 60% higher than the cumulative costs of the inpatient episodes. Notably, it was found that a proportion of the outpatient episodes (14%) had non-pneumonia hospitalization costs included in the episode period, which had a substantial impact on estimated overall costs. When these episodes were removed, the attributable healthcare costs associated with outpatient episodes decreased substantially. These extra costs may be the result of misclassification in coding, incidental intermittent illnesses, or a subsequent health event triggered by the infection (e.g. heart failure exacerbation). These complications are most relevant among the older age group of exposed subjects (65+ years) given their higher levels of comorbidities and overall frailty. This was supported by the fact that this age group demonstrated the highest outpatient episode costs in the primary analysis which included these non-pneumonia hospitalization costs, as well as the fact that this cohort had the highest baseline healthcare costs leading up to the episodes. Although there is undoubtedly a risk of misclassification with health administrative data, particularly with outpatient care where empiric treatment is more common, these findings highlight the substantial cumulative healthcare burden of outpatient CAP episodes.
Relative to previous evaluations of the healthcare costs attributable to inpatient episodes of CAP in Canada, our estimates were significantly higher, even in the short-termCitation9–12. The reason for this is likely two-fold. First, most previous analyses have exclusively considered hospitalization costs, thereby excluding pre- and post-admission care. In the majority of cases, the care associated with an episode of CAP is not limited to the time spent in hospital but can include pre-admission clinic and ED visits, as well as follow-up care after discharge. Second, our analysis took an incidence-based approach to assess longitudinal episodes of care. A benefit of this design is the accurate estimation of the burden imposed by an episode of CAP, which may not be limited to a single hospitalization. When relevant changes in care such as hospital transfers and readmissions are not considered, the number of hospitalizations attributed to CAP is likely to represent an over-estimate of the number of CAP episodes and, as a consequence, the costs per episode can represent an under-estimate. By highlighting the substantial economic burden of CAP, our study can serve to inform health policy decisions concerning interventions targeting CAP and priority setting for future investments. This may include resource allocation for vaccination programs, diagnostic testing, or educational public health initiatives. Although differences in the structure of healthcare funding exist between provinces, they remain sufficiently similar to allow the costing estimates from this study to be generalizable across the country, as well as to jurisdictions with similar healthcare systems and population health profiles.
In terms of limitations, as previously mentioned, our study relies on health administrative data, which provide limited clinical detail as they are primarily intended for billing purposes. Furthermore, previous studies have indicated that many health conditions are not optimally coded in these databases, leading to misclassification bias. Infectious diseases are especially prone to coding errors due to the non-specific presentation of many conditions. This may have led to under- or over-reporting CAP incidence depending on the directionality of these biases. In particular, outpatient cases involving a single visit to a health practitioner may be particularly susceptible to this type of error, as clinicians may use the ICD code for CAP (486) to encompass a broad range of illnesses. Given the high rate of these single visit episodes in our analysis (75% of outpatient episodes), the potential negative downstream effects of misclassification or misdiagnosis can extend beyond the economic impact, particularly in settings where empiric treatment with antibiotics is initiated given ongoing concerns about bacterial resistance. Nevertheless, Canadian validation studies of this code have indicated that the positive predictive value of this code was 90–91% for both adult and pediatric populationsCitation16,Citation17. However, the sensitivity was suboptimal in both cases (38% and 60%), so there is a possibility that we have underestimated outpatient incidence. An additional limitation to our study was the variables that we could employ in our propensity-score model for the purposes of matching exposed subjects to those who are unexposed. Our model used previous healthcare utilization as proxy for health status factors not fully accounted for by our comorbidity variables and other factors that could influence resource utilization, such as treatment-seeking behavior. However, many lifestyle factors, such as smoking and alcohol intake, can affect the severity of episodes, which we were unable to account for due to the limitations of our data. While the comorbidity measures used may capture some of this indirectly, unobserved characteristics such as smoking could be more common in our exposed subjects relative to our unexposed subjects. This could lead to an independent increase in resource utilization and therefore an overestimate of the effect of CAP on healthcare costs. Finally, we were unable to match all of the exposed subjects across the four groups. Unmatched exposed subjects tended to have unusually high pre-index and post-index resource utilization and healthcare costs. This suggests that our analysis may slightly underestimate the costs attributable to CAP, since these subjects were excluded from the overall estimates.
Our study’s primary strengths were the population-based sample, which enhanced the generalizability of our results, and the use of individually linked datasets. This allowed us to develop a comprehensive strategy to identify exposed subjects and incorporate a broad range of publicly funded healthcare services in our cost analysis. The matched cohort design of the study allowed us to account for patient baseline healthcare costs to reduce confounding. In particular, the use of pre-index date healthcare costs as a matching variable facilitated more comparable matched pairs in terms of baseline healthcare utilization and costs. Importantly, the healthcare costs considered in our analysis included nearly all publicly-funded healthcare services in Ontario, allowing us to develop a more complete understanding of the economic burden imposed by CAP relative to previous analyses which have generally limited their estimates to hospitalization costs.
Conclusion
Our study demonstrates that CAP is associated with substantial short- and long-term healthcare costs. This is the first study to assess the population-based attributable healthcare costs of CAP in Ontario in both the inpatient and outpatient setting, providing important evidence for strategic healthcare planning and to inform economic evaluations of CAP interventions. The findings provide evidence that points toward a potential long-term impact of CAP beyond the acute phase of illness, although the precise cause of this increased healthcare utilization remains a topic for future investigation.
Transparency
Declaration of funding
This study was supported by ICES, which is funded by an annual grant from the Ontario Ministry of Health (MOH) and the Ministry of Long-Term Care (MLTC).
Parts of this material are based on data and/or information compiled and provided by the Canadian Institute for Health Information (CIHI). However, the analyses, conclusions, opinions and statements expressed in the material are those of the author(s), and not necessarily those of CIHI. This study also received funding from a Canada Research Chair in Economics of Infectious Diseases held by Beate Sander (CRC-950-232429). The publication of study results was not contingent on the sponsor’s approval or censorship of the manuscript. The analyses, conclusions, opinions, and statements expressed herein are solely those of the authors and do not reflect those of the funding or data sources; no endorsement is intended or should be inferred.
Declaration of financial/other relationships
The authors report there are no competing interests to declare.
Author contributions
All authors were involved in the conceptualization and design of the current study. Data acquisition and analyses were undertaken by RO and HL at ICES. RO, JK, AM, TT and BS were responsible for interpretation of the results. RO drafted with manuscript with critical revisions from HL, JK, AM, TT and BS. All authors approved the final version of the manuscript.
Reviewer statement
Peer reviewers on this manuscript have no relevant financial or other relationships to disclose.
Supplemental Material
Download MS Word (134.7 KB)Acknowledgements
No assistance in the preparation of this article is to be declared.
References
- McNeil SA, Qizilbash N, Ye J, et al. A retrospective study of the clinical burden of hospitalized all-cause and pneumococcal pneumonia in Canada. Can Respir J. 2016;2016:3605834.
- Weycker D, Farkouh RA, Strutton DR, et al. Rates and costs of invasive pneumococcal disease and pneumonia in persons with underlying medical conditions. BMC Health Serv Res. 2016;16(1):182.
- Chalmers J, Akram A, Hill A. Increasing outpatient treatment of mild community-acquired pneumonia: systematic review and meta-analysis. Eur Respir J. 2011;37(4):858–864.
- Eurich DT, Marrie TJ, Minhas-Sandhu JK, et al. Ten-year mortality after community-acquired pneumonia: a prospective cohort. Am J Respir Crit Care Med. 2015;192(5):597–604.
- Sato R, Rey GG, Nelson S, et al. Community-acquired pneumonia episode costs by age and risk in commercially insured US adults aged ≥50 years. Appl Health Econ Health Policy. 2013;11(3):251–258.
- National Institute on Ageing. As one of Canada’s Top Killers, Why Isn’t Pneumonia taken more seriously? Toronto, ON: National Institute on Ageing; 2019.
- Canada S. Table 13-10-0394-01 leading causes of death, total population, by age group. Ottawa: Statistics Canada; 2017.
- Kwong JC, Ratnasingham S, Campitelli MA, et al. The impact of infection on population health: results of the Ontario burden of infectious diseases study. PLoS One. 2012;7(9):e44103.
- Dobrescu A. The economic burden of pneumonia in Canada: a Status Quo Forecast. Ottawa: The Conference Board of Canada; 2017.
- Lebel MH, Kellner JD, Ford-Jones EL, et al. A pharmacoeconomic evaluation of 7-valent pneumococcal conjugate vaccine in Canada. Clin Infect Dis. 2003;36(3):259–268.
- Petit G, De Wals P, Law B, et al. Epidemiological and economic burden of pneumococcal disease in Canadian children. Can J Infect Dis Med Microbiol. 2003;14(4):215–220.
- Carriere KC, Jin Y, Marrie TJ, et al. Outcomes and costs among seniors requiring hospitalization for community‐acquired pneumonia in Alberta. J Am Geriatr Soc. 2004;52(1):31–38.
- Weycker D, Moynahan A, Silvia A, et al. Attributable cost of adult hospitalized pneumonia beyond the acute phase. PharmacoEconomics-Open. 2020;2020:1–10.
- Wasser T, Yu J, Singer J. Long-term cost consequences of community-acquired pneumonia in adults. Am J Pharm Benefits. 2013;5(3):e66–e72.
- Institute for Clinical Evaluative Sciences. ICES Data Dictionary 2020; [cited 2020 Nov 20]. Available from: https://datadictionary.ices/.
- Cadieux G, Tamblyn R. Accuracy of physician billing claims for identifying acute respiratory infections in primary care. Health Serv Res. 2008;43(6):2223–2238.
- Hwee J, Sung L, Kwong JC, et al. Use of physician billing claims to identify infections in children. PLoS One. 2018;13(11):e0207468.
- Harris H, Horst SJ. A brief guide to decisions at each step of the propensity score matching process. Pract Assess Res Eval. 2016;21(1):4.
- Health JHBSoP. The Johns Hopkins ACG System Technical Reference Guide, Version 9.0. Baltimore, MD: The John Hopkins University; 2009.
- Austin PC. Optimal caliper widths for propensity‐score matching when estimating differences in means and differences in proportions in observational studies. Pharm Stat. 2011;10(2):150–161.
- Wodchis WP, Bushmeneva K, Nikitovic M, et al. Guidelines on person-level costing using administrative databases in Ontario. Working Paper Series. Toronto: Health System Performance Research Network; 2013.
- Table 051-0001 – Estimates of population, by age group and sex for July 1, Canada, provinces and territories, annual (persons unless otherwise noted) [Internet]. Available from: https://www150.statcan.gc.ca/t1/tbl1/en/tv.action?pid=1710000501.
- Bordon J, Wiemken T, Peyrani P, et al. Decrease in long-term survival for hospitalized patients with community-acquired pneumonia. Chest. 2010;138(2):279–283.
- Kaplan V, Clermont G, Griffin MF, et al. Pneumonia: still the old man’s friend? Archives of Internal Med. 2003;163(3):317–323.
- Sandvall B, Rueda AM, Musher DM. Long-term survival following pneumococcal pneumonia. Clin Infect Dis. 2013;56(8):1145–1146.
- Bruns AH, Oosterheert JJ, Cucciolillo MC, et al. Cause‐specific long‐term mortality rates in patients recovered from community‐acquired pneumonia as compared with the general Dutch population. Clin Microbiol Infect. 2011;17(5):763–768.
- Viasus D, Cillóniz C, Cardozo CG, et al. Early, short and long-term mortality in community-acquired pneumonia. Ann Res Hospitals. 2018;2(5):2.
- Ramirez JA, Wiemken TL, Peyrani P, et al. Adults hospitalized with pneumonia in the United States: incidence, epidemiology, and mortality. Clin Infect Dis. 2017;65(11):1806–1812.
- Johnstone J, Eurich DT, Majumdar SR, et al. Long-term morbidity and mortality after hospitalization with community-acquired pneumonia: a population-based cohort study. Medicine. 2008;87(6):329–334.
- File TM, Jr, Marrie TJ. Burden of community-acquired pneumonia in North American adults. Postgrad Med. 2010;122(2):130–141.
- Luca DL, Kwong JC, Chu A, et al. Impact of pneumococcal vaccination on pneumonia hospitalizations and related costs in Ontario: a population-based ecological study. Clin Infect Dis. 2018;66(4):541–547.
- Griffin MR, Zhu Y, Moore MR, et al. US hospitalizations for pneumonia after a decade of pneumococcal vaccination. N Engl J Med. 2013;369(2):155–163.
- Metlay JP, Waterer GW, Long AC, et al. Diagnosis and treatment of adults with community-acquired pneumonia: an official clinical practice guideline of the American thoracic society and infectious diseases society of America. Am J Respir Crit Care Med. 2019;200(7):e45–e67.