
Abstract
Aims
This retrospective, observational cohort study aimed to determine the burden of comorbidities, hospitalization, and healthcare costs among patients with non-alcoholic steatohepatitis (NASH) in the United States stratified by fibrosis-4 (FIB-4) or body mass index (BMI).
Methods
Adults with NASH were identified in the Veradigm Health Insights Electronic Health Record Database and linked Komodo claims data. The index date was the earliest coded NASH diagnosis between 1 January 2016 and 31 December 2020 with valid FIB-4 and ≥6 months of database activity and continuous enrollment pre- and post-index. We excluded patients with viral hepatitis, alcohol-use disorder, or alcoholic liver disease. Patients were stratified by FIB-4: FIB-4 ≤ 0.95, 0.95 < FIB-4 ≤ 2.67, 2.67 < FIB-4 ≤ 4.12, FIB-4 > 4.12) or BMI (BMI <25, 25 ≤ BMI ≤30, BMI > 30). Multivariate analysis was used to assess the relationship of FIB-4 with costs and hospitalizations.
Results
Among 6,743 qualifying patients, index FIB-4 was ≤0.95 for 2,345 patents, 0.95–2.67 for 3,289 patients, 2.67–4.12 for 571 patients, and >4.12 for 538 patients (mean age 55.8 years; 62.9% female). Mean age, comorbidity burden, cardiovascular disease risk, and healthcare utilization increased with increasing FIB-4. Mean ± SD annual costs increased from $16,744±$53,810 to $34,667±$67,691 between the lowest and highest FIB-4 cohorts and were higher among patients with BMI <25 ($24,568±$81,250) than BMI >30 ($21,542±$61,490). A one-unit increase in FIB-4 at index was associated with a 3.4% (95%CI: 1.7%–5.2%) increase in mean total annual cost and an 11.6% (95%CI: 8.0%–15.3%) increased likelihood of hospitalization.
Conclusions
A higher FIB-4 was associated with increased healthcare costs and risk of hospitalization in adults with NASH; however, even patients with FIB-4 ≤ 0.95 presented a significant burden.
Introduction
With a prevalence of 24%–38%Citation1,Citation2, non-alcoholic fatty liver disease (NAFLD) is the leading cause of chronic liver disease and the second leading cause of liver transplantation in the United States (US)Citation3. Roughly 20% of patients with NAFLD develop non-alcoholic steatohepatitis (NASH)Citation4, a condition defined by progressive fibrosis of the liver and associated with cirrhosis, liver failure, and hepatocellular carcinomaCitation5. The prevalence of NAFLD and NASH are significantly higher in patients with other components of metabolic syndrome, such as type 2 diabetes, obesity, dyslipidemia, hypertriglyceridemia, and hypertensionCitation2.
Driven by these costly complicationsCitation6–10, the estimated lifetime direct medical costs of US patients with NASH exceed $223 billionCitation11. Concerningly, the prevalence and associated burden of NASH is predicted to increase in the coming decades, given its close association with the overlapping epidemics of type 2 diabetes and obesityCitation4. Data are limited, however, regarding the economic burden of disease at earlier fibrosis stages (e.g. intermediate fibrosis, approximately F2). Notably, existing real-world NASH US cost studies use data that are ≥5 years old and focus on patients with severe complications suggesting advanced fibrosis (F3/F4) due to the absence of confirmatory labs or a NASH-specific code prior to 1 October 2015Citation8–10. Additional gaps in knowledge include whether fibrosis stage correlates with cardiovascular risk or body mass index (BMI) correlates with costs among patients with NASH.
The challenge of identifying early-stage patients with NASH is the key factor limiting population-based analysis of the burden of disease. First, fibrosis stage, as measured by liver biopsy, is strongly predictive of liver-related morbidity and mortality among patients with NAFLDCitation12. Liver biopsy, however, is invasive, costly, and often reserved for highly selected patients, and the results are not captured in structured fields of the electronic health record (EHR)Citation13. Although prior analysis has shown that ICD-10 diagnosis codes for NAFLD/NASH have a high positive predictive value for identifying patientsCitation14, they are insensitive in classifying the disease severity of NASHCitation15. However, there is great promise in using clinical scoring systems, such as the Fibrosis-4 (FIB-4) score, which can be calculated from routinely captured EHR data to augment the performance of diagnostic codes. Several studies have assessed the validity of using the FIB-4 score compared to liver biopsy as an approach for determining fibrosis stage and application in clinical practiceCitation16–18. Based on current evidence, the FIB-4 score is now recommended for excluding advanced fibrosis in the American Association for the Study of Liver Diseases practice guidanceCitation13.
Herein, we aimed to determine the burden of comorbidities, hospitalization, and healthcare costs among patients with NASH across the spectrum of disease using data from a commercial claims database. We aimed to highlight the incremental burden of early-stage fibrosis by applying refined FIB-4 cutoffs to isolate patients with intermediate FIB-4 in a population outside the referral setting from which the standard cutoffs were derived. We also examined the correlation of BMI with healthcare costs among patients with NASH. With our multivariable analysis, we aimed to reduce the level of uncertainty associated with assigning fibrosis stage by cutoffs by treating FIB-4 as a continuous variable.
Methods
Data sources
We conducted a retrospective, observational cohort study using the Veradigm Health Insights Ambulatory EHR Database linked with insurance claims data from the Komodo Health Healthcare Map from 1 July 2015 to 30 June 2021. This dataset consisted of de-identified patient records sourced from ambulatory/outpatient primary care and specialty settings. The insurance claims data contained de-identified inpatient, outpatient, and pharmacy claims linked by a unique patient token number; only closed claims were used for this study which ensured a more accurate estimation of the total cost of careCitation19. The final linked dataset available to the authors involved in data processing was created as a merge of the patient-level de-identified tokens in each individual dataset and contained no protected health information. Because the linked dataset was certified as statistically de-identified under the HIPAA Privacy Rule, the use of the data did not constitute research with human subjects; and thus did not require institutional review board approval.
Code types used in this study included International Classification of Diseases, 9th Edition and 10th Edition, Clinical Modification codes, Current Procedural Terminology codes, Logical Observation Identifiers Names and Codes, Systematized Nomenclature of Medicine terms, and National Drug Codes. See Supplementary File 1 for all codes.
The study output follows standard reporting guidelines, including the REporting of studies Conducted using Observational Routinely collected health Data extension of the Strengthening the Reporting of Observational Studies in Epidemiology guidelines and the 2022 update to the Consolidated Health Economic Evaluation Reporting StandardsCitation20,Citation21.
Study cohort
Consistent with prior literature, we required that patients have ≥1 medical claim or EHR with a diagnosis code for NASH (K75.81) between 1 January 2016 and 31 December 2020Citation22–24. Each appearance of a NASH diagnosis code during this timeframe served as the index date and was evaluated for all patient selection criteria. Other inclusion criteria were ≥18 years on the index date, ≥6 months of EHR activity, and continuous enrollment in the claims database before and after the index date. Patients were required to have valid aspartate aminotransferase (AST), alanine aminotransferase (ALT), and platelet lab results in the EHR within three months of each other and within three months of the index date. We excluded patients with any evidence of viral hepatitis, alcohol-use disorder, or alcoholic liver disease at any time in their available data.
The index date was the first date wherein all selection criteria were met. The study was not structured to identify patients at a particular point in their diagnosis or treatment journey. The baseline period was the six months preceding the index date. The follow-up period was the six months following the index date. Costs were analyzed over the one year period combining the baseline and follow-up periods. Note that by requiring patients to have three lab results in a three-month window, we may be selecting for patients with higher than average utilization of healthcare services.
Cohort stratification
For the main analysis, we used the FIB-4 score, calculated from the patient’s age at index and AST, ALT, and platelet lab results, to stratify patients into four groups. We explored several options for using different cutoffs and combinations of non-invasive tests to stratify patients by disease severity (Supplementary File 2). Initially, we explored using traditional fibrosis cutoffs of low (FIB-4 < 1.3), medium (1.3≤ FIB-4 ≤ 3.25), and high (FIB-4 > 3.25); however, recent analyses have shown that a cutoff of 1.3 does a poor job of segmenting F0–F1 patients from F2 patients, including a large study of over 2,000 biopsy-confirmed patientsCitation25–27. Ultimately, we selected cutoffs that provided more discrimination at the lower end of the fibrosis scale. Specifically, we used the following groupings: FIB-4 ≤ 0.95, 0.95 < FIB-4 ≤ 2.67, 2.67 < FIB-4 ≤ 4.12, and FIB-4 > 4.12. Sensitivity analyses are in Supplementary File 2.
We conducted a secondary analysis to understand the contribution of obesity on healthcare utilization and costs among patients with NASH. For the obesity analysis, patients with NASH were stratified into 3 groups based on BMI: BMI <25, 25≤ BMI ≤30, and BMI >30.
Study variables
Demographic characteristics, including age, sex, race, ethnicity, and geographic region of residence, were measured on the index date. Comorbidities were measured in the six-month baseline period and included those required for calculating the Charlson Comorbidity Index (CCI)Citation28, Diabetes Complications Severity Index (DCSI)Citation29, and atherosclerotic cardiovascular disease (ASCVD) risk scoreCitation30. The DCSI was only calculated for patients with a diagnosis of diabetes in the baseline period. For patients without diabetes, the DCSI was coded as 0. Additional comorbidities and lab results were captured to characterize the burden of liver-related and cardiovascular-related conditions.
All-cause healthcare resource utilization (including office visits, lab services, radiology services, and outpatient prescriptions) was recorded for the 6-month baseline and 6-month follow-up periods and combined into a single 12-month observation period. Utilization and cost outcomes were measured using medical and drug claims data. We did not proxy costs for encounters captured in the EMR data that did not have a corresponding claim. All costs are reported as per person per year and were adjusted to December 2020 US dollars using the medical care component of the Consumer Price Index.
Data analysis
All variables are reported descriptively. Continuous measures are presented as means and standard deviations while categorical measures are presented as counts and percentages. For cost variables, we also report median and interquartile range.
We used logistic regression to examine the odds of hospitalization in the 12-month observation period. We built a generalized linear model with a log link and gamma distribution to examine total healthcare costs in the 12-month observation period. FIB-4 at index as a continuous measure was the independent variable of interest in both models. Both models adjusted for age, sex, race, ethnicity, geographic region of residence, smoking status, CCI, and DCSI. Incorporation of the CCI adjusts for the variation in comorbidity burden across the cohorts; whereas, the DCSI adjusts for the burden of diabetes-specific comorbidities among the subset of patients with diabetes. Because there is some overlap in codes used to calculate these two indices, we calculated the correlation between the CCI and DCSI. As the correlation between these variables was only 0.483, which is below the threshold of 0.7 used to identify high correlations, we incorporated both into the model. Missing values were not imputed. Results of the logistic regression are reported as odds ratios (ORs) with an associated 95% confidence interval (95% CI), while the results of linear regression are reported as the exponentiation of the coefficients with 95% CI. A sensitivity analysis of the cost model was conducted using aspartate aminotransferase-to-platelet ratio index (APRI) instead of FIB-4.
A p value <.05 was set a priori as the threshold for statistical significance. All analyses were conducted using SAS V9.4.
Results
Cohort characteristics
Among the 6,743 patients with NASH who met the study criteria, 2,345 (34.8%) had an index FIB-4 ≤ 0.95, 3,289 (48.8%) had an index FIB-4 > 0.95 and ≤2.67, 571 (8.5%) had an index FIB-4 > 2.67 and ≤4.12, and 538 (8.0%) had an index FIB-4 > 4.12 (). Mean age increased from 45.9 years in the lowest FIB-4 cohort to 65.2 years in the highest FIB-4 cohort, and the percentage of female patients increased from 62.2% (FIB-4 ≤ 0.95) to 65.4% (FIB-4 > 4.12) (). Over 76% of patients in each cohort had a BMI measurement in the baseline period, and mean BMI ranged from 33.8 to 35.2. Overall, only 3.4% of patients had a liver biopsy during the short six-month baseline period used in this study.
Figure 1. Patient selection. aAny NASH diagnosis date was considered a possible index date and evaluated on all criteria. If multiple index dates met the criteria then the earliest index date meeting the criteria was used. bSeveral sensitivity analyses were conducted using different methodology for defining fibrosis severity using non-invasive tests (Supplementary File 2).
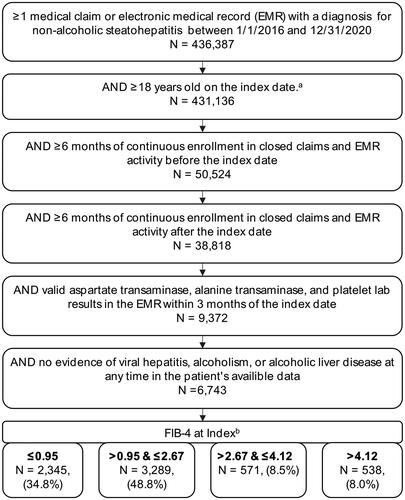
Table 1. Baseline patient characteristics.
A higher FIB-4 correlated with higher rates of comorbidities and higher risk scores (). For example, the mean ± SD CCI was 1.5 ± 1.6, 2.0 ± 2.0, 3.2 ± 2.3, and 3.8 ± 2.4 for patients with increasing index FIB-4 scores, respectively. ASCVD risk could be calculated for 33.8% of patients; the 10-year risk of ASCVD increased from 6.9% to 16.8%, 21.8%, and 27.2% as index FIB-4 increased from lowest to highest cohort.
Similarly, the rates of many liver-related and cardiovascular-related conditions increased with higher index FIB-4 (). Overall, 2.8% of patients with an index FIB-4 ≤ 0.95 had a diagnosis of cirrhosis; this increased to 10.2%, 39.8%, and 64.7% as index FIB-4 increased. Type 2 diabetes was documented in 41.7% of patients with an index FIB-4 ≤ 0.95, in 55.0% of patients with an index FIB-4 > 0.95 and ≤2.67, in 72.0% of patients with an index FIB-4 > 2.67 and ≤4.12, and in 76.4% of patients with an index FIB-4 > 4.12. Over 70% of patients in any cohort had a diagnosis of obesity or BMI >30, and >60% in any cohort had a diagnosis of hyperlipidemia. The use of cardiovascular-related medications, including antihypertensives and lipid-lowering medications, generally increased with FIB-4, whereas blood pressure and cholesterol levels were stable or decreased with FIB-4 ().
Table 2. Cardiovascular-related lab results, vital sign results, and medications during the six-month baseline period.
Unadjusted healthcare resource utilization and costs
During the 12-month observation period, utilization of inpatient services increased with FIB-4 score from 19.0% of patients in the lowest FIB-4 cohort having ≥1 all-cause inpatient admission to 45.4% in the highest FIB-4 cohort (). The mean length of inpatient stay ranged from 4.0 days (FIB-4 ≤ 0.95) to 5.6 days (FIB-4 > 4.12). Trends in the utilization of other categories fluctuated more but tended to be lowest among patients with FIB-4 ≤ 0.95 or >0.95 and ≤2.67 and highest among patients with FIB-4 > 4.12. Overall, utilization was high, with >95% of patients in all cohorts having ≥1 outpatient visit and >89% having ≥1 pharmacy claim. The mean ± SD number of unique medications documented during the 12-month observation period increased from 15.9 ± 15.6 in the lowest FIB-4 cohort to 20.8 ± 16.0 in the highest FIB-4 cohort.
Table 3. Annualized healthcare resource utilization.a
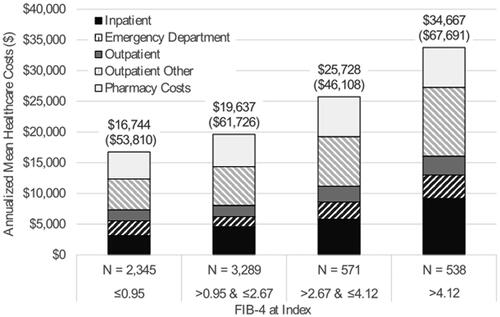
Consistent with utilization trends, mean ± SD annualized unadjusted all-cause healthcare costs increased with FIB-4 score from $16,744 ± $53,810 among patient with FIB-4 ≤ 0.95, to $19,637 ± $61,726 among patients with FIB-4 > 0.95 and ≤2.67, to $25,728 ± $46,108 among patients with FIB-4 > 2.67 and ≤4.12, to $34,667 ± $67,691 among patients with FIB-4 > 4.12 (). For all cohorts, other outpatient services were the largest driver of costs, comprising roughly 30% of mean total costs. Detailed costs, including medians, are reported in Supplementary File 3. While inpatient costs were the second-largest driver in the cohort of patients with FIB-4 scores >4.12 (comprising 26.5% of total costs), outpatient pharmacy costs were the second-largest driver in all other cohorts (comprising 25.2%–26.9% of total costs). Sensitivity analysis confirmed cost and utilization trends were similar using three alternate fibrosis cutoffs (Supplementary File 2).
Figure 2. Annualized healthcare costsa. aCombined the six-month baseline period and six-month follow-up period.
Fifty percent of healthcare spending came from only 6.8% (n = 461) of patients in this study (Supplementary File 3). Notably, while 34.8% of patients were in the lowest FIB-4 cohort, patients in this cohort made up only 25.2% of the 461 most expensive patients. By contrast, patients in the highest FIB-4 cohort comprised 8.0% of all patients but 16.5% of the most expensive patients.
We ran an exploratory analysis of the primary diagnoses associated with the most expensive patients to determine if the high costs of patients were due to the misclassification of cancer patients (Supplementary File 4). Diagnoses were highly variable, and there did not appear to be an enrichment of oncology diagnoses in the high FIB-4 cohort in either the costliest or the most frequent diagnoses. We looked specifically at hepatocellular carcinoma (HCC) and found that 0.4% (N = 28) of all patients had a diagnosis of HCC (). Of these, half (N = 14) were in the highest FIB-4 cohort but accounted for only 2.6% of the cohort; however, we did not see these codes associated with the highest cost encounter. We also conducted a reanalysis of the contributing components of the Charlson Comorbidity Index and found that the percentage of patients with codes for secondary malignancies, which are a surrogate for late-stage metastatic solid tumors, was similar across cohorts (0.6%–1.1%).
Multivariable modeling of total healthcare costs and hospital admissions
After adjusting for age, sex, race, region of residence, smoking status, and health status characteristics, a one-unit increase in FIB-4 at index was associated with a 3.4% (95%CI: 1.7%-5.2%) increase in mean total annual costs and an 11.6% (95%CI: 8.0%–15.3%) increased likelihood of hospitalization (). Comorbidities, as measured by the CCI and DSCI, were also significantly associated with higher ORs for hospitalization (OR:1.267, 95% CI: 1.226–1.310 and OR: 1.271, 95% CI: 1.217–1.327, respectively) and higher healthcare costs (estimate: 1.227, 95% CI: 1.207–1.248 and estimate: 1.180, 95% CI: 1.153–1.208, respectively). Because of concerns that age might be a confounding variable, a sensitivity analysis using APRI, instead of FIB-4, as the measure of liver fibrosis found that a one-unit increase in APRI at index was associated with a 9.9% (95%CI: 4.8%–15.3%) increase in mean total annual costs (Supplementary File 5).
Table 4. Results of multivariable adjusted models for total annual costs and hospital admissions.
Secondary analysis 1: BMI
There were 6,306 NASH patients with BMI recorded in the 12-month observation period (Supplementary File 6). Of these, 410 (6.5%) had BMI <25 (Lean NASH), 1,429 (22.7%) had BMI between 25 and 30, and 4,467 (70.8%) had BMI >30 (Obese NASH). Among the Lean NASH patients, 24.1% had an inpatient admission in the 12-month observation period compared to 25.3% of Obese NASH patients and 18.0% of patients with BMI between 25 and 30. The mean length of stay was the longest among Lean NASH patients (8.3 days), and mean ± SD all-cause inpatient costs were highest among Lean NASH patients ($9,129±$69,078).
Mean ± SD total all-cause costs were $24,568 ± $81,250 among Lean NASH patients, $21,542 ± $61,490 among Obese NASH patients, and 17,656 ± 43,553 among those with a BMI between 25 and 30. Lean NASH patients made up 8.1% of the most expensive patients despite accounting for only 6.5% of the overall NASH population.
Discussion
Although NASH is a common chronic liver disease, data regarding the burden of early-stage disease and tools to study it remains limited. Our study of 6,743 patients with NASH addresses this gap by providing data on the ability of FIB-4 to identify high-risk patients with 3 key findings. First, a higher FIB-4 was associated with higher rates of comorbidities and complications beyond cirrhosis, including type 2 diabetes, cardiovascular disease, and renal impairment. These factors, in turn, correlated with higher healthcare utilization and direct healthcare costs. Second, we found that for each one-unit increase in FIB-4, there was a 3.4% increase in healthcare costs and an 11.6% increased likelihood of hospitalization, underscoring the burden of NASH across the spectrum of disease and the potential value of early intervention. Third, we identified a population of Lean NASH patients whose utilization and costs were similar to Obese NASH patients and higher than patients with an intermediate BMI. This U-shaped relationship suggests that low BMI alone may not be helpful in assessing disease severity risk.
The value of FIB-4 stratification and analysis as a continuous measure
Our data extends research on the healthcare burden of NASH in multiple ways. First, we confirmed that more advanced NASH is associated with worse health outcomes. In an analysis of Medicare 20% data, adjusted costs for patients with compensated cirrhosis, decompensated cirrhosis, liver transplant, or hepatocellular carcinoma were 1.19, 3.15, 5.02, and 3.33 times higher, respectively, than NAFLD/NASH patients without these complicationsCitation9. In a similar analysis of MarketScan Commercial claims data, the adjusted costs compared to uncomplicated NAFLD/NASH were 1.22, 5.64, 8.27, and 4.09 for compensated cirrhosis, decompensated cirrhosis, liver transplant, or hepatocellular carcinoma, respectivelyCitation8. Similar trends were observed in studies using German and Spanish dataCitation6,Citation7. While this approach informs our understanding of NASH costs for patients at the more severe stages, patients who have not developed cirrhosis are treated as a single group despite representing a broad range of fibrosis severity. In our study, we showed how the discrimination of risk could be refined using FIB-4, a widely available measure. Indeed, 35.3% of patients in our study with a FIB-4 > 4.12 were not diagnosed as having cirrhosis by their clinicians.
Second, we improved our understanding of the cost of care associated with NASH across the spectrum of disease, with mean 12-month costs ranging from $16,744 for patients with FIB-4 ≤ 0.95 to $34,667 for patients with FIB-4 > 4.12. This cost range is consistent with prior studies, which have estimated the cost of uncomplicated NAFLD/NASH to range from $19,908 for Medicare patients to $22,953 for commercially-insured patientsCitation8,Citation9. Our analysis builds on existing studies by providing more recent data and restricts to patients with the ICD-10-CM code for NASH. It should be noted, that since we selected for patients with recent lab results, our study cohort may be enriched with patients more highly engaged in the healthcare system than the average NASH patient. While this should not impact our sub-group comparisons, it may lead to an overall inflation of total costs across the full study cohort.
In addition, this is the first real-world analysis to attempt to evaluate cardiovascular risk as a function of FIB-4 with the understanding that age is a contributing factor to both variables. Our multivariable analysis was unique in that rather than restrict to a categorical FIB-4, we included FIB-4 as a continuous variable reducing the uncertainty regarding the exact fibrosis stage while enabling an evaluation of the relationship between worsening fibrosis and healthcare costs. Our analysis supports the recent AASLD guidance, which states that multidisciplinary approaches to NASH management are important due to the overlap with metabolic syndrome and associated conditions typically managed by endocrinologists and primary care physiciansCitation31.
This study included patients with a diagnosis of cirrhosis, as there is a significant overlap between high FIB-4 values and cirrhosis. Future studies focused only on the lower range of FIB-4 values could explore FIB-4 as a predictor of costs in patients without cirrhosis. In addition, future research could estimate the marginal cost of liver disease when accounting for other comorbidities such as those contributing to metabolic syndrome. It would also be interesting to determine if higher FIB-4 correlated with higher indirect costs, such as increased absenteeism, reduced productivity, or poorer health-related quality-of-life, as prior studies have shown a reduced quality of life, higher non-medical costs, and work productivity losses with more advanced diseaseCitation32,Citation33.
Contextual factors
These findings must be interpreted in the context of the study of disease. First, the validity of claims data is challenged in part by the sensitivity and specificity of diagnostic codingCitation15. It would be ideal to confirm our findings using confirmed NASH through liver biopsies; however, only 3.4% of patients had a record of liver biopsy during the baseline period. This is likely due to three factors: (1) our patient selection algorithm did not select for patients at a particular time during their patient journey, (2) the baseline period was relatively short (six months), and (3) repeat biopsies are not recommended due to the costs, risks, and lack of clear benefit from repeat testingCitation34. However, even if we had redesigned the study to capture more biopsies, the results of these tests were not available in the structured EHR data used in this study. In addition, there was limited data from other diagnostic tests for liver fibrosis, such as elastography. Further, while our use of the K75.81 ICD-10-CM code is consistent with recent literature and recommendationsCitation22–24, there is likely both an underreporting and underdiagnosis of NASH. In fact, one study that recruited 1,070 asymptomatic participants estimated that underdiagnosis may be significant as the authors found that 57% of their asymptomatic participants had steatosis, and 16% demonstrated both steatosis and fibrosis, suggesting NASHCitation35.
Second, there is no gold standard for lab-based liver disease staging. We evaluated several methods for staging patients using scores that relied on routinely captured data, and these sensitivity tests confirmed the main results (Supplementary File 2); however, without liver biopsy results, we cannot verify the accuracy and precision of our cutoff ranges. For this reason, we incorporated FIB-4 as a continuous variable in the multivariable analysis so that the findings would not be biased by our cutoff selection.
Third, the dataset used in this analysis only included insured individuals who were continuously enrolled for at least one year and may not be representative of the US population. Coded NASH patients included in the study may also have higher than average utilization and costs because they represent patients actively engaged with the healthcare system due to the selection of patients with recent lab results. Additionally, the results of our analysis using this coded NASH population may not be generalizable to the broader NAFLD population. Fourth, the attribution of costs to NASH per se can be challenging. We accounted for this by incorporating two health indices, the CCI and DSCI, as covariates in our multivariable model. The CCI includes conditions strongly associated with morbidity and mortality, including myocardial infarction, congestive heart failure, diabetes, renal disease, and cancer, while the DSCI incorporates a number of diabetes-associated comorbidities, including retinopathies, neuropathies, and cardiovascular disease. Including these indices in our models helps to identify the portion of costs driven by comorbidities, some of which may have a bidirectional relationship with NASH. We also evaluated the most common diagnosis and most costly claims within cohorts to assess bias due to unrelated high-cost conditions (Supplementary File 4). These data are helpful in confirming that differences in costs across cohorts were not due to the concentration of other high-cost diseases such as cancer. We explored stratifying patients by type 2 diabetes; however, the complexity of the interaction between diabetes severity and NASH severity could not be covered in the scope of this manuscript.
Conclusions
A higher FIB-4 was associated with increased direct healthcare costs and risk of hospitalization in the population of patients with NASH; however, even patients with a lower FIB-4 presented a significant burden costing $16,744 annually. Small increases in FIB-4 were associated with a measurable increase in patient burden, supporting the need for treatments that slow or reverse early-stage fibrosis.
Transparency
Declaration of financial/other interests
AB, NZ, MB, and DL are employees of Veradigm, which received fees from Madrigal related to this work. JF, SD, and KM are employees of Madrigal Pharmaceuticals. EBT is an employee at the University of Michigan, which received unrestricted financial support to the institution related to this work. Peer reviewers on this manuscript have no relevant financial or other relationships to disclose.
Author contributions
EBT, MB, JF, SD, KM, and AB contributed to the conceptualization of the study. AB, NZ, and DL were responsible for data handling and formal analysis of the data. All authors contributed to the development of the methodology implemented in the study, data visualization, interpretation of the results, and writing and revising of the manuscript. All authors approved the final submitted version of the manuscript.
Previous presentations
Portions of this manuscript have been presented ISPOR 2022, ISPOR EU 2022, and ILC 2022.
Supplemental Material
Download MS Word (329.3 KB)Supplemental Material
Download MS Excel (41.4 KB)Acknowledgements
Medical writing support, funded by Madrigal Pharmaceuticals, was provided by Jessamine Winer-Jones, an employee of Veradigm.
Data availability statement
The data that support the findings of this study were used under license from Veradigm and Komodo Health. Due to data use agreements and its proprietary nature, restrictions apply regarding the availability of the data. Further information is available from the corresponding author.
References
- Harrison SA, Gawrieh S, Roberts K, et al. Prospective evaluation of the prevalence of non-alcoholic fatty liver disease and steatohepatitis in a large middle-aged US cohort. J Hepatol. 2021;75:284–291.
- Younossi ZM, Koenig AB, Abdelatif D, et al. Global epidemiology of nonalcoholic fatty liver disease-Meta-analytic assessment of prevalence, incidence, and outcomes. Hepatology. 2016;64:73–84.
- Noureddin M, Vipani A, Bresee C, et al. NASH leading cause of liver transplant in women: updated analysis of indications for liver transplant and ethnic and gender variances. Am J Gastroenterol. 2018;113:1649–1659.
- Estes C, Anstee QM, Arias-Loste MT, et al. Modeling NAFLD disease burden in China, France, Germany, Italy, Japan, Spain, United Kingdom, and United States for the period 2016-2030. J Hepatol. 2018;69:896–904.
- Sheka AC, Adeyi O, Thompson J, et al. Nonalcoholic steatohepatitis: a review. JAMA. 2020;323(12):1175–1183.
- Romero-Gomez M, Kachru N, Zamorano MA, et al. Disease severity predicts higher healthcare costs among hospitalized nonalcoholic fatty liver disease/nonalcoholic steatohepatitis (NAFLD/NASH) patients in Spain. Medicine. 2020;99:e23506.
- Canbay A, Kachru N, Haas JS, et al. Healthcare resource utilization and costs among nonalcoholic fatty liver disease patients in Germany. Ann Transl Med. 2021;9:615.
- Wong RJ, Kachru N, Martinez DJ, et al. Real-world comorbidity burden, health care utilization, and costs of nonalcoholic steatohepatitis patients with advanced liver diseases. J Clin Gastroenterol. 2021;55:891–902.
- Gordon SC, Fraysse J, Li S, et al. Disease severity is associated with higher healthcare utilization in nonalcoholic steatohepatitis Medicare patients. Am J Gastroenterol. 2020;115:562–574.
- Gordon SC, Kachru N, Parker E, et al. Health care use and costs among patients with nonalcoholic steatohepatitis with advanced fibrosis using the fibrosis-4 score. Hepatol Commun. 2020;4:998–1011.
- Younossi ZM, Tampi R, Priyadarshini M, et al. Burden of illness and economic model for patients with nonalcoholic steatohepatitis in the United States. Hepatology. 2019;69:564–572.
- Dulai PS, Singh S, Patel J, et al. Increased risk of mortality by fibrosis stage in non-alcoholic fatty liver disease: systematic review and meta-analysis. Hepatology. 2017;65:1557–1565.
- Chalasani N, Younossi Z, Lavine JE, et al. The diagnosis and management of nonalcoholic fatty liver disease: practice guidance from the American Association for the Study of Liver Diseases. Hepatology. 2018;67:328–357.
- Hayward KL, Johnson AL, Horsfall LU, et al. Detecting non-alcoholic fatty liver disease and risk factors in health databases: accuracy and limitations of the ICD-10-AM. BMJ Open Gastroenterol. 2021;8:e000572.
- Corey KE, Kartoun U, Zheng H, et al. Development and validation of an algorithm to identify nonalcoholic fatty liver disease in the electronic medical record. Dig Dis Sci. 2016;61:913–919.
- Shah AG, Lydecker A, Murray K, et al. Comparison of noninvasive markers of fibrosis in patients with nonalcoholic fatty liver disease. Clin Gastroenterol Hepatol. 2009;7:1104–1112.
- Johnson AL, Hayward KL, Patel P, et al. Predicting liver-related outcomes in people with nonalcoholic fatty liver disease: the prognostic value of noninvasive fibrosis tests. Hepatol Commun. 2022;6:728–739.
- Vilar-Gomez E, Chalasani N. Non-invasive assessment of non-alcoholic fatty liver disease: clinical prediction rules and blood-based biomarkers. J Hepatol. 2018;68:305–315.
- Tyree PT, Lind BK, Lafferty WE. Challenges of using medical insurance claims data for utilization analysis. Am J Med Qual. 2006;21:269–275.
- Benchimol EI, Smeeth L, Guttmann A, et al. The REporting of studies conducted using observational routinely-collected health data (RECORD) statement. PLoS Med. 2015;12:e1001885.
- Husereau D, Drummond M, Augustovski F, et al. Consolidated health economic evaluation reporting standards 2022 (CHEERS 2022) statement: updated reporting guidance for health economic evaluations. Value Health. 2022;25:3–9.
- Hagström H, Adams LA, Allen AM, et al. Administrative coding in electronic health care record-based research of NAFLD: an expert panel consensus statement. Hepatology. 2021;74:474–482.
- Qayed E, Migdal AL, Jagannathan R, et al. Characteristics and outcomes of black and white patients hospitalized with nonalcoholic steatohepatitis: a nationwide analysis. J Clin Gastroenterol. 2022. DOI:10.1097/MCG.0000000000001698
- Pemmasani G, Yandrapalli S, Aronow W. Sex differences in cardiovascular diseases and associated risk factors in non-alcoholic steatohepatitis. Am J Cardiovasc Dis. 2020;10:362–366.
- Schattenberg J, Alkhouri N, Taub R, et al. OS101 - utility of FIB-4 thresholds to identify patients with at-risk F2-F3 NASH based on screening data from a 2000 patient biopsy confirmed cohort of resmetirom phase 3 clinical trial, MAESTRO-NASH. J Hepatol. 2022;77:s75.
- Anstee QM, Lawitz EJ, Alkhouri N, et al. Noninvasive tests accurately identify advanced fibrosis due to NASH: baseline data from the STELLAR trials. Hepatology. 2019;70:1521–1530.
- Loomba R, Harrison SA, Taub R, et al. Utility of FIB-4, MRE, MRI-PDFF and fibroscan to identify patients with at-risk f2-f3 nash based on screening data from a 2000 patient biopsy confirmed cohort of resmetirom phase 3 clinical trial, MAESTRO-NASH. Presented at: the AASLD; 2022 Nov 6; Boston, MA. Hepatology [Internet]. 2022 [cited 2023 Feb 8]. Available from: https://www.aasld.org/the-liver-meeting/utility-fib-4-mre-mri-pdff-and-fibroscan-identify-patients-risk-f2-f3-nash-based
- Quan H, Li B, Couris CM, et al. Updating and validating the Charlson Comorbidity Index and score for risk adjustment in hospital discharge abstracts using data from 6 countries. Am J Epidemiol. 2011;173(6):676–682.
- Glasheen WP, Renda A, Dong Y. Diabetes complications severity index (DCSI)—update and ICD-10 translation. J Diabetes Complications. 2017;31:1007–1013.
- Goff DC, Lloyd-Jones Donald M, Bennett G, et al. 2013 ACC/AHA guideline on the assessment of cardiovascular risk. J Am Coll Cardiol. 2014;63:2935–2959.
- Cusi K, Isaacs S, Barb D, et al. American Association of Clinical Endocrinology Clinical Practice guideline for the diagnosis and management of nonalcoholic fatty liver disease in primary care and endocrinology clinical settings: co-sponsored by the American Association for the Study of Liver Diseases (AASLD). Endocr Pract. 2022;28:528–562.
- O’Hara J, Finnegan A, Dhillon H, et al. Cost of non-alcoholic steatohepatitis in Europe and the USA: the GAIN study. JHEP Rep. 2020;2:100142.
- Geier A, Rinella ME, Balp M-M, et al. Real-world burden of nonalcoholic steatohepatitis. Clin Gastroenterol Hepatol. 2021;19:1020.e7–1029.e7.
- Rinella ME, Neuschwander-Tetri BA, Siddiqui MS, et al. AASLD practice guidance on the clinical assessment and management of nonalcoholic fatty liver disease. Hepatology. 2023. DOI:10.1097/HEP.0000000000000323
- Eskridge W, Vierling JM, Gosbee W, et al. Screening for undiagnosed non-alcoholic fatty liver disease (NAFLD) and non-alcoholic steatohepatitis (NASH): a population-based risk factor assessment using vibration controlled transient elastography (VCTE). PLoS One. 2021;16:e0260320.