
Abstract
Objective
To assess the public health impact and economic value of booster vaccination with the Pfizer-BioNTech COVID-19 Vaccine, Bivalent in the United States.
Methods
A combined cohort Markov decision tree model estimated the cost-effectiveness and budget impact of booster vaccination compared to no booster vaccination in individuals aged ≥5 years. Analyses prospectively assessed three scenarios (base case, low, high) defined based upon the emergence (or not) of subvariants, using list prices. Age-stratified parameters were informed by literature. The cost-effectiveness analysis estimated cases, hospitalizations and deaths averted, Life Years (LYs) and Quality Adjusted Life Years (QALYs) gained, the incremental cost-effectiveness ratio (ICER), the net monetary benefit (NMB), and the Return on Investment (ROI). The budget impact analyses used the perspective of a hypothetical 1-million-member plan. Sensitivity analyses explored parameter uncertainty. Conservatively, indirect effects and broad societal benefits were not considered.
Results
The base case predicted that, compared to no booster vaccination, the Pfizer-BioNTech COVID-19 Vaccine, Bivalent could result in ∼3.7 million fewer symptomatic cases, 162 thousand fewer hospitalizations, 45 thousand fewer deaths, 373 thousand fewer discounted QALYs lost, and was cost-saving. Using a conservative value of $50,000 for 1 LY, every $1 invested yielded estimated $4.67 benefits. Unit costs, health outcomes and effectiveness had the greatest impact on results. At $50,000 per QALY gained, the booster generated a 34.2 billion NMB and probabilistic sensitivity analyses indicated a 92% chance of being cost-saving and 98% of being cost-effective. The bivalent was cost-saving or highly cost-effective in high and low scenarios. In a hypothetical 1-million-member health plan population, the vaccine was predicted to be a budget-efficient solution for payers.
Conclusions
Booster vaccination with the Pfizer-BioNTech COVID-19 Vaccine, Bivalent for the US population aged ≥5 years could generate notable public health impact and be cost-saving based on the findings of our base case analyses.
Introduction
The public health and societal impact of COVID-19 and the associated economic and social fallouts have been far-reachingCitation1,Citation2. More than three years in the pandemic, the SARS-CoV-2 virus has infected over 750 million people worldwide and caused almost 7 million deathsCitation2. The US has borne a significant healthCitation2,Citation3 and economicCitation4 burden with over 100 million infections and 1 million deathsCitation2,Citation3.
The Omicron variant of SARS-CoV-2 emerged in late 2021 and caused a rapid increase in COVID-19 cases, including in the US and other countries with substantial COVID-19 vaccination coverage and infection-induced immunity levelsCitation2,Citation3,Citation5. Boosting recommendations continue to be a critical component of the US Centers for Disease Control (CDC) public health response to reduce adverse outcomes from COVID-19Citation6,Citation7. During September-October 2022, the FDA removed the emergency use authorization (EUA) for monovalent COVID-19 booster doses and amended the EUA of the Pfizer-BioNTech COVID-19 Vaccine to authorize the Pfizer-BioNTech COVID-19 Vaccine, Bivalent (Original and Omicron BA.4/BA.5), hereafter referred to as Pfizer-BioNTech COVID-19 Vaccine, Bivalent for use as a single booster dose in individuals aged ≥5 years of age and older at least two months following primary or booster vaccination with any authorized or approved monovalent COVID-19 vaccineCitation6,Citation7. The CDC broadly recommended the updated bivalent COVID-19 boosters to potentially increase the immune response and restore protection following waning in the face of the circulating Omicron sub-lineagesCitation6,Citation8. The recommendations were based on an assessment of the data on immunogenicity and safety from clinical trials of mRNA bivalent vaccinesCitation6,Citation8,Citation9.
COVID-19 vaccines have been provided for free by the US government during the course of the public health emergencyCitation10.
Health economic evaluations using pandemic price levels showed that, in the US, COVID-19 vaccines generated substantial public health impact and were cost savingCitation11–15. With high population immunity levels, uncertain trajectory of the pandemic and the transition to traditional commercial market settings, research is warranted to assess how the cost-effectiveness and affordability profile of COVID-19 vaccines may change in response to changes in the burden of disease and costs. The aim of this study was to estimate the public health impact and economic value of bivalent booster vaccination in the US under commercial settings, across several burden of disease scenarios. Based upon CDC estimates, as to mid of December 2022, the Pfizer-BioNTech COVID-19 Vaccine, Bivalent represented the highest share of the US population boosted with a bivalent, accounting for ∼65% of all the bivalent booster doses administeredCitation3,Citation5. The primary objective of this study was to assess the societal impact and cost-effectiveness of the Pfizer BioNTech COVID-19 Vaccine, Bivalent and the secondary objective was to estimate the budgetary impact of its adoption from the perspective of a hypothetical 1-million-member health plan.
Methods
Study design
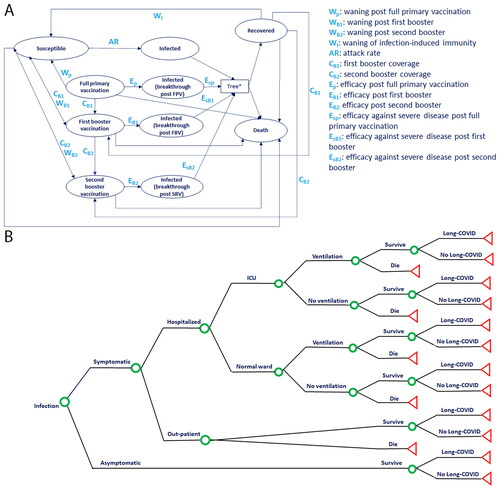
A cost-effectiveness and budget impact analysis were conducted comparing vaccination with the COVID-19 bivalent booster with no booster vaccination, incorporating the effects and costs related to COVID-19 disease and vaccination. The decision analytic model used in this economic evaluation was previously describedCitation11. The cost-effectiveness model structure builds on a combined cohort Markov and decision tree with transition probabilities based on COVID-19 literature (). The budget impact model (BIM) structure uses the decision tree portion of the cost-effectiveness model (). Model inputs were derived from published evidence and stratified by age when data was available.
Figure 1. Economic model structure combining (A) Markov cohort model and (B) decision tree component used in both the cost-effectiveness and the budget impact analyses. In the Markov model component, individuals transition weekly through health states related to COVID-19 protection and infection. If individuals transition into any infection state, they immediately enter (B) the decision tree component for sorting. Green circles indicate decision points, with probabilities informed by the level of protection against COVID-19 in the particular infected state from which an individual arrives. Red triangles indicate decision tree end points, from which participants re-enter the Markov model component. Abbreviations. ICU, intensive care unit; SBV, second booster vaccination.
The analysis was conducted in individuals aged 5 years of age and older, the target population eligible for a single bivalent booster dose (30 mcg for 12 years of age and older, 10 mcg for 5 through 11 years of age) administered at least two months after either completion of primary vaccination with any authorized or approved COVID-19 vaccine, or receipt of the most recent booster dose with any authorized or approved monovalent COVID-19 vaccine. The CDC recommends COVID-19 vaccination for this population regardless of history of symptomatic or asymptomatic infectionCitation6,Citation8,Citation9. The intervention modeled was a single booster dose of the Pfizer-BioNTech COVID-19 Vaccine, Bivalent booster and was compared to no booster vaccination, based on CDC guidanceCitation6,Citation8,Citation9.
The analytic time horizon was governed by vaccine-induced duration of protection assumptions and set to a maximum of one year, starting the last week of August 2022, when the bivalent booster received authorizationCitation16. This time horizon was chosen based on (1) existing evidence regarding vaccine-induced duration of protection, which has been shown to be short-lived against infection and more stable against severe outcomes, (2) the rapidly changing nature of the SARS-CoV-2 virus introducing uncertainty in projecting long-term model inputs, and (3) expectations from public health authorities to transition to an annual implementation of updated COVID-19 vaccinesCitation16–18.
Given the uncertainty on the future trends of COVID-19, this analysis simulated three scenarios: (1) a base case assuming the emergence of sub-lineages with similar presentation as the ones prevalent during the second half of 2022 (e.g. BA.1, BA.4, BA.5, BQ.1, BQ.1.1)Citation3, and similar levels of protection from natural and vaccine-induced immunity as reported in that period, (2) a high case, assuming the emergence of an immune-escape variant leading to increased levels of disease severity and faster immunity waning than the base case, and (3) a low case, assuming no emergence of new variants and a receding pandemic with attack rates trending toward a severe flu season.
The cost-effectiveness analyses were conducted from a societal perspective, in alignment to ACIP guidelinesCitation19 and the Second Panel on Cost-Effectiveness in Health and MedicineCitation20. The budget impact analyses used the base case inputs of the cost-effectiveness model and were conducted from a payer perspective, with indirect costs as sensitivity.
The model was programmed in Microsoft Excel 2021. Given the nature of the study, ethical approval was not required. This publication has been prepared in accordance with the 2022 Consolidated Health Economic Evaluation Reporting Standards guidelines (Supplemental Table 1)Citation21.
Table 1. Main model parameters for the base case.
Model structure
The model was built using a combined cohort Markov () and decision-tree structure () that was previously describedCitation11.
Briefly, the Markov model simulated the transition of the target population through mutually exclusive health states () based on a Susceptible-Infected-Recovered (SIR) structure and Vaccinated states. The “infected state” of the Markov model was linked with a Decision tree () for transition probabilities of symptomatic and asymptomatic infections, and sequelae such as hospitalization, receiving intensive care (ICU) and/or invasive mechanical ventilation (IMV), and long COVID.
In alignment with the bivalent booster authorized indicationCitation7, all cohorts entering the model were previously vaccinated with a primary series, with or without a monovalent booster regimen. The model assumed that cohorts could enter the model either with infection-induced immunity in the “Recovered” health state, or with vaccine-induced immunity in one of the “Vaccinated” health states (“Full primary vaccination” or “First booster vaccination” or “Second booster vaccination”), or in the “Susceptible” (i.e. no longer protected) state. The cohorts moved through health states in weekly cycles over a one-year time horizon. In each cycle, cohorts could transition to other health states according to age-dependent probabilities. Individuals in the “Recovered” state were assumed to be protected by infection-induced immunity, with their immunity assumed to wane at a rate of 1/duration of protection, at which point they transition to “Susceptible”. An age-dependent annual attack rate determined the proportion of those in the “Susceptible” state that would transition to the “Infected” state. The age-dependent attack rate was reduced by the measure of vaccine effectiveness to determine the proportion of those in the “Vaccinated” health state that transitioned to the “Infected” state. Individuals were eligible to receive the bivalent booster from any health state at model start; the uptake was defined based on vaccine coverage assumptions. Upon vaccination, vaccine effectiveness began to wane at a rate of 1/duration of protection, and cohorts transitioned to the “Susceptible” state with a probability governed by the attack rate and vaccine effectiveness against infection.
Upon infection, cohorts entered the decision tree component and moved through it according to outcome probabilities based on the health state from which they entered the tree. Outcome probabilities were informed by scenario-specific efficacies against symptomatic disease and hospitalization. Symptomatic cases were assumed to be managed in the outpatient or hospitalized setting, and incurred healthcare costs for clinical care including visits, testing, medication, and hospitalization treatment. Hospitalized patients remained in the general ward or were admitted to the intensive care unit (ICU) and could receive invasive mechanical ventilation (IMV) in either setting. Both symptomatic and asymptomatic individuals who survived infection could move further in the decision tree and experience long-term outcomes of COVID-19 (Long COVID) and incurred the costs of managing these symptoms. The outcome probabilities corresponding to the decision tree node “Survive” or “Die” determined whether individuals returned to the Markov model component in the “Recovered” or “Death” states, respectively. Death during the “Infection” state was attributed to COVID-19, whereas death during any other state was attributed to all other cause mortality.
Model parameters
A targeted literature review was conducted on PubMed and Google Scholar between August and September 2022 to explore the literature and collect suitable data fit-for-purpose to inform model estimates (Supplementary Appendix A). The review was complemented by weekly searches through January 2023, incorporating relevant new evidence as it became available. The main model inputs for the base case and scenario analyses are presented in and further detailed in Supplemental Tables. Supplemental Table 2 summarizes the datasets used to inform model development.
Table 2. Projected COVID-19 health and economic outcomes in the absence of COVID-19 vaccination in individuals ≥5 years old in the US under three burden of disease scenarios over one year.
Population
Age-stratified estimates of population size were adopted from the US Census Bureau population projections for 2020 (Supplemental Table 3)Citation22. The population eligible for a bivalent booster was derived from the CDC reported percentages of the US population aged five years and older whom had completed primary vaccination approximately two months prior to the bivalent booster rolloutCitation5 including individuals whom received their first and/or second booster of the previously authorized monovalent vaccines, which are no longer authorized for booster dosesCitation8. US age-specific population estimatesCitation22 were used to adjust the age-stratified percentages to match model age groups (Supplemental Table 4).
Table 3. Results of the cost-effectiveness analysis of booster vaccination with the Pfizer-BioNTech COVID-19 vaccine, bivalent (Original and Omicron BA.4/BA.5) in individuals ≥5 years old in the US under three burden of disease scenarios over one year.
Table 4. Base case results of the budget impact analysis of booster vaccination with the Pfizer-BioNTech COVID-19 vaccine, bivalent (Original and Omicron BA.4/BA.5) in the US for a 1-million-member plan over one year.
Infection inputs
The data from the CDC COVID Data TrackerCitation5,Citation23 was used to inform the distribution of the starting population for the model, and served as the primary source for infection statistics.
Age-stratified point prevalence of infection-induced, vaccine-induced and hybrid immunity were not available in the literature at the start of the model time horizon. The proportions of the population entering the model as recovered (i.e. with infection-induced immunity) and vaccinated (i.e. with vaccine-induced immunity) were therefore defined based on a review of the timing of rollout of primary series, first and second monovalent boostersCitation8, evidence on the duration of vaccine-induced and infection-induced immunity during Omicron and the latest CDC seroprevalence dataCitation18,Citation24–30. The CDC seroprevalence data indicating that ∼55% of the population had infection-induced immunity during Omicron peak was used for the low scenarioCitation26. The low scenario also conservatively assumed that approximately half of the individuals whom received a second monovalent booster (authorized at the end of March 2022) retained vaccine-induced immunityCitation5. As such, this scenario assumed ∼60% hybrid immunity in the population at model start, which was directionally consistent although more conservative than the preliminary analyses of unweighted NHANES data, which found that 42% of adults had prior infection during OmicronCitation24. The base case scenario assumed a level of infection-induced immunity similar to the one reported in seroprevalence studies prior to the emergence of OmicronCitation26, and assumed a ∼35% hybrid immunity in the population at model start. Finally, the high case used the upper range of the low and base case scenarios for the level of infection-induced immunity, and assumed that, due to the waning of vaccine-induced immunity observed during Omicron, especially against infection, none of the individuals who had received the second monovalent booster had residual vaccine-induced immunity at the start of the time horizon (Supplemental Table 4).
The remaining portion of the population entered the model as “Susceptible”. In the base case, the annual attack rates determining the percentage of the susceptible cohort that would become infected with SARS-CoV-2 were derived from CDC reported age-stratified weekly infection rates for the period immediately preceding the booster rolloutCitation23, projected to an annual rate. US age-specific population estimatesCitation22 (Supplemental Table 3) were used to adjust CDC age-stratified rates to match model age groups. These estimates were adjusted for CDC under-reporting infection ratios, which were not age-stratifiedCitation31. Attack rates from prior periods and flu were reviewed for a qualitative comparison of trends and to inform plausible estimates for the scenarios. The low scenario used early incidence data reported by the CDC for the time period in which the original strain was predominantCitation31, and the high scenario was derived from data from the other two scenarios (Supplemental Table 5).
Table 5. Base case population-level outcomes in individuals ≥5 years old in additional sensitivity analysis using alternative values for main model inputs.
Vaccine inputs
Vaccine-specific inputs such as coverage, vaccine effectiveness, and duration of protection, were integrated from various sources and based upon medical opinion.
The demographic trends of individuals aged ≥5 years receiving the first COVID-19 monovalent booster vaccination reported by the CDCCitation5 were used to define age-dependent booster vaccination coverage inputs for the base case. US age-specific population estimatesCitation22 were used to adjust CDC age-stratified uptake rates to match model age groups (, Supplemental Table 6).
In the absence of vaccine efficacy data from randomized controlled trials (RCTs), vaccine effectiveness (VE) and duration of protection data was sourced from real-world studiesCitation29,Citation30,Citation32–36 assessing the effects of the Pfizer-BioNTech COVID-19 bivalent (or, in absence, the monovalent booster), against mild and severe SARS-CoV-2 infection during the predominance of Omicron sub-lineages. Initial relative VE of a first booster against monovalent primary series was used as the main basis for clinical data, as the primary series was the alternative regimen approved at the time of writing, and the established practice from a competing resource perspective, given EUA revocation for monovalent boosters.
TartofCitation29 reported that, among immunocompetent US adults, the VE against BA4/BA5 of a third dose monovalent booster was in the range of 55% to 70% for outpatient and emergency department (ED) less than three months since the last dose, and >70% for hospitalization three to five months after the third dose. The same research group reported VE of a third monovalent booster against BA1/BA2 in the range of 75% to 80% for hospitalization and 60% to 75% for EDCitation30. Duration of protection against outpatient/ED waned within approximately six months and was more stable against severe disease. SurieCitation35, Link-GellesCitation33, and TenfordeCitation36 reported early VE estimates of mRNA bivalent boosters compared with no vaccination in the US, compared with receipt of last monovalent dose, stratified by time of prior vaccination. SurieCitation35 reported VE against hospitalizations among US elderly of ∼80% (range: 60% to 90%) compared to receipt of ≥2 monovalent doses >6 months earlier. Link-GellesCitation33 reported VE against symptomatic disease of ∼50% (range of 37–52%) compared to receipt of 2 to 4 prior monovalent doses. TenfordeCitation36 reported VE against ED, urgent care or hospitalization in the range of 45% to 60% compared to receipt of ≥2 monovalent doses >5 months earlier. ArbelCitation32 reported 81% VE against hospitalization and a borderline statistically significant 86% VE against death among elderly who received a bivalent booster in Israel. Building on this body of evidence, the base case assumed that initial VE against infection (60%) was lower than against severe disease (80%)Citation6,Citation9,Citation18,Citation25,Citation27,Citation29–32,Citation34–36. The scenarios used alternative values assuming lower and higher vaccine protection and uptake in the high and low scenarios, respectively. The VE assumptions were in line with the ones used in prior modelsCitation9.
There is currently no evidence regarding the effectiveness of bivalent boosters against transmissionCitation9,Citation11. The existing literature is limited and not conclusive or specific yet as to the patterns and the sustainability of such effects; the CDC acknowledges that the protection provided by the monovalent vaccines against transmission is lower than against severe disease and diminishes over time, especially against the Omicron sub-lineagesCitation25. As such, indirect effects (herd immunity) were conservatively not considered, and the duration of protection against infection was assumed to be six months in the base case (scenarios: five to seven months), along with a duration of protection against severe disease of eight months (scenarios: seven to nine months), both tested in scenario analyses.
There is growing evidence that COVID-19 vaccination can attenuate symptoms, duration of illness and medical care seekingCitation37, as well as increase protection after prior infectionCitation38–41. Conservatively, such effects were also not considered.
Health inputs
Health inputs are detailed in and Supplemental Table 7.
Systematic literature reviews informed the probability of an individual with COVID-19 infection experiencing symptoms for the low scenarioCitation42 and the high scenario used data from a US study conducted during the Omicron surgeCitation43. The base case used the midpoint of these two estimates. Studies assessing the effectiveness of Omicron infection-induced immunity reported time to re-infection as short as 60 to 90 daysCitation25,Citation27,Citation28. Consistent with the CDC definition of re-infectionCitation25, the cost-effectiveness model assumed that Omicron infection conferred a limited duration of protection of three months; this parameter was not used in the budget impact model (BIM) calculations as the BIM does not include Markov health sates; individuals are tracked as vaccinated or unvaccinated and enter the decision tree when infected. The probability of an individual with symptomatic infection being hospitalized were derived from the Coronavirus Disease 2019 Associated Hospitalization Surveillance Network (COVID-NET) age-stratified weekly hospitalization ratesCitation44. The high scenario used rates reported in early 2022 during the Omicron peak. The low scenario used rates from the period immediately preceding the booster rollout, when rates were the lowest for all non-elderly age groups compared to the whole pandemic period, and comparable to the pre-Delta period for the elderly. The base case used the age-stratified mid-points. The weekly rates were projected to an annual rate, adjusted based on the distribution of the US population age groupsCitation22 and hospitalization under-reportingCitation31. The hospitalization rates were qualitatively compared to those reported by other US datasets for relevant time periods, and were found to be plausibleCitation45,Citation46. A retrospective analysis of the US Premier Healthcare COVID-19 Hospital databaseCitation47 was used to inform several age-dependent inpatient inputs: the distribution of symptomatic cases by general ward or ICU and receipt of IMV, case fatality rates for hospitalization. Outpatient mortality inputs were based on a database of US academic centersCitation48. We assumed that individuals with asymptomatic infection did not die or require any inpatient or outpatient treatment but could experience long COVID complicationsCitation11. The probability of long COVID was differentiated by inpatient, outpatient, and asymptomatic cases, and was derived from published literature reporting prevalence of persistent COVID-19 symptoms lasting beyond the acute phaseCitation49–53 as well as probabilities of readmissionCitation49,Citation50,Citation52–55. Literature reporting prevalence of long COVID was found to be highly heterogeneous, especially for non-hospitalized individualsCitation49,Citation50,Citation52–54. For individuals ≥12 years of age, the scenarios assumed an average probability of long COVID among non-hospitalized individuals of 18% (low) to 27% (high), and, respectively, 43% to 64% among hospitalized individuals. This assumption was in line with meta-analyses and US-based studies reporting point prevalence of 30 to 60% among non-hospitalized individuals and over 50% for hospitalized individuals during the year following infectionCitation49,Citation50,Citation52,Citation53. More conservative assumptions (5–10%) were used for the probability of long COVID among children aged 5 to 11 yearsCitation54.
Healthcare resource use and direct cost inputs
Individuals experiencing COVID-19 infection could incur direct costs ( and Supplemental Table 8) in the acute phase for COVID-19 tests, disease management in inpatient (hospitalization) or outpatient (general physician [GP] visits, emergency room, and over-the-counter medication) setting. Acute phase hospitalization costs, derived from a large US hospital claims databaseCitation47, were divided by ward, ICU and IMV use. Individuals with long COVID could incur further direct costs for additional COVID-19 tests, GP visits, specialist visits, and re-hospitalization. Outpatient inputs were derived from large retrospective claims database studiesCitation56,Citation57. The inpatient and outpatient cost inputs used in the base case were pre-Omicron and pre-Delta and were conservative compared to FAIR Health national estimatesCitation58.
Vaccine-related costs included administration costsCitation59 and vaccine cost per unitCitation60, both under non-pandemic commercial settings. No serious adverse events (AEs) related to the vaccine were reported for the bivalent booster in early clinical dataCitation6,Citation9; conservatively, the model used the AEs observed for the first monovalent boosterCitation61,Citation62. Hospitalization costs associated to AEs were sourced from HCUPnet (Supplemental Table 9)Citation63.
Indirect costs
Indirect costs included productivity loss due to acute illness, long COVID and premature death ( and Supplemental Table 10). Lost productivity costs due to illness were calculated based on the workforce participation rateCitation64, labor cost per weekCitation65, and number of work days lost. The work days lost estimates were informed by the CDC isolation requirementsCitation66, studies assessing length of stay during hospitalization treatmentCitation47, long-term consequences after critical illnessCitation67 and long COVIDCitation68. Specifically for long COVID, a US studyCitation68 indicated that about 1 in 4 (25.9%) long-haulers reported that their long COVID condition affected employment or work hours. While a majority remained employed, they experienced reduced work hours. Based on the above, the base case assumed that one fourth of the working time of a long hauler during the one-year time horizon (i.e. 90 days) is affected by long COVID. Productivity loss due to premature death was accounted for on a lifetime horizon and discounted at a rate of 3% per year in accordance with economic evaluation guidelinesCitation19,Citation20. Conservatively, work productivity loss for caregivers was not considered. All costs were expressed as 2022 US dollars.
Health utilities
Quality-adjusted life years (QALYs) lost due to acute illness and long COVID were estimated by accumulating utility decrements corresponding to the short and long-term symptomatic outcomes for the duration of illnessCitation69–74. Further details are provided in , Supplemental Table 11 and Supplemental Methods. Long-term QALY loss associated with early death was included on a lifetime horizon and discounted at 3% annuallyCitation11,Citation13. Health utilities parameters were not used in the BIM calculations as the BIM only include costsCitation21.
Model analyses
The model predicted the health outcomes averted by vaccination (COVID-19 symptomatic cases, hospitalizations, and deaths), alongside the corresponding direct healthcare and productivity costs saved, and QALYs gained, compared with no booster vaccination.
The cost-effectiveness results were summarized using the incremental cost-effectiveness ratio (ICER) per QALY gained. The ICER was calculated by dividing differences in costs by differences in QALYs under a societal perspective and was estimated based on willingness to pay thresholds commonly used in the United StatesCitation13. Additional summary metrics analyzed were the net monetary benefit (NMB) and the Return on Investment (ROI). The NMB was calculated using a threshold of $50,000 per QALY gainedCitation13,Citation14; it was estimated by multiplying the discounted QALY gained by the threshold and subtracting the net direct and indirect cost savings. The ROI was estimated with a method used to estimate the ROI for the COVID-19 vaccination program in New YorkCitation75 by summing the direct and indirect cost savings with the monetary value of discounted lifetime life years (LY) saved (valued at $50,000 per LY) and dividing by the total vaccine-related costs.
The budget impact analyses projected the health outcomes and costs of a “current scenario” of no booster vaccination and those associated to an “alternative scenario” with the introduction of the Pfizer BioNTech COVID-19 Vaccine. The incremental budget impact was calculated by subtracting the costs of the “alternative scenario” from the “current scenario”, under both a payer and societal perspective. For simplicity, results were presented for a hypothetical health plan of 1 million members.
The base case results were followed by those of the low and high scenarios. Such scenarios used extreme but plausible alternative values of model parameters, informed by (1) burden of disease data of time periods of, respectively, lower and higher severity and transmissibility of SARS-CoV-2 and (2) medical opinion. Of note, lower bounds were used for the low scenario, and the upper bounds were used for the high scenario for all parameters except those related to the proportion of individuals with infection-induced immunity at model start, and the duration of protection from infection-induced immunity; for both the parameters, their upper bound values were used in the low scenario.
Deterministic and probabilistic sensitivity analyses were conducted to explore further variation in the base case results. A deterministic sensitivity analysis was performed to assess the impact of individual parameter variability on both the ICER. Input parameters were varied ±20% from the base case value and presented in a tornado diagram. Additional sensitivity analyses were run to assess vaccine impact in the broadest population of individuals ≥12 years and using more extreme values for model inputs driving results.
In a Monte Carlo probabilistic sensitivity analysis (PSA) the ICER was calculated 1,000 times based on variable parameter input according to probability distributions for model costs, outcomes, and probabilities. Distributions applied to model parameters were beta (e.g. attack rate, vaccine coverage, probability of symptomatic disease, of ICU care, and of mechanical ventilation), gamma (e.g. costs and duration of illness), log-normal (e.g. probability of symptomatic disease, attack rates, AE rates), and normal (e.g. probability of hospitalization, for which the sample size in the source data was high enough to assume that the central limit theorem holds)Citation76. Published confidence intervals were used to parameterize the distributions when available; otherwise, conventional assumptions about the parameters’ standard error and standard deviations were used. Results of the PSA were presented in a cost-effectiveness plane and a cost-effectiveness acceptability curve.
Results
Burden of disease in the absence of COVID-19 booster vaccination
shows the estimated burden of disease in the absence of COVID-19 vaccination in the base case, low and high scenarios. In the base case, the model predicted 52 million new symptomatic cases, 382 thousand deaths, 1.5 million hospitalizations, $164 billion in direct costs of COVID-19 health outcomes (e.g. hospitalizations, outpatient treatments), $200 billion in indirect costs, and $364 billion in total costs. Across the low and high scenarios, the model predicted 38 and 70 million new symptomatic cases, 91 thousand and 1.1 million deaths, and 345 thousand to 3.5 million hospitalizations in the absence of vaccination, respectively. The associated direct costs in the low and high scenarios were estimated to be $85 billion and $320 billion, respectively without vaccination. Indirect costs in the low and high scenarios were estimated to be $134 billion and $321 billion, respectively without vaccination. Total costs in the low and high scenarios were estimated to be $219 billion and $642 billion, respectively.
Base case
The base case results are presented in . At a population-level, the model predicted that the Pfizer-BioNTech COVID-19 Vaccine, Bivalent booster would contribute to avert over 3.7 million symptomatic cases, over 162 thousand hospitalizations, almost 45 thousand deaths related to COVID-19, resulting in an estimated $2.4 billion direct and $13.1 billion discounted indirect cost savings, as well as discounted gains of 373 thousand million QALYs. The vaccine-related costs were estimated to amount to $9.7 billion and to be offset by the cost savings in direct medical costs alone. The $15.5 billion net cost savings yielded a negative ICER; hence the base case model predictions indicated that, using the commercial list prices and a societal perspective, the Pfizer-BioNTech COVID-19 bivalent booster was a dominant strategy (i.e. more effective, less costly) compared to no booster vaccination. The bivalent booster strategy was predicted to generate a net monetary benefit of $34.2 billion at a cost-effectiveness threshold of $50k/QALY gained and $52.9 billion at a threshold of $100k/QALY gained.
The base case budget impact analyses for a hypothetical 1-million-member plan are shown in . In subjects ≥5 years old, vaccine-related costs of $29.6 million were offset by a total of $64.8 million estimated direct cost savings, resulting in $30.2 million net cost savings (4 A). Budget impact analysis in subjects ≥12 years old yielded slightly higher cost savings (4B).
Scenario analyses
The results of scenario analyses are presented in . The benefits of the vaccine increased in the high scenario, driven by higher burden of disease despite assuming lower vaccine effectiveness and duration of protection than the base case. The high scenario estimated that the Pfizer-BioNTech COVID-19 bivalent booster could prevent over 3.8 million symptomatic cases, over 292 thousand hospitalizations, over 99 thousand deaths, and remained cost-saving. Symptomatic cases averted were similar to the base case because attack rates were similar for younger ages. Using more conservative estimates of burden of disease and clinical effectiveness, the low scenario estimated that the Pfizer-BioNTech COVID-19 Vaccine, Bivalent could prevent over 3.5 million symptomatic cases, over 48 thousand hospitalizations, over 13 thousand deaths and was highly cost-effective with an ICER of $26,237 per QALY gained from the payer perspective and was cost-saving from the societal perspective.
Sensitivity analyses
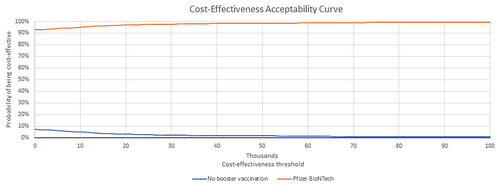
The one-way sensitivity analysis suggested that the base case results were robust. In the worst case, the Pfizer-BioNTech COVID-19 Vaccine was cost saving, reducing total societal costs by $12.6 billion. The results were most sensitive to varying estimates of duration of protection of infection-induced immunity, acquisition cost for individuals ≥12 years old, GP visits for outpatient cases and Long COVID, probability of symptomatic infection, hospitalization rate, vaccine effectiveness, and the probability of Long COVID (). presents additional one-way sensitivity analyses with higher and/or different estimates than the deterministic sensitivity analyses on selected parameters expected to have the highest impact on direct costs. The base case results were relatively robust and showing cost savings when using a higher duration of infection-induced immunity (four months instead of three months), a lower vaccine duration of protection against infection (five months instead of six months), a 30% higher acquisition cost, a 30% higher GP visit unit cost, a lower probability of readmission (4% instead of 7%), and use of the highest administration fee per dose ($40 instead of $28.4). Results were robust as well based on the PSA. shows the cost-effectiveness plane with 92% of the simulations in the south-east quadrant (lower cost, higher efficacy versus no booster vaccination) and 98% of the simulations below the reference ICER threshold of $50,000 per QALY gained. As such, the cost-effectiveness acceptability curves () showed an average 98% probability of the Pfizer-BioNTech COVID-19 Vaccine, Bivalent being cost-effective at $50,000 per QALY gained.
Figure 2. Deterministic sensitivity analysis: Tornado diagram for incremental cost – societal perspective in individuals ≥5 years old. Color of the bar indicates whether the parameter is at its lower or upper bound. Over 400 parameters were tested and this figure includes only the 20 most impactful parameters.
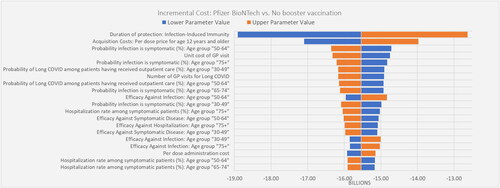
Figure 3. Probabilistic sensitivity analysis: cost-effectiveness plane for societal perspective in individuals ≥5 years old.
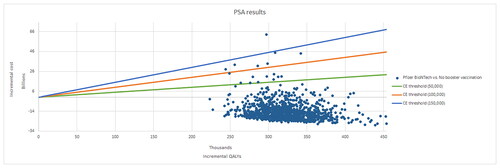
Figure 4. Probabilistic sensitivity analysis: cost-effectiveness acceptability curve for societal perspective in individuals ≥5 years old.
The DSA and PSA results from a payer perspective are presented in Supplemental Figures 1, 2 and 3. 70% of the simulations were in the south-east quadrant (lower cost, higher efficacy versus no booster vaccination) and 96% of the simulations were below the reference ICER threshold of $50,000 per QALY gained.
Supplemental Figures 4–6 show the PSA results for individuals ≥12 years old from a societal perspective: 92% of the simulations were in the south-east quadrant and 99% of the simulations were below the reference ICER threshold of $50,000 per QALY gained. The PSA results for individuals ≥12 years old from a payer perspective are presented in Supplemental Figures 7–9: 70% of the simulations were in the south-east quadrant and 96% of the simulations were below the reference ICER threshold of $50,000 per QALY gained.
Discussion
This health economic analysis predicted that, under base case assumptions, booster vaccination with the Pfizer-BioNTech COVID-19 Vaccine, Bivalent in the US population aged ≥5 years would confer considerable health and economic benefits.
The vaccine effectiveness against Omicron infection of the original monovalent COVID-19 vaccines has been shown to wane, but protection against severe illness was more stable and long-lastingCitation6,Citation9,Citation18,Citation25,Citation27,Citation29–31,Citation34. Initial real-world effectiveness US data suggests that the bivalent booster, designed to protect against Omicron, enhances protection relative to no booster vaccinationCitation33,Citation35,Citation36 while being well toleratedCitation9. Our model estimations showed that, relative to no booster vaccination, the bivalent booster could avert over 3.7 million symptomatic cases, over 162 thousand hospitalizations, almost 45 thousand COVID-19-related premature deaths and over 373 thousand QALYs lost. These averted health outcomes were estimated to translate in up to $15.5 billion in net cost savings, considering a societal perspective incorporative of direct costs and productivity losses for the affected individuals.
The base case results were robust to parameter variations. In scenario and sensitivity analyses, the meaning of the results remained largely the same: the Pfizer-BioNTech COVID-19 Vaccine, Bivalent is either cost saving or highly cost-effective in the population aged ≥5 years. The budget impact analysis for a 1-million-member health plan showed that vaccine-related costs were offset by direct cost savings. Similar to prior models of COVID-19 vaccinationCitation11,Citation13,Citation14, the results were most sensitive to inputs related to burden of disease and clinical effectiveness of the vaccine. The model was moderately sensitive to the list price for the population ≥12 years old, however, in sensitivity analysis in this population, a 20% () and a 30% () higher price still led to direct cost savings. It was estimated that, at a threshold of $50,000 per QALY gained, the maximum price for the value of the bivalent booster in the population 12 years and older would be $619 from a societal perspective and $426 from a payer perspective. As such, approximately 70% to 80% of the economically justifiable value of a single booster dose was estimated to be distributed to society and payers.
Using a conservative estimate of $50,000 to value a life year (LY) lost, the model estimated savings of $4.67 for every $1 spent toward vaccination. This estimate is more conservative although directionally consistent with prior studies assessing the return on investment of COVID-19 vaccination. Valuing a LY at $100,000 and using a societal perspective, Sah et al.Citation75 estimated $10.19 savings for every $1 dollar invested in the New York COVID-19 Vaccination campaignCitation75. Using a similar assumption of $100,000 for a LY, the estimate of our model would increase to $6.73 savingsCitation75.
There are limited published data on the public health impact and cost-effectiveness of bivalent booster vaccination, especially during Omicron predominance. Comparison with other published models is limited by different assumptions on model structures and parameters. In a pre-Omicron modeling study, Li et al.Citation14 estimated that booster vaccination with a single booster of the monovalent among US adults aged ≥ 65 years is likely to be cost-effective from a payer perspective. When incorporating broader value elements related to socio-economic activity, Kirson et al.Citation12 estimated that COVID-19 vaccines have the potential to generate some of the largest cost savings in vaccine history. More recently, Pandey et al.Citation15 estimated significant public health impact and direct cost savings from the fall bivalent booster vaccination. Our estimates are substantially lower, likely due to several major design and methodological differences between the studies. For example, Pandey et al.Citation15 captured the impact of the overall COVID-19 vaccination program and used a dynamic transmission framework. A strength of the model included its COVID-19-specific inputs – many of which were age-stratified – from published literature and national surveillance data. Furthermore, the model used conventional model structuresCitation19,Citation20 and aligned to reporting standardsCitation21. While integrating over 600 parameters related to epidemiological, health, economic and humanistic data, the model remained relatively parsimonious and interpretable. The model inputs and assumptions have been documented in detail in the Supplemental Material for transparency and replicability. Outcomes were evaluated from a societal perspective, which provided a comprehensive estimate of quality of life and indirect cost impacts for those infected compared to existing models adopting a payer perspective. Scenario and sensitivity analyses affirmed the robustness of the model and gave context to the base case results. The study showed that the economic case for the Pfizer-BioNTech COVID-19 Vaccine, Bivalent, remains strong in potential endemic commercial settings. With the transition away from the emergency phase characterized by centralized financing and procurement, these findings could be applied to real-world situations to support evaluation processes for healthcare decision makers and healthcare systems. By presenting evidence of benefits, cost-effectiveness and affordability, the study could potentially inform health plans’ projections of the vaccine’s impact on their enrolled population and support financial planning.
The model adopted several assumptions and simplifications to limit model complexity. While parameter uncertainty was tested in sensitivity analyses, other forms of uncertainty (i.e. structural and methodological) were not explicitly tested. Due to limited usable data on the spread of SARS-CoV-2 and the effect of bivalent booster vaccination on transmission, our model simplified the epidemiology dynamics and time-dependent effects in a static structure. Moreover, the model did not assess the potential therapeutic effects of vaccination in reducing the severity of cases, the impact of long COVID, and broader value elements (e.g. spill-over effects, macroeconomic effects). A growing body of evidence recognizes that the COVID-19 pandemic showed that vaccines have benefits and externalities that extend beyond the categories traditionally assessed in health economic evaluations for Health Technology Assessments, and this contributes to a potential systematic under-evaluation of valueCitation77. The incorporation of broader value elements (e.g. in the form of billions of macroeconomic cost savings, as done in prior modelsCitation15) would have substantially increased our estimates. Hence, this parsimonious model framework may have generated conservative estimates. Further studies assessing implementation costs are warranted to improve the understanding of the full resource use associated with the COVID-19 vaccination program. As this analysis used the Pfizer-BioNTech COVID-19 Vaccine, Bivalent as the intervention, results are not generalizable to other vaccines currently approved and authorized in the US, or in other countries. Similarly, the present study did not explicitly capture the effect of different existing or future interventions such as COVID-19 treatments, which may have a synergistic effect in further reducing disease severity. Furthermore, we examined a hypothetical one-year time period in which the vaccine is procured under commercial settings for the entire period with highly conservative booster coverage rates from a prior booster campaign. This makes the vaccine acquisition estimates used in the model conservative when directly applied to Fall/Winter 2022/2023. Due to the absence of granular age-stratified VE data for the bivalent vaccine, VE estimates were assumed to be the same across the age groups, and no further stratification to risk groups was assessed. The findings of this study may not fully reflect current or future disease trends, vaccine clinical profile, healthcare resource use and costs. Future research should leverage the surveillance data that is accumulating during the fall of 2022 and winter of 2022/2023 to retrospectively estimate the impact of the booster campaign. Results are neither generalizable to indications nor to populations not specifically covered in this analysis. The pediatric group was characterized by the highest evidence uncertainty; despite their small impact on the results of this study, future analyses with more updated data are warranted in this group. No subgroup analysis was conducted by ethnicity or socioeconomic status. However, this is an important area of future research. As COVID-19 data continues to rapidly expand and evolve, future studies are warranted to assess the public health impact in additional settings as well as in the longer-term.
Conclusion
This analysis showed that the use of the Pfizer-BioNTech COVID-19 Vaccine, Bivalent booster has the potential to generate notable gains in health outcomes and cost savings among the US population aged ≥5 years old. It supports FDA and CDC recommendations for broad use of the vaccine and highlights the opportunity to continue widespread uptake to prevent COVID-19 related disease and generate substantial societal benefits.
Transparency
Declaration of funding
This study was sponsored by Pfizer Inc.
Declaration of financial/other relationships
MDF, ET, TLW, JY are employees of Pfizer and may hold stock or stock options of Pfizer. KM and BY are employees of Evidera, which received financial support from Pfizer in connection with the study and the development of this manuscript. Peer reviewers on this manuscript have received an honorarium from JME for their review work but have no other relevant financial relationships to disclose.
Author contributions
All named authors meet the International Committee of Medical Journal Editors (ICMJE) criteria for authorship for this article. All authors contributed to study conception and design, data acquisition, analysis, and interpretation, drafting and revising of the manuscript.
Supplemental Material
Download MS Word (1.1 MB)Acknowledgements
The authors acknowledge Mary M Moran and Alejandro Cane (Pfizer, Inc. Employee) for specific contributions to this research project. Assistance with model conceptualization and development and input collection was provided by Ruth Chapman, Gyorgyi Feldmajer, and Cecilia Duan (Evidera). Medical writing was provided by Jacqueline Janowich Wasserott, and Jonathan Pitt (Evidera) and was funded by Pfizer, Inc.
Data availability statement
Aggregate data generated or analyzed during this study are available upon request.
References
- Bell E, Brassel S, Oliver E, et al. Estimates of the global burden of COVID-19 and the value of broad and equitable access to COVID-19 vaccines. Vaccines. 2022;10(8):1320.
- World Health Organization. WHO coronavirus (COVID-19) dashboard; 2022 [cited 2022 Dec 15]. Available from: https://covid19.who.int/table
- Centers for Disease Control and Prevention (CDC). CDC COVID data tracker [cited 2022 Dec 15]. Available from: https://covid.cdc.gov/covid-data-tracker/#datatracker-home
- Cutler DM, Summers LH. The COVID-19 pandemic and the $16 trillion virus. JAMA. 2020;324(15):1495–1496.
- Centers for Disease Control and Prevention (CDC). CDC COVID data tracker: vaccination demographics trends; 2022 [cited 2022 Oct 30]. Available from: https://covid.cdc.gov/covid-data-tracker/
- Rosenblum HG, Wallace M, Godfrey M, et al. Interim recommendations from the advisory committee on immunization practices for the use of bivalent booster doses of COVID-19 vaccines—United States, October 2022. MMWR Morb Mortal Wkly Rep. 2022;71(45):1436–1441.
- US Food and Drug Administration. Coronavirus (COVID-19) update: FDA authorizes Moderna, Pfizer-BioNTech bivalent COVID-19 vaccines for use as a booster dose; 2022 [cited 2022 Oct 30]. Available from: https://www.fda.gov/emergency-preparedness-and-response/coronavirus-disease-2019-covid-19/covid-19-vaccines#:∼:text=The%20FDA%20amended%20the%20emergency,dose%20in%20younger%20age%20groups
- Centers for Disease Control and Prevention. Interim clinical considerations for use of COVID-19 vaccines currently approved or authorized in the United States; 2022 [cited 2022 Dec 15]. Available from: https://www.cdc.gov/vaccines/covid-19/clinical-considerations/covid-19-vaccines-us.html
- Oliver S, editor. Evidence to recommendation framework: bivalent Covid-19 vaccine booster dose. ACIP meeting. CDC. Atlanta, Georgia; 2022.
- Bendix A. Covid booster shots: how to get updated vaccines targeting omicron subvariants (nbcnews.com). NBC News. 2022 [cited 2022 Oct 30]. Available from: https://www.nbcnews.com/health/health-news/covid-booster-shots-updated-target-omicron-ba4-ba5-rcna45893
- Di Fusco M, Marczell K, Deger KA, et al. Public health impact of the Pfizer-BioNTech COVID-19 vaccine (BNT162b2) in the first year of rollout in the United States. J Med Econ. 2022;25(1):605–617.
- Kirson N, Swallow E, Lu J, et al. The societal economic value of COVID-19 vaccines in the United States. J Med Econ. 2022;25(1):119–128.
- Kohli M, Maschio M, Becker D, et al. The potential public health and economic value of a hypothetical COVID-19 vaccine in the United States: use of cost-effectiveness modeling to inform vaccination prioritization. Vaccine. 2021;39(7):1157–1164.
- Li R, Liu H, Fairley CK, et al. Cost-effectiveness analysis of BNT162b2 COVID-19 booster vaccination in the United States. Int J Infect Dis. 2022;119:87–94.
- Pandey A, Shah A, Moghadas SM, et al. How many lives could a Fall COVID-19 booster campaign save in the United States?; 2022 [cited 2022 Oct 30]. Available from: https://www.commonwealthfund.org/blog/2022/how-many-lives-could-fall-covid-19-booster-campaign-save-united-states
- The White House. Statement by President Biden on FDA and CDC authorizing updated COVID-19 vaccines. Washington (DC): The White House; 2022.
- Jarvis L. Covid boosters like flu shots, need a yearly schedule; 2022 [cited 2022 Oct 30]. Available from: https://www.bloomberg.com/opinion/articles/2022-06-01/covid-boosters-like-flu-shots-need-a-yearly-schedule?leadSource=uverify%20wall
- Centers for Disease Control and Prevention. Science brief: SARS-CoV-2 infection-induced and vaccine-induced immunity; 2021 [cited 2022 Oct 30]. Available from: https://www.cdc.gov/coronavirus/2019-ncov/science/science-briefs/vaccine-induced-immunity.html
- Leidner AJ, Chesson HW, Meltzer MI, et al. Guidance for health economics studies presented to the Advisory Committee on Immunization Practices (ACIP); 2019 [updated 2019; cited 2022 Oct 30]. Available from: https://www.cdc.gov/vaccines/acip/committee/downloads/Economics-Guidance-for-ACIP-2019.pdf
- Sanders GD, Neumann PJ, Basu A, et al. Recommendations for conduct, methodological practices, and reporting of cost-effectiveness analyses: second panel on cost-effectiveness in health and medicine. JAMA. 2016;316(10):1093–1103.
- Husereau D, Drummond M, Augustovski F, et al. Consolidated health economic evaluation reporting standards (CHEERS) 2022 explanation and elaboration: a report of the ISPOR CHEERS II good practices task force. Value Health. 2022;25(1):10–31.
- US Census Bureau. National Population by Characteristics: 2010-2020; 2021 [cited 2022 Oct 30]. Available from: https://www.census.gov/programs-surveys/popest/technical-documentation/research/evaluation-estimates/2020-evaluation-estimates/2010s-national-detail.html
- Centers for Disease Control and Prevention. COVID-19 weekly cases and deaths per 100,000 population by age, race/ethnicity, and sex [cited 2022 Oct 30]. Available from: https://covid.cdc.gov/covid-data-tracker/#demographicsovertime
- Akinbami LJ, Kruszon-Moran D, Wang CY, et al. SARS-CoV-2 serology and self-reported infection among adults—national health and nutrition examination survey, United States, August 2021–May 2022. MMWR Morb Mortal Wkly Rep. 2022;71(48):1522–1525.
- Centers for Disease Control and Prevention. Reinfections and COVID-19; 2022 [cited 2022 Oct 30]. Available from: https://www.cdc.gov/coronavirus/2019-ncov/your-health/reinfection.html
- Clarke KEN, Jones JM, Deng Y, et al. Seroprevalence of Infection-Induced SARS-CoV-2 antibodies—United States, September 2021–February 2022. MMWR Morb Mortal Wkly Rep. 2022;71(17):606–608.
- Eythorsson E, Runolfsdottir HL, Ingvarsson RF, et al. Rate of SARS-CoV-2 reinfection during an omicron wave in Iceland. JAMA Netw Open. 2022;5(8):e2225320.
- Mallapaty S. COVID reinfections surge during Omicron onslaught. Nature. 2022. DOI:10.1038/d41586-022-00438-3
- Tartof SY, Slezak JM, Puzniak L, et al. BNT162b2 vaccine effectiveness against SARS-CoV-2 omicron BA.4 and BA.5. Lancet Infect Dis. 2022;22(12):1663–1665.
- Tartof SY, Slezak JM, Puzniak L, et al. Effectiveness and durability of BNT162b2 vaccine against hospital and emergency department admissions due to SARS-CoV-2 omicron Sub-lineages BA.1 and BA.2 in a large health system in the USA: a test-negative, case-control study. Lancet Respir Med. 2022;11(2):176–187.
- Centers for Disease Control and Prevention. Estimated COVID-19 burden; 2022 [cited 2022 October 30]. Available from: https://www.cdc.gov/coronavirus/2019-ncov/cases-updates/burden.html
- Arbel R, Peretz A, Sergienko R, et al. Effectiveness of the bivalent mRNA vaccine in preventing severe COVID-19 outcomes: an observational cohort study. Lancet. 2023. Available from: https://papers.ssrn.com/sol3/papers.cfm?abstract_id=4314067
- Link-Gelles R, Ciesla AA, Roper LE, et al. Early estimates of bivalent mRNA booster dose vaccine effectiveness in preventing symptomatic SARS-CoV-2 infection attributable to omicron BA.5– and XBB/XBB.1.5–related sublineages among immunocompetent adults—increasing community access to testing program, United States, December 2022–January 2023. MMWR Morb Mortal Wkly Rep. 2023;72(5):119–124.
- Surie D, Bonnell L, Adams K, et al. Effectiveness of monovalent mRNA vaccines against COVID-19–associated hospitalization among immunocompetent adults during BA.1/BA.2 and BA.4/BA.5 predominant periods of SARS-CoV-2 omicron variant in the United States—IVY network, 18 states, December 26, 2021–August 31, 2022. MMWR Morb Mortal Wkly Rep. 2022;71(42):1327–1334.
- Surie D, DeCuir J, Zhu Y, et al. Early estimates of bivalent mRNA vaccine effectiveness in preventing COVID-19 associated hospitalization among immunocompetent adults aged ≥65 years - IVY network, 18 states, September 8-November 30, 2022. MMWR Morb Mortal Wkly Rep. 2022;71(5152);1625–1630.
- Tenforde MW, Weber ZA, Natarajan K, et al. Early estimates of bivalent mRNA vaccine effectiveness in preventing COVID-19-Associated emergency department or urgent care encounters and hospitalizations among immunocompetent adults-VISION network, nine states, September-November 2022. MMWR Morb Mortal Wkly Rep. 2022;71(5152):1616–1624.
- DeSilva MB, Mitchell PK, Klein NP, et al. Protection of 2 and 3 mRNA vaccine doses against severe outcomes among adults hospitalized with COVID-19 - VISION network, August 2021 - March 2022. J Infect Dis. 2022;jiac458.
- Gao P, Liu J, Liu M. Effect of COVID-19 vaccines on reducing the risk of long COVID in the real world: a systematic review and meta-analysis. Int J Environ Res Public Health. 2022;19(19):12422.
- Ma Q, Liu J, Liu Q, et al. Global percentage of asymptomatic SARS-CoV-2 infections among the tested population and individuals with confirmed COVID-19 diagnosis: a systematic review and meta-analysis. JAMA Netw Open. 2021;4(12):e2137257.
- Marra AR, Kobayashi T, Suzuki H, et al. The effectiveness of coronavirus disease 2019 (COVID-19) vaccine in the prevention of post-COVID-19 conditions: a systematic literature review and meta-analysis. Antimicrob Steward Healthc Epidemiol. 2022;2(1):e192.
- Notarte KI, Catahay JA, Velasco JV, et al. Impact of COVID-19 vaccination on the risk of developing long-COVID and on existing long-COVID symptoms: a systematic review. EClinicalMedicine. 2022;53:101624.
- Sah P, Fitzpatrick MC, Zimmer CF, et al. Asymptomatic SARS-CoV-2 infection: a systematic review and meta-analysis. Proc Natl Acad Sci U S A. 2021;118(34):e210922918.
- Thompson MG, Yoon SK, Naleway AL, et al. Association of mRNA vaccination with clinical and virologic features of COVID-19 among US essential and frontline workers. JAMA. 2022;328(15):1523–1533.
- Centers for Disease Control and Prevention. Laboratory-confirmed COVID-19-associated hospitalizations [cited 2022 Oct 30]. Available from: https://gis.cdc.gov/grasp/COVIDNet/COVID19_3.html
- Centers for Disease Control and Prevention. New admissions of patients with confirmed COVID-19, United States [cited 2022 Oct 30]. Available from: https://covid.cdc.gov/covid-data-tracker/#new-hospital-admissions
- Taylor CA, Whitaker M, Anglin O, et al. COVID-19–associated hospitalizations among adults during SARS-CoV-2 Delta and omicron variant predominance, by race/ethnicity and vaccination status—COVID-NET, 14 states, July 2021–January 2022. MMWR Morb Mortal Wkly Rep. 2022;71(12):466–473.
- Di Fusco M, Shea KM, Lin J, et al. Health outcomes and economic burden of hospitalized COVID-19 patients in the United States. J Med Econ. 2021;24(1):308–317.
- Nguyen NT, Chinn J, Kirby K, et al. Outcomes of COVID-19 adults managed in an outpatient versus hospital setting. PLoS One. 2022;17(2):e0263813.
- Bull-Otterson L, Baca S, Saydah S, et al. Post–COVID conditions among adult COVID-19 survivors aged 18–64 and ≥65 years—United States, March 2020–November 2021. MMWR Morb Mortal Wkly Rep. 2022;71(21):713–717.
- Centers for Disease Control and Prevention. Long COVID or post-COVID conditions; 2022 [cited 2022 Oct 30]. Available from: https://www.cdc.gov/coronavirus/2019-ncov/long-term-effects/index.html
- O’Mahoney LL, Routen A, Gillies C, et al. The prevalence and long-term health effects of long Covid among hospitalised and non-hospitalised populations: a systematic review and meta-analysis. EClinicalMedicine. 2023;55:101762.
- Perlis RH, Santillana M, Ognyanova K, et al. Prevalence and correlates of long COVID symptoms among US adults. JAMA Netw Open. 2022;5(10):e2238804.
- Chen C, Haupert SR, Zimmermann L, et al. Global prevalence of post-coronavirus disease 2019 (COVID-19) condition or long COVID: a meta-analysis and systematic review. J Infect Dis. 2022;226(9):1593–1607.
- Funk AL, Kuppermann N, Florin TA, et al. Post-COVID-19 conditions among children 90 days after SARS-CoV-2 infection. JAMA Netw Open. 2022;5(7):e2223253.
- Lavery AM, Preston LE, Ko JY, et al. Characteristics of hospitalized COVID-19 patients discharged and experiencing same-hospital readmission - United States March-August 2020. MMWR Morb Mortal Wkly Rep. 2020;69(45):1695–1699.
- DeMartino JK, Swallow E, Goldschmidt D, et al. Direct health care costs associated with COVID-19 in the United States. J Manag Care Spec Pharm. 2022;28(9):936–947.
- Scott A, Chambers R, Reimbaeva M, et al. Real-world retrospective analysis of patient characteristics, healthcare resource utilization, costs, and treatment patterns among unvaccinated adults with COVID-19 diagnosed in outpatient settings in the United States. J Med Econ. 2022;25(1):287–298.
- FairHealth. COVID-19 medical and hospitalization costs: national; 2021 [cited 2022 Oct 30]. Available from: https://s3.amazonaws.com/media2.fairhealth.org/infographic/asset/COVID-19%20Medical%20Hospitalization%20Costs%20by%20State%20-%20FINAL_National.pdf
- Centers for Medicare and Medicaid Services. COVID-19 vaccines and monoclonal antibodies [cited 2022 Oct 30]. Available from: https://www.cms.gov/covid-19-vaccines-and-monoclonal-antibodies
- Pfizer Inc. Pharmaceuticals price list [data on file]. New York: Pfizer Inc.; 2023.
- Klein NP, Shimabukuro T. Safety update of 1st booster mRNA COVID-19 vaccination; 2022 [cited 2022 Oct 30]. Available from: https://www.cdc.gov/vaccines/acip/meetings/downloads/slides-2022-04-20/03-COVID-Klein-Shimabukuro-508.pdf
- Shimabukuro T, Nair N. Allergic reactions including anaphylaxis after receipt of the first dose of Pfizer-BioNTech COVID-19 vaccine. JAMA. 2021;325(8):780–781.
- Healthcare Cost and Utilization Project. Free health care statistics [cited 2022 Oct 30]. Available from: https://hcupnet.ahrq.gov/#setup
- US Bureau of Labor Statistics. Labor force statistics from the current population survey; 2021 [cited 2022 Dec 13]. Available from: https://www.bls.gov/cps/cpsaat03.htm
- US Bureau of Labor Statistics. Table 3. Median usual weekly earnings of full-time wage and salary workers by age, race, Hispanic or Latino ethnicity, and sex, third quarter 2022 averages, not seasonally adjusted [cited 2022 Dec 13]. Available from: https://www.bls.gov/news.release/wkyeng.t03.htm
- Centers for Disease Control and Prevention. Ending isolation and precautions for people with COVID-19: interim guidance; 2022 [cited 2022 Dec 13]. Available from: https://www.cdc.gov/coronavirus/2019-ncov/hcp/duration-isolation.html
- Huang C, Huang L, Wang Y, et al. 6-month consequences of COVID-19 in patients discharged from hospital: a cohort study. Lancet. 2021;397(10270):220–232.
- Kamdar BB, Huang M, Dinglas VD, et al. Joblessness and lost earnings after acute respiratory distress syndrome in a 1-year national multicenter study. Am J Respir Crit Care Med. 2017;196(8):1012–1020.
- Barbut F, Galperine T, Vanhems P, et al. Quality of life and utility decrement associated with Clostridium difficile infection in a French hospital setting. Health Qual Life Outcomes. 2019;17(1):6.
- Di Fusco M, Sun X, Moran MM, et al. Impact of COVID-19 and effects of BNT162b2 on patient-reported outcomes: quality of life, symptoms, and work productivity among US adult outpatients. J Patient Rep Outcomes. 2022;6:123.
- Hamel MB, Phillips RS, Davis RB, et al. Outcomes and cost-effectiveness of ventilator support and aggressive care for patients with acute respiratory failure due to pneumonia or acute respiratory distress syndrome. Am J Med. 2000;109(8):614–620.
- Nakshbandi G, Moor CC, Nossent EJ, et al. Home monitoring of lung function, symptoms and quality of life after admission with COVID-19 infection: the HOMECOMIN’ study. Respirology. 2022;27(7):501–509.
- Sandmann F, Tessier E, Lacy J, et al. Long-term health-related quality of life in non-hospitalised COVID-19 cases with confirmed SARS-CoV-2 infection in England: longitudinal analysis and cross-sectional comparison with controls. Clin Infect Dis. 2022;75(1):e962–e973.
- van Hoek AJ, Underwood A, Jit M, et al. The impact of pandemic influenza H1N1 on health-related quality of life: a prospective population-based study. PLoS One. 2011;6(3):e17030.
- Sah P, Vilches TN, Moghadas SM, et al. Return on investment of the COVID-19 vaccination campaign in New York city. JAMA Netw Open. 2022;5(11):e2243127.
- Briggs A, Sculpher MJ, Claxton K. Decision modelling for health economic evaluation. Oxford: Oxford University Press; 2006.
- Di Fusco M, Mendes D, Steuten L, et al. The societal value of vaccines: expert-Based conceptual framework and methods using COVID-19 vaccines as a case study. Vaccines. 2023;11(2):234.