
Abstract
Background
The short-form 6-dimension (SF-6D) is a preference-based measure designed to calculate quality-adjusted life-year (QALY). Preference-based measures are standardized multidimensional health state classifications with preference or utility weights elicited from a sample of the population. There is a concern that valuations may differ between countries because of differences in culture, thus invalidating the use of values obtained from one country to another.
Objective
To conduct a systematic review of elicitation methods and modeling strategies in SF-6D studies and to present a general comparison of dimensions’ ordering among different countries.
Methods
We performed a systematic review of studies that developed value sets for the SF-6D. The data search was conducted in PubMed, ScienceDirect, Embase, and Scopus up to 8 September 2022. Quality of studies was assessed with the CREATE checklist. Methodological differences were identified, and the dimensions’ ordering of the selected studies was analyzed by cultural and economic factors.
Results
From a total of 1369 entries, 31 articles were selected. This corresponded to 12 different countries and regions and 17 different surveys. Most studies used the standard gamble method to elicit health state preferences. Anglo-Saxon countries gave more importance to pain, while other countries have physical functioning as the highest dimension. As the economic level increases, people care less about physical functioning but more about pain and mental health.
Conclusions
Value sets for the SF-6D are different from one country to another and there is a need to develop value sets for more countries to consider cultural and economic differences.
1. Introduction
Economic methods offer a way to quantify health outcomes, which are becoming integral to the decision-making process in many countriesCitation1. In this setting, preference-based measures (PBM) of health-related quality of life (HRQoL) can be used to generate health state utility values for the calculation of quality-adjusted life year (QALY)Citation1,Citation2. Typically, QALY calculation is based on standardized multidimensional health state classification systems that are associated with country-specific preference weights (also called “tariffs” or “value sets”) elicited from a representative sample of the general populationCitation1.
In the literature, various systematic reviews have contributed to the studies of tools designed to measure QALYs through different aspects such as methodology, history, and experimental tasks. Xie et al.Citation3 compared EQ-5D valuation studies and focused on methodological reports. Devlin and BrooksCitation4 reviewed the history and development of EQ-5D. Mulhern et al.Citation5 conducted a structured review of discrete-choice experiments for health state valuation. In this review, we focused on the SF-6D preference-based measurement and the value sets that were elicited in various countries.
The SF-6D is derived from the Short-Form 36 (SF-36) health survey, which is one of the most widely used HRQoL measures worldwideCitation6. A country-specific value set for SF-6D is currently available in some countries and regions. The original health state classification system SF-6Dv1 comprised six dimensions with four to six levels in each, including physical function (PF), role limitation (RL), social functioning (SF), pain (PN), mental health (MH), and vitality (VT).
In 2020, a new version, the SF-6Dv2 was developed, which has the same six dimensions as the SF-6Dv1, but with five to six levels eachCitation7. In this second version, descriptions changed significantly for all dimensions apart from SF where changes were minimal. As for the SF-6Dv1, the classification system for SF-6Dv2 was derived from the SF-36 and was not restricted to items on both the SF-36 and SF-12Citation8. For details see supplemental Appendix 1.
From Europe, America and Asia, there have been an increased number of value sets, where preferences have been elicited for SF-6Dv1 and SF-6Dv2. On one hand, different survey design features were applied to the health state valuation processes, including different SF-6D versions, administration modes, elicitation methods, number of health states, and sample characteristics. Based on the data collected, researchers also implemented a variety of modeling techniques and regression approaches to estimate health state utilities. On the other hand, even with the same standard survey procedure, and similar modeling techniques, there is a concern that valuations may differ between countries because of differences in culture, economy, or other socio-economic factors. As discussed in KharroubiCitation9, “countries with different population compositions, work, cultures, and language, all of which can impact on the relative values given to different dimensions of health.” In this line, the French jurisdiction Haute Autorité de SantéCitation10 recommends only considering value sets developed in the country in which the economic assessment is to be conducted.
Since the SF-6D is widely used, several country-specific scoring algorithms have been developed, but no general discussion among different countries has been presented. This article aimed to conduct a systematic review of elicitation methods and modeling strategies in SF-6D studies and to present a general comparison of dimensions’ ordering among different countries. We carried out a systematic review of SF-6D studies in the past 25 years and aimed to reach the following objectives: (1) review the current literature relating to the development of SF-6D value sets; (2) provide a detailed summary of the SF-6D methods used to value health states (i.e. similarities and difference in the survey design, the experiment task, and modeling methods); (3) explore the pattern of the value sets between different culture or economy.
2. Methods
2.1. Literature search and criteria
A systematic review was carried out. The search was conducted in PubMed, ScienceDirect, Embase, and Scopus, as well as in the gray literature through the ResearchGate page of John Brazier, inventor of the SF-6D, and the SF-6D webpage hosted by the University of Sheffield. This was done over a period time from the first article published by John BrazierCitation11 up to 8 September 2022. All published studies using the SF-6D (v1 and later v2) to generate value sets were scanned. The search terms were developed by the investigators with the help of a librarian, considering the keywords used to describe the SF-6D and the process of valuation (e.g. six-dimension health state short form, quality-adjusted life-year). A list of key terms and the search strategy are provided in supplemental Appendix 2.
In the first stage, titles and abstracts of articles were screened, and non-relevant articles were excluded. Then, in a second stage, we went through full-text articles for the value sets report. Analyzing the value set was our key target, consequently, articles without a value set were excluded from this systematic review. In this stage, a set of full-text articles were read carefully and assessed for detailed reviews. All articles were deliberately pinned down for the best model that was recommended by the authors. Also, all primary studies were filtered out for the analysis of the survey design. In each stage, the investigators screened articles. Data were extracted by one investigator and checked by another one. In case of disagreement, an arbitration was done by a collaborator.
Articles were included if they used the SF-6D (v1 or v2) to develop or directly inform the production of the value sets for generic or condition-specific preference-based measures. Articles could include any sample (e.g. the general population or patients). Articles were excluded if the value sets were not elicited in the study (e.g. mapping studies). This was because this review aimed to compare value set patterns among different countries. Qualitative studies were also excluded since the focus of the review was to report the econometric methods and models that could be applied for valuation. In several cases, the same datasets were published in multiple articles (e.g. in the original article and later in a comparison article). In this case, the golden rule was still whether new value sets for specific countries were elicited (e.g. using a new modeling method).
2.2. Assessing paper content and quality
Assessment of the quality of the reporting in the articles was guided by the Checklist for Reporting Valuation Studies (CREATE)Citation3. This checklist includes 35 items assessing the key elements that should be reported for health state valuation studies. The valuation generally includes a descriptive system, health states valued, sampling, preference data collection, study sample, modeling, and scoring algorithm. The items were scored either yes or no. As the review focus was on the value sets and scoring algorithms, the included articles were scored by all 35 items (the mean score of the two reviewers is provided).
3. Results
3.1. General study information
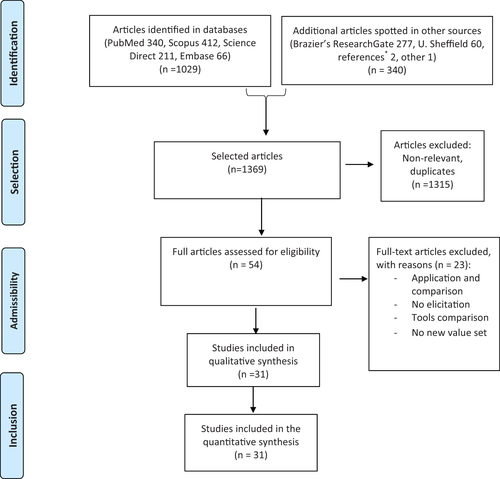
The articles’ selection procedure was presented according to the PRISMA (Preferred Reporting Items for Systematic reviews and Meta-Analyses) flowchartCitation12 which addresses several conceptual and practical advances in the science of systematic reviews. shows a flowchart of the overall literature identification process. The search identified 1369 records. At the title and abstract screening stage, 1315 were excluded since they were irrelevant or duplicates. After this stage, 54 articles were selected for potential inclusion in the review. Following assessment of the full-text articles, a further 23 were excluded as they were not elicitation studies (i.e. no elicitation, no new value set, value set application, or comparison with other instruments; see the list of studies excluded in phase 2 in supplemental Appendix 3). This resulted in 31 articles being included in the review.
Figure 1. PRISMA flowchart up to 8 September 2022. Notes. *References refer to articles that were found from the reference list of the articles included.
reports the characteristics of studies included as well as their quality according to the CREATE checklist. The quality was quoted as good, with a mean score of 27.3 (maximum score of 35). lists the 31 articles in chronological order by year of publication. The year of publication demonstrated that this research field has been consistently explored since the pilot project (1998), the first version v1 (2002), and the last version v2 (2020). Throughout the past 25 years, various surveys from different continents have been conducted, including Europe, America, and Asia. Twenty-seven of 31 samples were from the general population, but other populations were represented in four studies: patients, health professionals, and universityCitation11; university studentsCitation9,Citation33; food-allergic patients or their parentsCitation35. The majority of the articles (n = 18) were primary studies, which originally conducted the SF-6D elicitation survey in one country (region). Among these 18 primary studies, there were only 17 surveys because oneCitation13 used a sub-sample of another oneCitation6 to develop a new value set. Secondary studies (n = 13) included further analytical work on the primary data and methodological comparisons, thus producing new value sets developed from the original dataset.
Table 1. Main characteristics of SF-6D studies.
3.2. Types of designed experiments
reports the key characteristics of the tasks and study designs used in primary studies. One study was conducted for the pilot version (v0) and two for v1 from the SF-12. Ten studies were conducted for the SF-6Dv1, and five for the SF-6Dv2. The majority of designs used “Death,” “Pits,” or “Pits and death” as the reference to anchor the data on a continuum. One studyCitation32 used a balanced range of health-state severities and introduced the net present value (NPV) to estimate QALY.
Table 2. Survey design characteristics in primary studies.
The number of intermediate health states elicited ranged from 49 to about 1000. Such a variation was mainly due to the sample size used that varied from 126 to 3401 respondents. Most studies (70%) were conducted with less than 1000 respondents and only two recent surveysCitation8,Citation38 had above 3000 respondents. The administration mode was mostly face-to-face interviews (61%). However, online surveys became more popular in recent years. One studyCitation35 both collected data from an in-person and online survey. The year of the survey shows that almost every year a new survey was conducted in one country (region).
The most used elicitation method was the standard gamble (SG), followed by the discrete choice experiment (DCE), the DCEtto (i.e. discrete choice experiment with a time duration dimension), and the time trade-off (TTO). Other methods also used by researchers were ranking, DCEtto with death, lottery equivalent (LE), and best-worst scaling (BWS). Supplemental Appendix 4 shows features of elicitation methods among countries (regions).
3.3. Data analysis and modeling
displays the best functional form and modeling approaches used in the studies (as per the authors’ recommendation). Indeed, many studies explored more than one model, and the best model preferred by the authors of these studies was the model that had comparatively the best performance and was pinned down to report the value sets. These best models all corresponded to the main effects during model estimations.
Table 3. Modeling characteristics in SF-6D studies.
Based on the model used, various regression approaches were applied to predict the value sets. Econometric strategies used in these studies were unique or innovative, specially adjusted for certain survey elicitation methods. Generally, they can be categorized as parametric and non-parametric approaches.
The parametric models mainly focused on fixed effects and random effects. Later the parsimonious consistent, mean rescaled, or anchored were added during the model specification. The regression approaches included additive ordinary least squares (OLS)Citation6,Citation18,Citation25,Citation33; constrained OLSCitation13,Citation23; generalized estimating equations (GEE)Citation19,Citation20,Citation22; Probit regressionCitation29; Tobit regressionCitation38; Rank-ordered logistic regression (ROLogit)Citation21; and conditional logistic regressionCitation8,Citation15,Citation37,Citation38.
The other three particular cases for parametric models that are different from the above traditional regression approaches were inverse probability weighted (IPW) adjustedCitation24, Episodic random utility model (ERUM)Citation26,Citation30, and a hybrid regression model combining data from TTO and DCECitation35. Their regression approaches were semi-parametric, stacked probit, and likelihood, respectively.
The non-parametric best models were mainly conducted through the Bayesian method. They included the Bayesian non-parametric model, Beta regression with random effects, and Anchored Hierarchical Bayes model. For this group of models, researchers usually conducted estimates through Markov-Chain Monte-Carlo (MCM). While four comparison studies applied the Bayesian methods, two studies were combining data from the UK with HK and Japan, respectivelyCitation28,Citation31. Note that two other studies used data from the UK as informative prior to estimating HK and Japan value sets, respectivelyCitation9,Citation36.
3.4. Dimensions’ ordering
As stated above, we considered the six-dimension orders based on the best model that was preferred by their authors. Furthermore, we explored the ranks of each dimension in the value sets from the view of culture and economy. To perform a comparison between countries (regions), we needed to pin down one value set respectively as many countries were surveyed more than once. As such, 12 primary studies were selected for the 12 countries (regions) under assessment. The selection criteria were specified in each case to limit heterogeneity in the comparison: the latest version of SF-6D (e.g. UK v2 was selected instead of UK v1); the largest sample size (e.g. the largest sample in HKCitation22 was selected instead of anotherCitation18 as well as for ChinaCitation38 instead of othersCitation37,Citation39); the most widely used elicitation methods were also preferred (e.g. Portugal with SGCitation20 instead of Portugal with RankCitation21; Spain with SGCitation24 instead of Spain with lottery equivalentCitation25; for Lebanon using OLSCitation33 was selected instead of beta regressionCitation34).
3.4.1. Cultural difference
In the literature, there were discussions of how countries could be compared based on common features such as western-eastern countriesCitation38, European-Asian countriesCitation31,Citation36, and cultural or religious differencesCitation33. To explore a comparatively measurable factor, we categorized the countries according to the Anglo-Saxon cultural sphere or not (i.e. other cultural spheres). The Anglosphere is a group of English-speaking (or with common language roots) nations that share common ancestral, historical, or cultural ties with England or the United Kingdom broadly and which today maintain close political, diplomatic, and military co-operation. After categorizing the data as “Anglo-Saxon countries” and “non-Anglo-Saxon countries” (details in ), the dimensions’ orders in the value sets present some obvious patterns.
Table 4. Value set and dimension categorized by culture.
In the Anglo-Saxon countries, all countries have PN (pain) as the most important dimension (i.e. the dimension that is reduced the most in the HRQoL). On the other side, almost all countries (except the USA) have RL (role limitation) as the least important dimension. The USA has RL as its second least dimension, the least dimension being VT (vitality). Also, it is important mentioning that MH (mental health) was frequently second, which was not the case for non-Anglo-Saxon countries.
In the non-Anglo-Saxon countries, almost all countries (except China) have PF (physical functioning) as the highest dimension. However, China has PF as its second-largest dimension while the highest dimension was PN. For all non-Anglo-Saxon countries, RL (role limitation, average 5.4) and VT (vitality, average 4.7) were the least important dimensions.
Our review seemingly indicates a world divided in two between the Anglo-Saxon cultural sphere and the other cultural spheres. In the literature, researchers discussed it from a similar idea such as the English-speaking sphere and countries outside, whether eastern or western countries. For example, native English-speaking people seem to give more importance to pain than countries outside this cultural worldCitation34, and populations of eastern countries may give more weight to PF, while those of western countries may have more preference for MHCitation38. It is also noticed that ChinaCitation38 has the same order of dimensions as AustraliaCitation29. Without focusing on specific statistical tests, this systematic review would discuss it from two directions. One might be related to our selection process. Indeed, another data of ChinaCitation39 that was not selected to represent this country, due to smaller sample size, reported a value set that was not the same as for Australia. In this view, the selection process will be presented later in the discussion section (sensitivity analysis). Another explanation would be that the features of the value set might relate to the growing influence of the Chinese culture in AustraliaCitation40, or maybe that it is more than a cultural difference from the Anglo-Saxon sphere.
3.4.2. Economic and social development
As some researchers who discussed the difference between their studies with other countries’ results, Wu et al.Citation38 mentioned that similarities and distinctions in the ranking of the dimensions may reflect cultural and socioeconomic factors, which are essential in shaping the preferences of populations.
As stated in the culture section, the Anglo-Saxon and non-Anglo-Saxon countries have different results in the order of the most and least important dimensions. However, two countries are somewhat different in their respective group: China and USA. Indeed, China’s most important dimension is Pain (PN), which is the same as in Anglo-Saxon countries; While USA’s least important dimension is Vitality (VT), which is one of the least important dimensions in non-Anglo-Saxon countries. As a consequence, some other factors may be related to these orders.
In this section, we hypothesized that the differences in dimensions’ order would be associated with the country-related economic and social development level. On one hand, the socio-economic development differences may link to the macroeconomic view of government expenditure. For example, Rodriguez and Nieves ValdésCitation41 provided empirical evidence of the existence of a long-run causal relationship between GDP and health care expenditures. On the other hand, from the microeconomic view, individuals would consider how their health might influence their job or income. In this view, Strauss and ThomasCitation42 provided a general discussion about the relationship between income, labor market, and health.
The first economic factor we explored is GDP per capita (see supplemental Appendix 5), the value sets selected present the following results: generally speaking, PF (physical functioning) decreases in the ranking as the economic level increases, while PN (pain) and MH (mental health) increase in ranking as the economic level increases. Specifically, PF (physical functioning) was ranked the most important (ranked 1st) in Lebanon, Portugal, Japan, and Hong Kong, while it was ranked 4.5 (the same as SF) in the Netherlands, which has a comparatively higher GDP per capita. Similarly, SF (social functioning) was ranked 2nd in Lebanon while it was ranked 5.6 (the same as RL) in Canada with a higher GDP per capita. However, For Mental Health (MH), Canada, USA, Netherlands, and Portugal have it in second while Lebanon has it in fourth rank. Among all economic levels, RL (role limitation) was the least or the second least (except for Japan, ranked fourth).
We also tried to study these orders by linking them to other socio-economic factors such as population, health expenditure per capita, life expectancy, and GDP growth. Details were reported in supplemental Appendix 6. When sorted by culture and then by GDP growth (%) in 2017 (prior to COVID-19) (see supplemental Appendix 6 Table A.6.4), the value set orders in non-Anglo-Saxon countries present a clear trend in favor of PF compared to other dimensions in the Anglo-Saxon country group. Within its cultural group, the importance of PF decreases as the GDP growth rate increases. It is, however, noteworthy to mention that this trend is sensitive to economic indicators and years.
4. Discussion
We performed a systematic review of studies that developed value sets for the SF-6D up to September 2022. Methodological differences were identified, and the dimensions’ ordering of the selected studies was analyzed by cultural and economic factors. A total of 31 articles were selected for value set estimation-related analysis, and among them, 17 primary studies were selected for survey design and characteristics summary. This global review covered 12 different countries and regions. To our knowledge, there was no previous review study on SF-6D that has been done in the literature.
In the distribution of values and the size of the coefficients, we discovered two features. One finding was that Anglo-Saxon countries gave more importance to pain, while most non-Anglo-Saxon countries (six out of seven) have physical functioning as the highest dimension. The other finding was that, as the economy increases, people care less about physical functioning but more about pain and mental health.
As indicated in the section on dimensions’ ordering, we filtered 12 studies from the retrieved studies. Studies were selected based on criteria such as the version of the SF-6D, sample size, and elicitation methods. A sensitivity analysis was conducted by replacing the chosen studies with the excluded ones and by reporting how the results would change.
Among these 12 countries, 3 countries had more than two primary studies. The value sets for these three countries were replaced by their alternative for the UKCitation6, Hong KongCitation18, and ChinaCitation39. For PortugalCitation21, SpainCitation25, and LebanonCitation34, researchers developed a second study based on the primary data, these studies may present a different value set and order as a result of applying different models. They were thus selected for the replacement, while the same studies were kept for the remaining countries. Specifically, half of the selected studies were replaced, and the countries (regions) in dark shadow in supplemental Appendix 6 Table A.6.5. were added. This new selection shows that the basic results found in still hold based on the replacement of these available studies.
In Anglo-Saxon countries, when the UK was replaced, as compared to the version that was previously selected, the difference was in the order of VT and SF. Generally, the results were the same as in , with all countries having PN (pain) as the most important dimension, and all countries (except the USA) having RL (role limitation) as the least important dimension.
In the non-Anglo-Saxon countries, all countries except Japan and Brazil were replaced by other studies. However, the results that were reported in still hold. PF (physical functioning) is the highest dimension (except in China). For all non-Anglo-Saxon countries, RL (role limitation, average 5.1) or VT (vitality, average 5.1) were the least important dimensions.
These differences found in dimensions’ ordering might a priori be explained by the difference in the valuation techniques used, the different regression methods and functional forms, or the actual preference differences between nationalities with different cultural and economic backgrounds. Although we attempted to compare studies with common features in survey design and regression methods, studies still have methodological differences, which do not preclude that the differences observed were not due to these features. However, the patterns observed were sufficiently obvious to suggest that cultural and economic differences could be a major factor to explain the differences in dimensions’ ordering and the size of coefficients.
Considering the heterogeneity found in the retrieved studies, we recommend, for the implementation of future studies regarding the development of value sets for the SF-6D, to consider a variety of estimation procedures (e.g. OLS mean, Bayesian, anchored) to help comparison with previous studies, as well as to consider in the design the use of more than one elicitation method (e.g. TTO, DCE, SG). We also recommend producing value sets for countries where this has not been done yet, since cultural differences matter, as highlighted in this review.
This systematic review has limitations. One of these is that we may have missed studies that were not published in the database we retrieved. However, for the search period, we took some measures such as setting a search alarm for keywords in the database, following the SF-6D major authors, and updating the selected articles occasionally up to September 2022, so that we are confident that our search strategy was sufficient to capture most of them.
The value set comparison in this study also has its limitation. Strictly speaking, the summary tables showed that the year of the survey was different, the versions used were mixed, and the elicitation methods were different. Based on the given studies, when selecting the studies for value set comparison, we tried to present studies with the most similarities in terms of methods (e.g. SG, OLS) and versions (e.g. v1 vs. v2).
Another limitation is the representativeness of the sample for the country or region. In this systemic review, we included and described all studies valuing the SF-6D health states from different countries and regions, but some of these studies might not aim to generate a value set for use in their specific country or region so that the study design and the representativeness of the study sample might not be designed for generating national value sets.
Finally, a limitation is related to the instrument used to assess the quality of studies included, the CREATE checklistCitation3, which may not fully capture the risk of reporting biases.
5. Conclusions
This systematic review provided an up-to-date summary of the methodological features in the development of SF-6D value sets. It presented survey design characteristics, modeling characteristics, and survey regions. Moreover, a country representative dataset was selected, and a global value set comparison was presented. Generally, when considering culture and economy, the dimensions’ ordering presented a certain pattern. Anglo-Saxon countries gave more importance to pain than countries outside this cultural world. While most non-Anglo-Saxon countries have physical functioning as the highest dimension. As the economic level increased, people cared less about physical functioning but more about pain and mental health. Besides the summary of survey design and elicitation modeling, these findings could offer some socio-economic features for further research.
Transparency
Declaration of funding
This work was funded through a research fund of the Fondation de l’Institut universitaire en santé mentale de Montréal (IUSMM).
Declaration of financial/other relationships
The funder had no role in the design and conduct of the study; collection, management, analysis, and interpretation of the data; preparation, review, or approval of the manuscript; and decision to submit the manuscript for publication.
Author contributions
Concept and design: TGP
Acquisition of data: TGP, LW
Analysis and interpretation of data: TGP, LW
Drafting of the manuscript: TGP, LW
Critical revision of the paper for important intellectual content: TGP, LW
Statistical analysis: TGP, LW
Obtaining funding: TGP
Administrative, technical, or logistic support: TGP
Supervision: TGP
Reviewer disclosures
Peer reviewers on this manuscript have no relevant financial or other relationships to disclose.
Supplemental Material
Download MS Word (116 KB)Acknowledgements
We would like to present our sincere gratitude to Wilfried Gandji for his contribution to a previous part of this project. TGP is a member of the FRQS-funded Research center of the IUSMM and was a former employee of the CIUSSS de l’Estrie – CHUS.
References
- Brazier J, Ratcliffe J, Tsuchiya A. Measuring and valuing health benefits for economic evaluation. Oxford: oxford University Press; 2017.
- Neumann PJ, Sanders GD, Russell LB, et al. Cost-Effectiveness in health and medicine. New York: Oxford University Press; 2016.
- Xie F, Gaebel K, Perampaladas K, et al. Comparing EQ-5D valuation studies: a systematic review and methodological reporting checklist. Med Decis Making. 2014;34(1):8–20.
- Devlin N, Brooks R. EQ-5D and the EuroQol group: past, present and future. Appl Health Econ Health Policy. 2017;15:127–137.
- Mulhern B, Norman R, Street D, et al. One method, many methodological choices: a structured review of Discrete-Choice experiments for health state valuation. Pharmacoeconomics. 2019;37(1):29–43.
- Brazier J, Roberts J, Deverill M. The estimation of a preference-based measure of health from the SF-36. Journal of Health Economics. 2002;21(2):271–292.
- Brazier JE, Mulhern BJ, Bjorner JB, et al. Developing a new version of the SF-6D health state classification system from the SF-36v2: SF-6Dv2. Med Care. 2020;58(6):557–565.
- Mulhern BJ, Bansback N, Norman R, et al. Valuing the SF-6Dv2 classification system in the United Kingdom using a discrete-choice experiment with duration. Medical Care. 2020;58(6):566–573.
- Kharroubi S. Valuation of preference-based measures: can existing preference data be used to generate better estimates? Health Qual Life Outcomes. 2018;16:116.
- HAS. Guide méthodologique - choix méthodologiques pour l’évaluation économique la HAS. Paris: Haute Autorité de la Santé; 2011.
- Brazier J, Usherwood T, Harper R, et al. Deriving a preference-based single index from the UK SF-36 health survey. J Clin Epidemiol. 1998;51(11):1115–1128.
- Moher D, Liberati A, Tetzlaff J, et al. Preferred reporting items for systematic reviews and meta-analyses: the PRISMA statement. PLoS Med. 2009;6(7):e1000097.
- Brazier JE, Roberts J. The estimation of a preference-based measure of health from the SF-12. Medical Care. 2004;42(9):851–859.
- Kharroubi SA, O’Hagan A, Brazier JE. Estimating utilities from individual health preference data: a nonparametric Bayesian method. J R Stat Soc C. 2005;54:879–895.
- McCabe C, Brazier J, Gilks P, et al. Using rank data to estimate health state utility models. J Health Econ. 2006;25(3):418–431.
- Kharroubi SA, Brazier JE, Roberts J, et al. Modelling SF-6D health state preference data using a nonparametric Bayesian method. J Health Econ. 2007;26:597–612.
- Kharroubi S, Brazier JE, O’Hagan A. Modelling covariates for the SF-6D standard gamble health state preference data using a nonparametric Bayesian method. Soc Sci Med. 2007;64(6):1242–1252.
- Lam C, Brazier J, McGhee S. Valuation of the SF-6D health states is feasible, acceptable, reliable, and valid in a Chinese population. Value Health. 2008;11(2):295–303.
- Brazier JE, Fukuhara S, Roberts J, et al. Estimating a preference-based index from the Japanese SF-36. J Clin Epidemiol. 2009;62(12):1323–1331.
- Ferreira L, Ferreira P, Pereira L, et al. A Portuguese value set for the SF-6D. Value Health. 2010;18(8):1162.
- Ferreira L, Ferreira P, Rowen D, et al. Do Portuguese and UK health state values differ across valuation methods? Qual of Life Res. 2011;20(4):609–619.
- Cruz L, Camey S, Hoffmann J, et al. Estimating the SF-6D value set for a population-based sample of brazilians. Value Health. 2011;14(5 Suppl 1):S108–S14.
- McGhee S, Brazier J, Lam C, et al. Quality-adjusted life years: population-specific measurement of the quality component. Hong Kong Med J. 2011;17(Suppl 6):17–21.
- Méndez I, Abellán Perpiñán J, Sánchez Martínez F, et al. Inverse probability weighted estimation of social tariffs: an illustration using the SF-6D value sets. J Health Econ. 2011;30(6):1280–1292.
- Abellán Perpiñán J, Sánchez Martínez F, Martínez I. Lowering the ‘floor’ of the SF-6D scoring algorithm using a lottery equivalent method. Health Econ. 2012;21(11):1271–1285.
- Craig B, Pickard A, Stolk E, et al. US valuation of the SF-6D. Med Decis Mak. 2013;33(6):793–803.
- Kharroubi S, Brazier J, McGhee S. Modeling SF-6D Hong Kong standard gamble health state preference data using a nonparametric Bayesian method. Value Health. 2013;16(6):1032–1045.
- Kharroubi S, Brazier J, McGhee S. A comparison of Hong Kong and United Kingdom SF-6D health states valuations using a nonparametric Bayesian method. Value Health. 2014;17(4):397–405.
- Norman R, Viney R, Brazier J, et al. Valuing SF-6D health states using a discrete choice experiment. Med Decis Making. 2014;34:773–786.
- Craig B. Unchained melody: revisiting the estimation of SF-6D values. Eur J Health Econ. 2016;17(7):865–873.
- Kharroubi SA. A comparison of Japan and U.K. SF-6D health-state valuations using a non-parametric Bayesian method. Appl Health Econ Health Policy. 2015;13(4):409–420.
- Jonker M, Donkers B, de Bekker-Grob E, et al. Advocating a paradigm shift in Health-State valuations: the estimation of time-preference corrected QALY tariffs. Value Health. 2018;21(8):993–1001.
- Kharroubi S, Beyh Y, Harake M, et al. Examining the feasibility and acceptability of valuing the arabic version of SF-6D in a lebanese population. Int J Environ Res Public Health. 2020;17(3):1037.
- Kharroubi S. Analysis of SF-6D health state utility scores: is beta regression appropriate? Healthcare (Basel). 2020;8(4):525.
- Dufresne É, Poder T, Samaan K, et al. SF-6Dv2 preference value set for health utility in food allergy. Allergy. 2021;76(1):326–338.
- Kharroubi S, Beyh Y. Bayesian modeling of health state preferences: could borrowing strength from existing countries’ valuations produce better estimates. Eur J Health Econ. 2021;22(5):773–788.
- Xie S, Wu J, He X, et al. Do discrete choice experiments approaches perform better than time trade-off in eliciting health state utilities? Evidence from SF-6Dv2 in China. Value Health. 2020;23(10):1391–1399.
- Wu J, Xie S, Chen G, et al. Valuation of SF-6Dv2 health states in China using time trade-off and discrete-choice experiment with a duration dimension. Pharmacoeconomics. 2021;39(5):521–535.
- Osman A, Wu J, He X, et al. Eliciting SF-6Dv2 health state utilities using an anchored best-worst scaling technique. Soc Sci Med. 2021;279:114018.
- “Chinese in Australia” [Online]. Available from: https://culturalatlas.sbs.com.au/chinese-culture/chinese-culture-chinese-in-australia.
- Rodríguez A, Nieves Valdés M. Health care expenditures and GDP in Latin American and OECD countries: a comparison using a panel cointegration approach. Int J Health Econ Manag. 2019;19(2):115–153.
- Strauss J, Thomas D. Health, nutrition, and economic development. J Econ Lit. 1998;36(2):766–817.