
Abstract
Aims
Quantify healthcare resource utilization (HRU) and costs for individuals with late-onset Huntington’s disease (LoHD) and compare these with adult-onset HD (AoHD) and non-HD controls.
Methods
This retrospective cohort study used US healthcare claims data from the IBM MarketScan Commercial and Medicare Supplemental Databases. Individuals newly diagnosed with HD between 1/1/2009 and 12/31/2017 were selected (index date was first HD claim). Individuals ≥60 years of age at the index date were categorized as having LoHD while individuals 21–59 years of age were categorized as having AoHD. Non‑HD controls were exact matched 2:1 to LoHD and AoHD cohorts. Individuals were required to have continuous enrollment for ≥12 months pre- and post-index. Twelve-month all-cause HRU and healthcare costs were assessed for each cohort.
Results
In total, 763 individuals with LoHD and 1,073 individuals with AoHD were matched with 3,762 non-HD controls. Unadjusted all-cause HRU in the 12 months post-index was higher for individuals with LoHD and AoHD compared with non-HD controls across most service categories. Adjusted all-cause HRU for the LoHD cohort was significantly higher compared with non-HD controls across all service categories. In the 12 months post-index, mean total costs for the LoHD cohort ($29,055) were significantly higher than for non-HD controls (≥60 years old: $17,286; 21–59 years old: $12,688; p <.001) and similar to total costs in the AoHD cohort ($31,701; p =.47).
Limitations
It was not possible to control for differences in HD stage but regression models were adjusted for baseline HRU. Evaluations of costs did not include indirect costs, which are known to be significant components of the wider HD burden.
Conclusions
This study provides the first analysis of HRU and costs in LoHD, demonstrating that individuals with LoHD experience a significantly higher healthcare burden compared with non-HD controls and a similarly high burden compared with individuals with AoHD.
PLAIN LANGUAGE SUMMARY
Huntington’s disease (HD) usually develops between the ages of 30–50 but can develop earlier/later. This study looked at healthcare use in people who developed HD at age 60 or later in the United States. Researchers found that people who develop HD at age 60 or later have similar health needs to people with adult-onset HD. Furthermore, they have much greater health needs than people of a similar age who do not have HD.
Introduction
Huntington’s disease (HD) is a rare, genetic and neurodegenerative disease that typically manifests between the ages of 30 and 50 yearsCitation1,Citation2, although onset can also occur during childhoodCitation3, or in later lifeCitation4. HD is characterized by the development of a triad of behavioral, functional/motor and cognitive symptomsCitation2,Citation5. HD leads to increasing levels of disability, loss of independence, and is characterized by a median survival time of 15 years after the initial onset of definitive motor symptomsCitation6. The disability resulting from HD causes significant impacts on health-related quality of life, particularly emotional/physical health and social wellbeingCitation7, with worsening social health problems linked to increased disease burdenCitation8.
Late-onset HD (LoHD), wherein disease onset occurs later in life, is most typically defined by an age of onset of ≥60 yearsCitation9, although some earlier studies use a definition of LoHD as occurring after 50 years of ageCitation10,Citation11. The proportion of individuals with LoHD within the HD population has been reported as 11.5% in a study in GreeceCitation12 to as high as 25.2% in cohorts analyzed in ItalyCitation13 and 25.4% in FinlandCitation14. A recent study using data from the Enroll-HD database found that LoHD represented 11% of cases in a global HD cohortCitation15. Data from the Finnish study demonstrated an increase in the proportion of LoHD cases (out of all new HD diagnoses), from 21% (1991–2000) to 33% (2001–2010)Citation14. Another study, conducted in the USA, suggested an increase in the number of HD diagnoses in individuals ≥60 years of age following the introduction of genetic testingCitation4.
There is currently a paucity of literature describing the LoHD population, and only a few previously published studies focused on the clinical characteristics of LoHD. Individuals diagnosed with HD at an older age are often thought to have slower disease progression with fewer behavioral symptoms than individuals diagnosed at a younger ageCitation16,Citation17. Although LoHD has previously been thought to be a milder form of HD, some recent studies suggest that individuals with LoHD may have similar disease progression to individuals with a typical age onset of HD (referred to as adult-onset HD [AoHD] from hereon)Citation18–20. Furthermore, individuals with LoHD often experience a high burden of illness resulting from manifestations of HD in combination with increasing ageCitation12,Citation18. In fact, individuals with LoHD present more often with gait and balance problems compared with individuals with AoHDCitation12,Citation18.
HD is associated with a high burden of disease, reduced quality of life and high healthcare costsCitation21–24. Management of HD requires a multidisciplinary care approach and in the absence of disease-modifying therapies that can alter disease progression, treatment is focused on the relief of symptoms and improvement of quality of lifeCitation25.
Previous studies using claims databases have reported that individuals with HD have significant healthcare costs that are much greater than for individuals without HD. Average total annual US healthcare costs in 2013 for patients with early- to late-stage HD were estimated to be between $4,947–$22,582 (2011 US dollars [USD]) for commercial patients and $3,257–$37,495 (2011 USD) for those with Medicaid coverageCitation24. A more recent study of Medicare beneficiaries found that mean total healthcare costs for beneficiaries with HD were $41,631 (standard deviation [SD] = $57,393) compared with $17,222 (SD = $31,218) for beneficiaries without HDCitation26. Mean costs per patient per month for patients with HD have been found to be more than double than for patients without HD ($2,260 [SD = $4,682] vs $1,056 [SD = $3,078], 2018 USD)Citation27. Mean total healthcare costs per month were: $3,726 for early-stage HD; $7,988 for middle-stage HD; and $5,125 for late-stage HDCitation28. However, to our knowledge, no studies to date have examined the disease burden specifically in the LoHD population, and little is known about the relative burden of LoHD compared with AoHD.
The objectives of this study were to quantify healthcare resource utilization (HRU) and costs for individuals with LoHD and compare these with individuals with AoHD and individuals without HD, using administrative healthcare claims data from IBM MarketScan databases.
Methods
Study design and data source
This retrospective cohort study used the IBM MarketScan Commercial and Medicare Supplemental Databases from January 1, 2008–December 31, 2018 (study period). The IBM MarketScan databases contain records for over 273 million unique individuals from the USA, including healthcare data from >39.7 million covered people in the most recent year of full dataCitation29.
The IBM MarketScan Commercial database contains employer and health plan medical and pharmacy claims data for >40 million commercial plan members annually. Enrollees include employees, their spouses and their dependents who are covered by employer-sponsored private health insurance. A variety of fee-for-service, fully capitated and partially capitated health plans are represented, including point of service, exclusive provider organizations, preferred provider organization plans, indemnity plans, health maintenance organizations, consumer-driven health plans and high-deductible health plans. The IBM MarketScan Medicare Supplemental database contains data on the Medicare-covered portion of payment (i.e., coordination of benefits amount) and employer expenses and out-of-pocket patient expenses for healthcare services provided in inpatient (IP) and outpatient (OP) settings for US Medicare beneficiaries.
Study population
HD cohorts
We identified individuals with newly diagnosed HD, defined as having ≥1 HD claim (International Classification of Diseases, Ninth/Tenth Revision, Clinical Modification diagnosis codes; ICD‑9‑CM 333.4 – Huntington’s chorea, ICD-10-CM G10 – Huntington’s disease) between January 1, 2009 and December 31, 2017 (identification period), ≥21 years of age at first HD diagnosis (index date was the date of first HD claim) and had no HD claims for 12 months pre-index. Individuals aged ≥21 years at first HD diagnosis were selected, as an age of onset <21 years of age is typically defined as juvenile-onset HDCitation3.
Individuals identified as newly diagnosed with HD were categorized into AoHD and LoHD groups based on their age at the index date. Individuals with HD who were 21–59 years of age at the index date were identified as having AoHD, whereas those ≥60 years of age at the index date were identified as having LoHD.
Matched non-HD controls
Non-HD controls for both the LoHD and AoHD cohorts were identified from a 5% random sample of individuals in the IBM MarketScan databases and were required to have no HD diagnosis throughout the study period. Non-HD controls were randomly assigned a proxy index date from the pool of index dates of the individuals with HD. Non-HD controls were matched 2:1 to the respective HD cohorts as follows: exact matched on age at index, sex, and insurance type (i.e., Commercial vs Medicare), and then propensity score matched using the greedy nearest neighbor approach with 0.25 caliper. Propensity scores were created based on: baseline modified Charlson Comorbidity Index (CCI; modified to exclude dementia as this is highly correlated with HD)Citation30; insurance plan type; geographic region; baseline HRU including inpatient, outpatient, and emergency room (ER) visits (number of visits by each HRU category).
All individuals in both HD cohorts, as well as the two non-HD control groups, were required to have ≥12 months of continuous enrollment in medical and pharmacy benefits pre- and post-index and have no evidence of switching insurance throughout the entire study period.
Study variables and outcomes
Demographic and clinical characteristics
Patient demographic characteristics were assessed at the index date. These baseline demographic characteristics included sex; geographic region; insurance type; insurance plan type; age; follow-up duration; baseline HRU; and baseline modified CCI. HD stage was determined using a previously published hierarchical algorithm that assigns stage based upon specific diagnostic and services claims during the 6-month post-index periodCitation24. Selected HD-related comorbidities and medication use were described during the 12-month post-index period (listed in Supplemental Table 1).
All-cause HRU and costs
All-cause HRU (unadjusted and adjusted) and all-cause healthcare costs were assessed over 12 months post-index for individuals in each cohort. HRU categories included: IP (hospitalizations); OP (physician office, ER, radiology, physical/occupational therapy, speech therapy, durable medical equipment [DME]); long-term care (LTC)/nursing facility (NF)/skilled nursing facility (SNF) (both IP and OP claims); pharmacy.
Healthcare costs represented allowed payments made to providers by insurers (i.e., plan and coordination of benefits) and patients (i.e., copay, co-insurance, deductible), and were adjusted to 2020 USD using the medical component of the US Consumer Price IndexCitation31. Patients with capitated health plans (i.e., health maintenance organizations, point of service with capitation) were excluded from all cost analyses.
Statistical analysis
Patient demographics and baseline characteristics were summarized using descriptive statistics. Baseline characteristics of individuals with HD were descriptively compared with matched non-HD controls using standardized mean differences (SMDs). Unadjusted HRU was descriptively summarized using counts and percentages and compared across HD groups and non-HD control groups using chi-squared tests.
Two-part multivariable regression models were used to estimate predicted adjusted mean all-cause HRU and costs, to account for excess zeros in modeling HRU and costsCitation32. For the two-part multivariable regression models for adjusted all-cause HRU, logistic regression was used for the binomial component and a generalized linear model with negative binomial distribution and log-link function was used for the continuous component. In the two-part multivariable regression models for adjusted 12-month all-cause healthcare costs, logistic regression was used for the binomial component and a generalized linear model with gamma distribution and log-link was used for the continuous component. Models with dummy variables created for each HD and control group (reference group: LoHD) and adjusted for sex, insurance type, modified CCI, and baseline HRU [IP, OP, ER] were used to derive the parameter estimates for all-cause HRU and predicted mean costs for individuals with LoHD, AoHD and both non-HD control groups during the 12-month post-index period. For estimating total healthcare costs (sum of IP, OP and pharmacy costs), a two-part model was not used since all individuals with HD had non-zero total healthcare costs. R v4.0.0 and STATA v15 were used for all statistical analyses, and all p values <.05 or SMD >0.1 were considered statistically significant.
Results
Demographic and clinical characteristics
A total of 1,836 individuals meeting the study criteria of newly diagnosed with HD were included in this analysis and were matched with 3,762 non-HD controls. Of the individuals with HD, 42% (n = 763) were categorized as having LoHD and 58% (n = 1,073) as having AoHD (). Baseline characteristics were well balanced across all HD and respective non-HD control cohorts (SMD <0.1; ).
Figure 1. Identification of study population with LoHD and AoHD in the IBM MarketScan database. Abbreviations. AoHD, adult-onset HD; HD, Huntington’s disease; LoHD, late-onset HD.
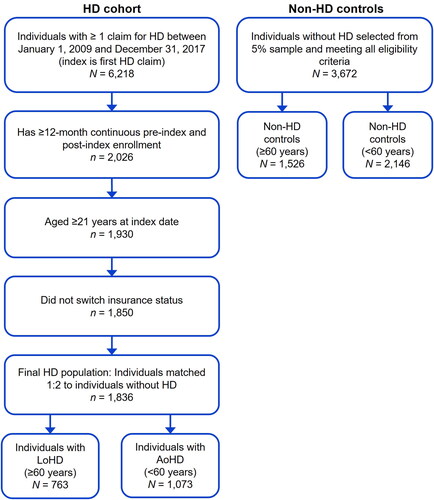
Table 1. Demographic and clinical characteristics.
The median (interquartile range) age at the index for individuals in the LoHD cohort was 70 (63–77) years and 50 (42–55) years for the AoHD cohort (). Overall, 56.5% and 55.1% of the LoHD and AoHD cohorts were female, respectively. The mean (SD) CCI score at baseline for individuals with LoHD was 1.5 (2.1) and 0.6 (1.4) for individuals with AoHD. Most individuals in the LoHD cohort had Medicare Supplemental insurance (67.1%), whereas nearly all individuals with AoHD had commercial insurance coverage (98.8%).
In the LoHD cohort, there was a similar number of individuals with early- (249 [32.6%]), middle- (262 [34.3%]) and late-stage HD (252 [33.0%]). In the AoHD cohort, most individuals had early-stage HD (539 [50.2%]), followed by middle-stage HD (375 [34.9%]) and late-stage HD (159 [14.8%]) (). The most common comorbidities in individuals with LoHD and AoHD were depression (28.0% vs 30.8%), anxiety (17.3% vs 21.5%) and gait/balance problems (22.9% vs 11.4%), respectively, which were all more common in individuals with HD than the matched non-HD controls. Psychiatric comorbidities, including depression and anxiety, were most common in individuals with AoHD, while motor and cognitive symptoms, including gait/balance problems, dementia and falls were more common among those with LoHD.
Unadjusted all-cause HRU
The percentage of individuals with unadjusted all-cause HRU in the 12 months post-index was higher for individuals with LoHD and AoHD compared with the respective non-HD controls across most service categories, and this difference was statistically significant for all categories except physician office visits and the pharmacy fills between the LoHD cohort and non-HD controls (). The most common HRU service categories for individuals with LoHD and AoHD were any pharmacy fills, physician office visits, ER visits and PT/OT visits ().
Table 2. Unadjusted all-cause HRU in the 12-month post-index period.
Selected medication use
Medication use, particularly the use of psychiatric medications, was higher among individuals with LoHD and AoHD compared with the respective non-HD controls across all HD-related drug classes included in this analysis (). In both the HD cohorts (LoHD, AoHD), the most common medications were antidepressants (50.9% vs 54.1%), benzodiazepines (32.4% vs 33.7%) and antipsychotics (29.5% vs 25.3%), respectively ().
Predicted adjusted mean all-cause HRU
Predicted adjusted mean all-cause HRU was significantly higher in individuals with LoHD compared with non-HD controls for all service categories (p <.05 for all, ). Directly comparing HRU between the LoHD and AoHD cohorts across the various service categories showed some non-statistically significant differences in adjusted healthcare utilization between the two patient populations. The AoHD cohort had higher mean inpatient use (2.35 vs 1.92), including hospitalizations (2.26 vs 1.87), as well as slightly higher mean radiology visits (0.51 vs 0.39), DME claims (1.65 vs 1.48) and LTC/NF/SNF use (2.23 vs 1.83), respectively, but none of these comparisons were statistically significant. Adjusted mean ER visits were significantly lower among individuals with LoHD compared with those with AoHD (0.71 vs 0.96, p = .029).
Table 3. Predicted adjusted mean all-cause HRU in the 12-month post-index period.
Predicted adjusted mean all-cause healthcare costs
During the study period, adjusted healthcare costs were higher across all measured service categories for individuals with LoHD compared with all non-HD controls, and this difference was statistically significant for all categories (p <.05) except for inpatient visits, hospitalizations and DME use (). Adjusted healthcare costs among individuals with LoHD were similar to those of individuals with AoHD across all service categories. Total annual all-cause healthcare costs for individuals with LoHD were $29,055, which were significantly higher than non-HD controls ($17,286, p <.001), and similar to individuals with AoHD ($31,701, p = .47) ().
Table 4. Predicted adjusted mean all-cause healthcare costs in the 12-month post-index period (2020 USD).
Among individuals with HD, the highest costs were attributable to OP services ($12,143 for LoHD and $13,657 for AoHD), followed by pharmacy fills ($7,835 for LoHD and $9,694 for AoHD) and IP visits ($6,071 for LoHD and $7,151 for AoHD) ().
Discussion
To our knowledge, this is the first study to investigate the real-world HRU and healthcare costs among individuals newly diagnosed with LoHD compared with non-HD controls and individuals newly diagnosed with AoHD. In this study we address this research gap using a large retrospective claims data analysis, which demonstrates the significant HRU and cost burden among individuals newly diagnosed with LoHD.
The most common symptoms in individuals newly diagnosed with LoHD were motor and cognitive impairments, whereas behavioral comorbidities were most common among individuals with AoHD. These findings are consistent with previous studies describing differences in clinical characteristics of individuals with LoHD versus individuals with AoHD. Similar to our study, previous studies have reported that individuals with LoHD more often present with gait and balance symptoms compared with individuals with AoHDCitation12,Citation18. This may be attributed to balance and gait problems associated with the increased age at diagnosis in combination with age-related disorders such as arthritisCitation18. Furthermore, a lower burden of behavioral symptoms in LoHD compared with AoHD could be due to the higher prevalence of severe behavioral symptoms, such as depression and substance abuse, observed in early-stage disease and in individuals diagnosed at a younger ageCitation15,Citation16. However, the differences in the predominant symptoms between the LoHD and AoHD cohorts in this claims analysis could indicate differences in disease presentation between the two patient populations that could be explored by future research.
A high proportion of patients newly diagnosed with LoHD were classified as having middle- or late-stage HD, which might indicate late diagnoses in this patient population. This may be due to the perception that there is a low likelihood of HD in patients >60 years of ageCitation9. Additionally, heterogeneity in symptoms at disease presentation, as well as a negative family history of HD which is common among individuals with LoHD, may further contribute to under-awareness of the condition and delayed diagnosis in this populationCitation18.
Our study demonstrated that the HRU burden in individuals with LoHD was significant and comparable to the burden among individuals with AoHD. The high HRU burden in LoHD supports the findings of previous HD studies which have demonstrated similar disease progression in LoHD compared with AoHDCitation12,Citation13. Koustis et al. reported that the prognosis of LoHD was no better than that of AoHD and may even be worseCitation12, while Volpi et al. have recently demonstrated similar clinical performance between individuals with LoHD and AoHD at baseline and during follow-up visitsCitation13.
For both HD cohorts, the unadjusted all-cause HRU burden was higher compared with matched non-HD controls. For all services categories, adjusted HRU in the LoHD cohort was significantly higher than in non-HD controls, and similar to those with AoHD except for ER visits. The adjusted mean number of ER visits in the LoHD cohort was significantly lower than in the AoHD cohort, although still significantly higher compared with the respective matched control group. The exact reasons for the lower adjusted mean number of ER visits in the LoHD cohort compared with the AoHD cohort are unclear, but it is worth noting that the ER usage in non-HD controls ≥60 years of age was lower than in non-HD controls <60 years of age. One possible explanation for this unexpected reduction of ER visits in older individuals could be due to the increased likelihood of hospitalization in these cohorts.
There is a significant cost burden of HD on individuals and the US healthcare system. The adjusted mean annual direct healthcare costs in this study of ∼$30,000 per year for AoHD and LoHD are comparable with previous studies, such as Divino et al. which reported costs ranging from $3,257–$37,495 depending on disease stage and insurance type in 2011 USD ($4,278–$49,244 in 2020 USD)Citation24. However, Divino et al. limited their analysis to individuals with commercial and Medicaid insurance (mean age: 48–49 years) thus including individuals with typical onset HD with higher disability which may explain the higher costs reported in their study.
Two newer studies using more recent claims data reported similar healthcare costs to those recorded in this study. A recent study comparing costs between HD and non-HD populations reported per patient monthly costs of $2,260 (2018 USD, equivalent to an annual cost of $28,927 in 2020 USD)Citation27, while an analysis of healthcare costs in different stages of HD reported mean monthly costs across HD cohorts of $2,889 (2018 USD, $36,978 annualized in 2020 USD)Citation28.
In our study, adjusted healthcare costs were significantly higher in the LoHD cohort compared with both non-HD cohorts. Healthcare costs for patients with LoHD were comparable to patients with AoHD, with no significant differences observed in overall costs or for any of the healthcare categories analyzed. Total costs were significantly higher (∼2-fold higher) in the LoHD cohort compared with non-HD controls, and higher across all service categories, with significant differences for most categories. The majority of costs were attributed to OP visits ($12,143 [42% of the total costs] in LoHD and $13,657 [43% of the total costs] in AoHD), followed by pharmacy fills ($7,835 [27%] and $9,694 [31%], respectively). No previous studies have examined HRU and cost differences between LoHD and AoHD; however, a few prior analyses have examined the differences in HRU and costs by service categories among those with HD and without HDCitation24,Citation33. The proportion of costs attributable to outpatient services is similar to previous studiesCitation24,Citation27,Citation28. Higher adjusted outpatient costs among those with HD are a reflection of the multidisciplinary nature of care required in the management of HDCitation34.
Limitations
This study has limitations that should be considered when assessing these findings. First, there are several limitations that are inherent in claims-based analyses. Data recorded in claims databases are primarily intended for billing purposes and may be subject to coding errors that may impact the validity of the findingsCitation35. Second, these results may not be generalizable beyond the study population, as data used in this analysis were limited to individuals covered with a US Commercial insurance plan or Medicare supplemental insurance plan in MarketScan databases and did not include individuals with other types of insurance such as Medicaid. These data are limited to the US healthcare system, and thus may not translate directly to other parts of the world where community-based care is more common, but the direction of the result is expected to be the same. Thirdly, only a single HD claim was required for patients to be included in this study. Although this approach has been used by prior studies of HRU in HDCitation24,Citation36,Citation37, and the rate of misdiagnosis is expected to be low due the availability of genetic testing and health insurance implications, the final cohort may contain beneficiaries with a misdiagnosis of HD which could potentially result in underestimating the disease burden and costs to the healthcare system. In addition, individuals were identified as newly diagnosed with HD based upon no HD claims in the 12 months pre-index, so it is possible some individuals may have been included in the final study cohort who were not truly new diagnoses. Limited follow-up times are characteristic of claims database analyses, and these may be a particular limitation in studies of HD, since the progressive nature of the disease may mean that patients drop off their insurance plan before the full extent of HRU and cost burden are captured.
We were unable to control for differences in HD disease stage between individuals with LoHD and AoHD in multivariable models for adjusted HRU and costs. As our study examined individuals with newly diagnosed HD, the HD stage was measured in the post‑index period, and multivariable adjustment on post-index variables following exposure may result in biasCitation38. Multivariable models were adjusted for baseline HRU, which was used as a proxy for baseline health status and may not fully measure the true health status. Non-HD controls were matched to the HD cohorts on baseline CCI and HRU. This matching approach may have selected for a non-HD cohort that may be sicker than the general population and this may have resulted in an underestimation of the true burden of HD.
Approximately 50% of individuals with AoHD were 50–59 years of age at the index date of HD diagnosis, who may have similar characteristics to individuals with LoHD. It is not clear why the age characteristics of the AoHD cohort in this study tend towards the older end of the typical age of HD onset, but the costs and HRU in this group of individuals 50–59 years of age at onset may mask differences between the AoHD and LoHD cohorts.
Indirect costs due to loss of productivity or caregiving costs were not estimated, which are known to be a significant component of the burden of HD on a wider level, especially in terms of informal care costsCitation33. If indirect costs were measured, there might be a greater burden of AoHD which typically impacts individuals during the peak of their career when earning potential is highest (35–54 years of age)Citation39.
Finally, LTC, NF and SNF care may not be fully captured in claims data since these types of services are generally excluded from commercial insurance coverage and Medicare does not cover SNF care beyond 100 dCitation40. As a result, HRU and the cost burden reported here may be underestimated due to not fully capturing care costs, particularly among individuals with late-stage disease or the institutionalized LoHD population.
Conclusions
To the best of our knowledge, this is the first study to investigate the differences in HRU and costs in individuals with LoHD compared with individuals without HD and to further contextualize these differences by comparison with individuals with AoHD. We found that individuals with LoHD had a similar HRU and cost burden to individuals with AoHD, which was significantly higher than those without HD. These findings further establish the disease burden in HD and highlight a significant unmet medical need in the LoHD population.
Transparency
Author contributions
TMT: Research project conception and organization; statistical analysis design and review/critique; and manuscript review/critique; final approval of the version to be published; and agree to be accountable for all aspects of the work.
JTT: Review/interpretation of study findings, drafting of paper or revising it critically for intellectual content; final approval of the version to be published; and agree to be accountable for all aspects of the work.
AMP: Involved in the interpretation of the data; the drafting of the paper or revising it critically for intellectual content; final approval of the version to be published; and agree to be accountable for all aspects of the work.
SA: Involved in the interpretation of the data; the drafting of the paper or revising it critically for intellectual content; final approval of the version to be published; and agree to be accountable for all aspects of the work.
IMA: Study conception, design; and interpretation of the results; final approval of the version to be published; and agree to be accountable for all aspects of the work.
RG: Involved in the interpretation of the data; the drafting of the paper or revising it critically for intellectual content; final approval of the version to be published; and agree to be accountable for all aspects of the work.
Reviewer disclosures
A reviewer on this manuscript has disclosed that they receive funding for their research and meeting attendance as well as sponsorship by pharmaceutical companies, however, none of it is relevant to this article review. Peer reviewers on this manuscript have no other relevant financial relationships or otherwise to disclose.
Supplemental Material
Download MS Word (26.3 KB)Acknowledgements
The authors thank Jack Curran, PhD, of Chrysalis Medical Communications, for providing medical writing support, which was funded by F. Hoffmann-La Roche Ltd, in accordance with Good Publication Practice (GPP 2022) guidelines (http://www.ismpp.org/gpp-2022).
Some of the results from this study have previously been presented as a poster at MDS (2021) 25th International Congress of Parkinson’s Disease and Movement Disorders; 17–22 September 2021.
Declaration of funding
This study was funded by Genentech Inc. Medical writing support was funded by F. Hoffmann-La Roche Ltd, in accordance with Good Publication Practice (GPP 2022) guidelines (http://www.ismpp.org/gpp-2022). The study sponsor was involved with the study design, analysis, and interpretation of data; writing of the manuscript; and the decision to publish the article.
Declaration of financial/other interests
TMT: Employment and stock options with Genentech.
JTT: Employment with Genentech (at time of study) and stock options with Roche.
AMP: Employment and stock options with Roche/Genentech.
SA: Employment with Genesis Research (at time of study) who? received consulting fees from Genentech/Roche.
IMA: Employment and stock options with Genentech.
RG: Employment and stock options with Genentech.
When this work was conducted, TMT, JTT, AMP, IMA and RG were employees of Genentech Inc, and SA was an employee of Genesis Research.
References
- Bates GP, Dorsey R, Gusella JF, et al. Huntington disease. Nat Rev Dis Primers. 2015;1:15005. doi: 10.1038/nrdp.2015.5.
- Roos RA. Huntington’s disease: a clinical review. Orphanet J Rare Dis. 2010;5(5):40. doi: 10.1186/1750-1172-5-40.
- Quarrell OWJ, Nance MA, Nopoulos P, et al. Managing juvenile Huntington’s disease. Neurodegener Dis Manag. 2013;3(3):267–276. doi: 10.2217/nmt.13.18.
- Lipe H, Bird T. Late onset huntington disease: clinical and genetic characteristics of 34 cases. J Neurol Sci. 2009;276(1–2):159–162. doi: 10.1016/j.jns.2008.09.029.
- Ross CA, Aylward EH, Wild EJ, et al. Huntington disease: natural history, biomarkers and prospects for therapeutics. Nat Rev Neurol. 2014;10(4):204–216. doi: 10.1038/nrneurol.2014.24.
- Keum JW, Shin A, Gillis T, et al. The HTT CAG-expansion mutation determines age at death but not disease duration in huntington disease. Am J Hum Genet. 2016;98(2):287–298. doi: 10.1016/j.ajhg.2015.12.018.
- Carlozzi NE, Tulsky DS. Identification of health-related quality of life (HRQOL) issues relevant to individuals with huntington disease. J Health Psychol. 2013;18(2):212–225. doi: 10.1177/1359105312438109.
- Carlozzi NE, Boileau NR, Hahn EA, et al. Responsiveness to change over time: an examination of the Neuro-QoL social function measures in persons with huntington’s disease. J Huntingtons Dis. 2020;9(1):83–97. doi: 10.3233/JHD-190385.
- Chaganti SS, McCusker EA, Loy CT. What do we know about late onset huntington’s disease? J Huntingtons Dis. 2017;6(2):95–103. doi: 10.3233/JHD-170247.
- Myers RH, Sax DS, Schoenfeld M, et al. Late onset of huntington’s disease. J Neurol Neurosurg Psychiatry. 1985;48(6):530–534. doi: 10.1136/jnnp.48.6.530.
- Foroud T, Gray J, Ivashina J, et al. Differences in duration of huntington’s disease based on age at onset. J Neurol Neurosurg Psychiatry. 1999;66(1):52–56. doi: 10.1136/jnnp.66.1.52.
- Koutsis G, Karadima G, Kladi A, et al. Late-onset huntington’s disease: diagnostic and prognostic considerations. Parkinsonism Relat Disord. 2014;20(7):726–730. doi: 10.1016/j.parkreldis.2014.03.017.
- Volpi E, Terenzi F, Bagnoli S, et al. Late-onset huntington disease: an italian cohort. J Clin Neurosci. 2021;86:58–63. doi: 10.1016/j.jocn.2020.12.025.
- Sipilä JOT, Kauko T, Päivärinta M, et al. Comparison of mid-age-onset and late-onset huntington’s disease in Finnish patients. J Neurol. 2017;264(10):2095–2100. doi: 10.1007/s00415-017-8600-2.
- Ranganathan M, Kostyk SK, Allain DC, et al. Age of onset and behavioral manifestations in Huntington’s disease: an Enroll-HD cohort analysis. Clin Genet. 2021;99(1):133–142. doi: 10.1111/cge.13857.
- Kwa L, Larson D, Yeh C, et al. Influence of age of onset on Huntington’s disease phenotype. Tremor Other Hyperkinet Mov. 2020;10:21. doi: 10.5334/tohm.536.
- Anil M, Mason SL, Barker RA. The clinical features and progression of late-onset versus younger-onset in an adult cohort of Huntington’s disease patients. J Huntingtons Dis. 2020;9(3):275–282. doi: 10.3233/jhd-200404.
- Oosterloo M, Bijlsma EK, van Kuijk SM, et al. Clinical and genetic characteristics of late-onset Huntington’s disease. Parkinsonism Relat Disord. 2019;61:101–105. doi: 10.1016/j.parkreldis.2018.11.009.
- Ma X, Gandhy R, Lu X, et al. editors. Clinical characteristics of late-onset Huntington’s disease in North Americans from Enroll-HD. 15th Annual Huntington’s Disease Therapeutics Conference; 2020; Palm Springs, CA, USA.
- Capiluppi E, Romano L, Rebora P, et al. Late-onset Huntington’s disease with 40-42 CAG expansion. Neurol Sci. 2020;41(4):869–876. doi: 10.1007/s10072-019-04177-8.
- Hawton A, Green C, Goodwin E, et al. Health state utility values (QALY weights) for Huntington’s disease: an analysis of data from the European Huntington’s Disease Network (EHDN). Eur J Health Econ. 2019;20(9):1335–1347. doi: 10.1007/s10198-019-01092-9.
- Paoli RA, Botturi A, Ciammola A, et al. Neuropsychiatric burden in Huntington’s disease. Brain Sci. 2017;7(12):67. doi: 10.3390/brainsci7060067.
- Thorley EM, Iyer RG, Wicks P, et al. Understanding how chorea affects health-related quality of life in Huntington disease: an online survey of patients and caregivers in the United States. Patient. 2018;11(5):547–559. doi: 10.1007/s40271-018-0312-x.
- Divino V, Dekoven M, Warner JH, et al. The direct medical costs of Huntington’s disease by stage. A retrospective commercial and Medicaid claims data analysis. J Med Econ. 2013;16(8):1043–1050. doi: 10.3111/13696998.2013.818545.
- Bachoud-Levi AC, Ferreira J, Massart R, et al. International guidelines for the treatment of Huntington’s disease. Front Neurol. 2019;10:710. doi: 10.3389/fneur.2019.00710.
- Exuzides A, Reddy SR, Chang E, et al. Healthcare utilization and cost burden of Huntington’s disease among medicare beneficiaries in the United States. J Med Econ. 2021;24(1):1327–1336. doi: 10.1080/13696998.2021.2002579.
- To TM, Exuzides A, Abbas IM, et al. Healthcare resource utilization and costs among individuals with versus without Huntington’s disease in a US population. J Manag Care Spec Pharm. 2022;28(11):1228–1239.
- Exuzides A, To TM, Abbass IM, et al. Healthcare resource utilization and costs in individuals with Huntington’s disease by disease stage in a US population. J Med Econ. 2022;25(1):722–729. doi: 10.1080/13696998.2022.2076997.
- IBM Watson Health. IBM MarketScan research databases white paper for life sciences researchers. 2020 [cited 2022 October 28]. Available from: https://www.ibm.com/products/marketscan-research-databases/resources.
- Julayanont P, McFarland NR, Heilman KM. Mild cognitive impairment and dementia in motor manifest Huntington’s disease: classification and prevalence. J Neurol Sci. 2020;408:116523. doi: 10.1016/j.jns.2019.116523.
- U.S. Bureau of Labor Statistics. Measuring price change in the CPI: medical care. 2020 [cited 2022 October 28]. Available from: https://www.bls.gov/cpi/factsheets/medical-care.htm.
- Neelon B, O'Malley AJ, Smith VA. Modeling zero-modified count and semicontinuous data in health services research part 1: background and overview. Stat Med. 2016;35(27):5070–5093. doi: 10.1002/sim.7050.
- Jones C, Busse M, Quinn L, et al. The societal cost of Huntington’s disease: are we underestimating the burden? Eur J Neurol. 2016;23(10):1588–1590. doi: 10.1111/ene.13107.
- Frich JC, Rae D, Roxburgh R, et al. Health care delivery practices in Huntington’s disease specialty clinics: an international survey. J Huntingtons Dis. 2016;5(2):207–213. doi: 10.3233/JHD-160192.
- Johnson EK, Nelson CP. Values and pitfalls of the use of administrative databases for outcomes assessment. J Urol. 2013;190(1):17–18. doi: 10.1016/j.juro.2013.04.048.
- Anderson KE, Divino V, DeKoven M, et al. Interventional differences among Huntington’s disease patients by disease progression in commercial and medicaid populations. J Huntingtons Dis. 2014;3(4):355–363. doi: 10.3233/jhd-140124.
- Sung VW, Iyer RG, Gandhi SK, et al. Retrospective analysis of healthcare resource use, treatment patterns, and treatment-related events in patients with Huntington’s disease–associated chorea initiated on tetrabenazine. J Health Econ Outcomes Res. 2018;6(1):15–24. doi: 10.36469/9779.
- Schisterman EF, Cole SR, Platt RW. Overadjustment bias and unnecessary adjustment in epidemiologic studies. Epidemiology. 2009;20(4):488–495. doi: 10.1097/EDE.0b013e3181a819a1.
- Mentzel T, Lieverse R, Levens A, et al. Reliability and validity of an instrument for the assessment of bradykinesia. Psychiatry Res. 2016;238:189–195. doi: 10.1016/j.psychres.2016.02.011.
- di Biase L, Summa S, Tosi J, et al. Quantitative analysis of bradykinesia and rigidity in Parkinson’s disease. Front Neurol. 2018;9:121. doi: 10.3389/fneur.2018.00121.