
 ?Mathematical formulae have been encoded as MathML and are displayed in this HTML version using MathJax in order to improve their display. Uncheck the box to turn MathJax off. This feature requires Javascript. Click on a formula to zoom.
Abstract
Aim
To estimate the health economic impact of undertaking urine albumin-to-creatinine ratio (UACR) testing versus no UACR testing in early stages of chronic kidney disease (CKD) progression in patients with type 2 diabetes (T2D).
Methods
An economic model, taking a UK healthcare system perspective, estimated the impact of UACR testing on additional costs, clinical benefits measured as prevented dialyses and cardiovascular-related deaths, life years gained (LYg), LYg before kidney failure, and incremental cost-effectiveness ratio (ICER). Sixteen of the 18 Kidney Disease: Improving Global Outcomes (KDIGO) heatmap categories were considered separately, and grouped in health states according to CKD risk. Results were derived for current standard-of-care and emerging CKD therapies.
Results
The cohort that adhered to both UACR and estimated glomerular filtration rate (eGFR) testing guidelines in early stages of CKD (n = 1000) was associated with approximately 500 LYg before kidney failure onset; costing approximately £2.5 M. ICERs across the KDIGO heatmap categories were approximately £5,000.
Limitations
This model used data from a comprehensive meta-analysis that was initiated more than 10 years ago (2009). While this was the most comprehensive source identified, recent changes in the treatment landscape, patient population and social determinants of CKD will not be captured. Furthermore, a narrow approach was taken, aligning included costs with UK NHS reference materials. This means that some direct and indirect drivers of costs in late-stage disease have been excluded.
Conclusions
UACR testing in the early stages of CKD is cost effective in T2D patients. Emerging therapies with the potential to slow CKD progression, mean that optimal monitoring through UACR/eGFR testing will become increasingly important for accurate identification and timely treatment initiation, particularly for the highest-risk A3 category.
Introduction
Chronic kidney disease (CKD) is a progressive disease defined by persistent urine abnormalities, structural abnormalities, or impaired excretory kidney function, which is suggestive of functional nephron loss. Type 2 diabetes (T2D) is a strong risk factor for CKD, and patients with CKD are at increased risk of cardiovascular disease and deathCitation1. As CKD progresses to more advanced stages, such as kidney failure and the requirement for kidney transplantation and/or dialysis, there is a strong association with worsening clinical outcomes, resource utilization and societal economic burdenCitation2. In more advanced stages, patient management options may be limited to co-morbidity management, dialysis, and/or kidney transplantationCitation3,Citation4.
Emerging therapies are improving physicians’ ability to effectively manage CKD and prevent progression; therefore, it is increasingly important to identify patients early in the course of disease so that treatment can be initiatedCitation5–8.
To allow for timely CKD treatment initiation, comprehensive and regular testing of at-risk populations is recommended by global guidelinesCitation3,Citation4. Accurate CKD diagnosis is based on repeated measurements of estimated glomerular filtration rate (eGFR) and testing for albuminuria, with the specific, quantitative, lab-based urine albumin-to-creatinine ratio (UACR) test being preferred over less sensitive urine albuminuria dipstick testing. An eGFR test reveals kidney function decline, and testing for albuminuria (e.g. UACR testing) reveals kidney damage. Dual testing is crucial, as CKD-related kidney damage can be present even when eGFR indicates normal kidney function, as evidenced by high levels of albuminuria. Testing for albuminuria is therefore a critical component of identifying a CKD patient’s true disease severity, as well as enabling early intervention to delay CKD progression and prevention of cardiovascular (CV) events.
For a CKD diagnosis to be made based on diagnostic test results, patients must have evidence of renal damage and/or or renal functional decline, most easily assessed byCitation3,Citation4:
Albuminuria ≥30 mg/g (≥3 mg/mmol) (with UACR test being preferred over urine albuminuria dipstick)
and/or,
eGFR <60 mL/min/1.73m2
Therefore, if a patient has an eGFR of >60 mL/min/1.73m2, they will also require a test for albuminuria to confirm a diagnosis of CKD. In addition, for more reliable assessment of severity of CKD and prognosis to be determined in patients with eGFR <60 mL/min/1.73m2, a test for albuminuria would also need to be undertaken. These results provide information that can be used to guide the patient’s current and future management, including choices for therapeutic strategies.
Guidelines typically recommend that dual testing for eGFR and albuminuria should be performed each year in patients with T2D in order to identify CKD early enough for timely CKD treatment initiationCitation3,Citation4,Citation9. Evidence from real-world practice across countries, however, suggests that guidelines are not adhered to as a substantial proportion of patients with T2D only have an eGFR test or no CKD testing at allCitation10–16.
Currently, there is a paucity of literature describing the clinical and economic impact of testing for albuminuria, and specifically that of UACR testing in the different stages of CKD such as across the ‘The Kidney Disease: Improving Global Outcomes’ (KDIGO) heatmapCitation3,Citation17. This heatmap is a tool recommended by many country-specific guidelines for assessing the risk of kidney disease. In the following analysis, the clinical and economic consequences of UACR testing in line with global guidelines were compared with no UACR testing. Potential health gains and cost savings were assessed with a level of granularity not previously reported, including the impact of treatment and management strategies applied as a direct result of diagnosis. The model considered a UK healthcare system perspective; while economic outcomes resulting from it are most relevant in the UK, the trends generated should have applicability in a broader geographical context.
Materials and methods
Model overview
To demonstrate the clinical and economic impact of optimal usage of UACR testing in T2D patients, a decision analytic economic model “Markov cohort model” was implemented in Microsoft Excel. The model took the perspective of the UK healthcare system. The key outcomes assessed within this analysis included: incremental cost-effectiveness ratios (ICERs), life-years gained (LYg), LYg before end-stage kidney disease (ESKD), dialyses avoided, and costs (adjusted for inflation to the year 2021, with outcomes reported in GBP). Both the model structure and inputs were validated with expert clinicians during the design of the model approach. This study is reported following the CHEERS guidelines.
KDIGO categories
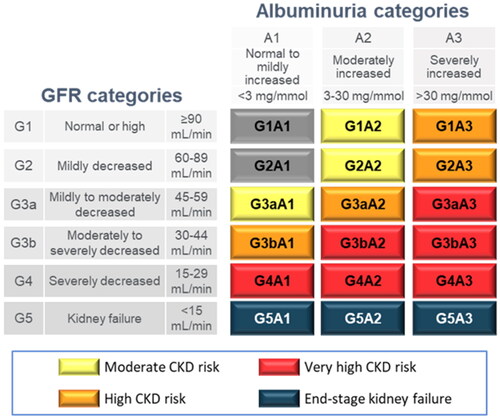
The KDIGO guidelinesCitation3,Citation4 detail CKD as a progressive disease with six eGFR categories (G1, G2, G3a, G3b, G4 and G5 on the vertical axis of ), further broken down into 18 different categories of severity when both eGFR and albuminuria values are known (G1-5:A1-3). The American Diabetes Association recommends T2D patients with UACR values in A2 or A3 categories to be treated with angiotensin-converting-enzyme inhibitor/angiotensin-receptor blockers (ACEi/ARBs)Citation19. There is further guidance that G1-3b:A3 patients should be considered for emerging treatment. These recommendations are evaluated here as base case and scenario analyses, respectively.
Figure 1. Adapted KDIGO heatmap of CKD based on eGFR and albuminuria categories. Terms for the coloured groups have been adapted from the KDIGO NomenclatureCitation18; grey, no CKD based on eGFR and UACR; yellow, moderate CKD risk; orange, high CKD risk; red, very high CKD risk; blue, kidney failure. Abbreviations. CKD, chronic kidney disease; eGFR, estimated glomerular filtration rate; UACR, urine albumin-to-creatinine ratio.
Model population and parametrization
A hypothetical cohort of 1,000 modelled patients was constructed, aged 60 and with a diagnosis of T2D. Of the cohort, 41.8% were male, as this aligns with population data (taken from a meta-analysis by Levey et al.Citation20) used to inform model parameters. The model considered a life-time horizon and used a one-year cycle length with half-cycle correction applied. A lifetime horizon was used as CKD is a chronic condition and, therefore, key patient outcomes, such as reaching ESKD, cannot be fully captured over shorter time frames. Costs and benefits beyond the first year were discounted at an annual rate of 3.5%, as per NICE guidelinesCitation21.
Health states
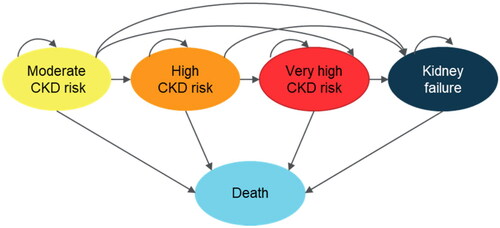
The model was implemented based on five mutually exclusive health states corresponding to the patient’s current prognosis risk (): Moderate CKD risk (yellow KDIGO categories), High CKD risk (orange KDIGO categories), Very high CKD risk (red KDIGO categories), Kidney failure, and Death (including all-cause death and cardiovascular-related death).
Figure 2. Health state diagram. CKD, chronic kidney disease.
Transition probabilities
To estimate model parameters for health state worsening and death, two different transition probabilities can be applied:
Up until and including the first state transition, a setup was implemented with parameters for 16 of the 18 KDIGO categories (see ).
After the first transition there, disease progression is not tracked at the granularity of KDIGO categories; therefore, a setup using weighted averages of the previously mentioned KDIGO category specific parameters was implemented within the remaining health states.
Table 1. Model parameters -- Relative risks used to calculate health states transition probabilities for patients receiving timely UACR testing (referenced fromCitation20).
Transition probabilities between health states (i.e. both for the first transition where a richer degree of alternatives is evaluated, and for following transitions incorporating the five health states only) were calculated based on the results from a global meta-analysis of 14 studies by Levey et al.Citation20 including 105,872 participants and altogether 730,577 person-years. A simplifying assumption was made that patients could only stay in the same health state or transit to worse health states.
Resource use
An email-based Delphi panel among clinicians (see ) was used to estimate the frequency of nephrologist visits required for the typical patient in each KDIGO categoryCitation22–24. Consensus of 75% was achieved after three rounds. Other estimates for resource use and costs (presented in ) were derived for the five health states and applied to the model.
Table 2. Average annual health care resource utilization costs by health state.
Modelled patients
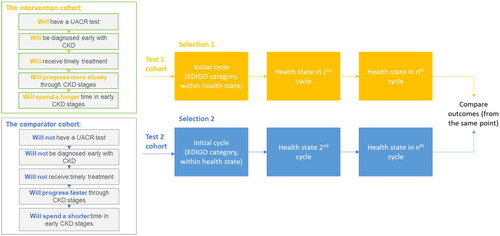
To evaluate the impact of UACR testing, the hypothetical cohort previously outlined is twice evaluated by the model – simulating firstly an intervention arm (i.e. where patients are diagnosed early and receive timely treatment) and secondly a comparator arm (where they are neither diagnosed nor treated early) (). For the intervention arm, patients were assumed to have optimal adherence to UACR testing recommendations, so that the value of guideline-indicated practices could be explored. In each case, patients start in the same KDIGO category, but with different risks of disease progression and mortality due to differences in treatment, as well as associated differences in costs.
Figure 3. Framework for cohort comparison. Abbreviations. CKD, chronic kidney disease; KDIGO, Kidney Disease, Improving Global Outcomes UACR, urine albumin-to-creatinine ratio.
The assumed treatment effect among patients in the intervention arm was operationalized by applying relative-risk reduction rates to the transition probabilities capturing the risks of transition to the next health state or mortality (see ). Since the data used to estimate relative risks for each health state were derived in a population that received timely treatment, an adjustment was carried out on the cohort not receiving UACR testing and subsequent treatment. The adjustment was done according to the formula: effectively corresponding to a removal of the treatment benefit.
Table 3. Assumed relative risk reduction rates by treatment analyzed.
Scenario analysis
Scenario analyses were conducted, evaluating the impact of applying different CKD progression rates, by varying the relative risk reduction (RRR) in a stepwise manner starting from the RRR rate of 21% (representing current standard of care) to 41%.
RRRs above 21% were intended to represent the range achievable with emerging therapies and, therefore, were only applied to patients in G1-3b with an albuminuria classification of A3 (those recommended for emerging therapies based on current guidelines)Citation19. Some emerging therapies are indicated for patients with an eGFR of down to 20 mL/min/1.73m2, however, due to uncertainty in the number of patients in G4 that meet this criterion, the decision was made to only apply RRR to whole KDIGO categories (G1 to G3b). This meant the benefits associated with optimal treatment due to UACR testing were not overestimated.
Key clinical improvements such as dialyses prevented and LYg before kidney failure that would follow from the improved efficacy, were recorded and plotted. In addition, the cost-effectiveness of a UACR test for the range of RRR rates were recorded and plotted.
Sensitivity analysis
To assist in the characterization of sources of uncertainty within the model, a probabilistic sensitivity analysis (PSA) was undertaken. This enabled us to gain insight into the probability of cost effectiveness of UACR testing over a wider range of inputs, allowing each input to be sampled from a distribution, representing the uncertainty in their true value.
Results
Base-case results
Regular UACR testing is associated with increased lifetime costs due to the earlier initiation of management strategies. The additional cost ranged from £2,142,124 to £2,681,768 for 1,000 patients with an initial UACR test resulting in G3aA3 and G1A2 classification, respectively (see ).
Table 4. Base-case clinical, cost and cost-effectiveness results.
Compared to when UACR testing was not conducted, the cost increase of managing (including testing) was offset by fewer CV deaths, fewer patients needing dialysis, and the generation of additional LYg before EKSD and overall (see ).
ICERs were calculated as the quotient of increased costs and LYg. ICERs for patients classified in the A2 or A3 categories range from £4,407 to £6,208 per LYg and show that UACR testing is a consistently cost-effective intervention across KDIGO groups (relative to an established cut-off of £20,000--£30,000 per QALYCitation30, when using utility values ranging from 0.73 to 0.85 for the health statesCitation31). The ICER for the G3aA1 category is ten-fold higher, £51,397 per LYg (see ).
Scenario analysis
demonstrates that for all KDIGO categories analyzed, the number of dialyses avoided and the LYg generated before kidney disease improves with increasing RRR.
Figure 4. (A) estimates of number of dialyses avoided, varying for RRR rates, which start at base case RRR of 21% and increases. (B) estimates of life years before kidney failure, varying for RRR rates, which start at base case RRR of 21% and increases. (C) cost-effectiveness for a UACR test, varying for RRR rates, which start at base case RRR of 21% and increases. All results presented for a cohort of 1,000 individuals with T2D. Abbreviations: LY, life year RRR; relative risk reduction; T2D, type 2 diabetes; WTP, willingness-to-pay.
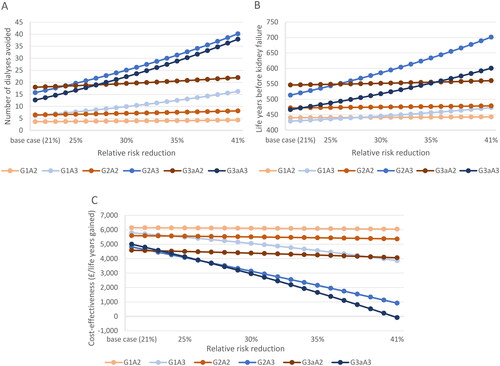
When the RRR was increased from 21% to 41%, patients initially identified in G1A3 with a UACR test had the greatest increase in the number of dialyses prevented, from six to 16 per 1,000 patient cohort, whereas patients initially identified in G2A3 had the highest increase in LYg before kidney disease from 513 to 701. At the maximum RRR of 41%, patients initially identified in G2A3 with a UACR test, avoided the greatest number of dialyses (40) and had the greatest number of LYg (701).
Across KDIGO categories, increasing RRRs were also associated with increasing cost effectiveness – with patients in the A3 groups experiencing the greatest benefit, and G3aA3 having the greatest improvement in cost effectiveness of all (from £5,000 to -£84), followed by G2A3 and then G1A3.
Sensitivity analysis
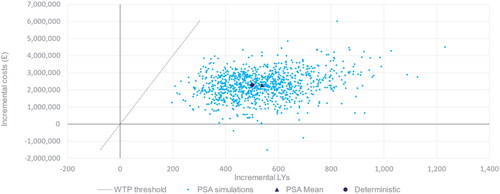
Results from a probabilistic sensitivity analysis (PSA) are presented in . The ICER estimates from 1,000 Monte-Carlo simulations are presented on the cost-effectiveness plane together with the deterministic and PSA mean estimates. Nearly all samples (99.7%) are in the upper-right quadrant, meaning that there is an expected incremental cost and incremental benefit, and all samples are below the willingness-to-pay (WTP) threshold of £20,000 per LYg.
Figure 5. Probabilistic sensitivity analysis – cost-effectiveness results presented for a cohort of 1,000 individuals in KDIGO category G3aA2 receiving vs. not receiving timely CKD treatment. Abbreviations. LY, life years; PSA, probabilistic sensitivity analysis; UACR, urine albumin-to-creatinine ratio; WTP, willingness-to-pay.
Discussion
This analysis set out to develop an economic model to quantify the clinical and economic impact of UACR testing versus not in patients with early-stage CKD and T2D. Unlike in a classical health economic model, alternative medicines are not compared, but instead two theoretical settings. The economic evaluation underpinning the analysis was performed with a UK healthcare system perspective; however, the clinical outcomes generated are expected to have applicability across a broader geographical context.
Following albuminuria testing guidelines, which includes the use of UACR testing, allows for timely initiation of management and treatment of CKDCitation3,Citation4. In turn, this would be expected to slow down progression and reduce the number of patients progressing to late-stage CKD. This delay is important, as it would reduce the need for dialysis and the risk of experiencing CV-related death.
The economic analysis indicates that following albuminuria-testing guidelines, particularly through the use of a UACR test, could lead to earlier initiation of management and increased lifetime treatment costs; however, earlier intervention is also associated with an increase in both life years and life years before ESKD. From a cost-effectiveness perspective, the ICERs are approximately £5,000 per life year gained across the CKD stages analyzed. This is well below the established WTP threshold of £20,000Citation21.
The results of the model are driven by the efficacy within each KDIGO test result category and the cost of CKD treatments given. Current guidelines – and hence assumptions in the model – suggest that CKD treatment should be initiated for patients with a UACR test result of A2 or above. The clinical outcomes of the model suggest that early testing and associated treatment of such patients would lead to a substantial survival increase. Benefits in terms of the prevention of both dialysis and CV death are, however, strongest for patients found to be in the very high-risk category. As current guidelines do not recommend early treatment initiation as a result of a UACR A1 test result, the benefit of a test yielding that result was limited, as demonstrated by the ICER being ten-fold higher in G3aA1 than the other categories analyzed.
The base case analysis was performed using a treatment effect of 21% to represent standard-of-care angiotensin-converting-enzyme/angiotensin receptor blockers (ACEi/ARBs). Scenario analyses were also performed where the treatment effect (RRR) was increased stepwise from 21% to a maximum of 41%. The additional RRR (above 21%) is representative of the potential treatment effects for emerging therapies such as SGLT2is and/or finerenone, and is only applied to KDIGO categories G1-3b:A3 (as recommended by current guidelines)Citation19.
The scenario analyses () suggest that as more efficacious treatments become widely available, the health-economic benefit provided by undertaking a UACR testing is likely to improve. While the model did not include drug costs associated with emerging therapies, demonstrates that there is scope for an increase in overall costs of management and retention of cost-effectiveness. The combined cost of UACR and eGFR testing totalled to £51.55 after adjusting for inflation, taken from data from NICE guidanceCitation32.
At a base case RRR of 21%, UACR testing was most cost-effective for patients in G3aA2. This was driven by the change in clinical outcomes observed for this category being the best compared to the other categories analyzed. A possible reason is that, while these patients are at substantial risk of progression to ESKD without treatment, early identification and initiation of treatment enables them to optimally benefit. At an RRR of 41%, UACR testing was cost saving for G3aA3, demonstrated by the negative ICER of -£84. This is due to these patients receiving the benefit of optimal management for the longest proportion of their lifetimes, compared to the other KDIGO categories analyzed, where patients are not eligible for the higher treatment effect.
No additional survival benefit was applied to any of the scenario analyses due to gaps in the available literature. It is important that further research be conducted to evaluate the long-term impact of emerging therapies on survival benefit – as any such impact would further improve the health economic case for UACR testing in line with current guidelines.
Limitations
Findings from this study should be interpreted in light of several limitations. The analyses are dependent on the meta-analysis by Levey et al.Citation20. This meta-analysis was used to inform the KDIGO guidelinesCitation3, and was determined to be comprehensive (including 105,872 participants from 14 studies); however, it is somewhat dated (initiated in 2009). A comprehensive targeted search found no data sources that were more recent with equivalent granularity required for the model. Since this study was published, new CKD treatments have become available for patients with T2D, which may enhance the benefits of early identification of CKD. To account for this, scenario analyses that explored some of the implications of these changes in practice were included. Additionally, some RR outcomes within the study also included data generated from patients using the dipstick method, which are associated with less accurate staging of albuminuria.
Additionally, various population-level characteristics are believed to have changed since the publication of the study on which we have based our analyses. Both CKD incidence and prevalence rates have been increasing, particularly in patients aged over 65. In line with this, CKD mortality has also increased consistently, with an increase of approximately 32% over the last 10 yearsCitation33–35. This implies that our findings are likely to be a conservative estimation compared to if more recent data were available, as this data would likely increase the value of early UACR testing.
Whilst UACR testing is critical for guideline-indicated identification of CKD, data extrapolation suggests that existing policies and strategies in place for the diagnosis and management of CKD are not enoughCitation36. This may stem in part from the challenges currently leading to poor implementation, which we have previously discussed. It is, however, important to raise awareness of other factors, outside of the more widely understood health-related individual risk factors associated with CKD, such as social determinants of health (SDoH)Citation37.
When estimating RRRs for patients receiving treatment, it was assumed that clinical guidelines were followed for studies within the source meta-analysis. It is, however, possible that some patients were not treated according to guidelines despite UACR test results requiring it, and that hence the true treatment effect should have been even greater. There is no way to validate this, and therefore our approach can be considered a conservative estimate in this regard.
Due to the complexity of the disease area, many sources of direct and indirect costs exist. The inputs used throughout this analysis are based on the major sources of direct and indirect costs affecting the NHS in the UKCitation38. It should be noted that not all costs were captured, for example: transportation for dialysis, vitamin supplementation, infection-related costs. Furthermore, it was assumed that all patients requiring renal replacement therapy would undergo dialysis, and not transplantation. Many of the additional cost sources that could be considered are more heavily associated with the later stages of CKD, and therefore inclusion of these costs would likely lead to further cost offsets for UACR due to delayed progression of CKD seen within this cohort.
As described, this analysis aims to demonstrate the value of undertaking UACR testing according to global guidelines. The authors recognize that this is somewhat theoretical, as we have not estimated the real-world adherence to testing guidelines, which are uncertain and known to vary. Whilst it is unlikely that perfect UACR testing adherence rates of would be achieved in practice, the comparison between perfect adherence and lack of adherence altogether is directly applicable to the substantial population of patients who do not currently receive a UACR testCitation10–16.
Conclusion
Findings from this health-economic analysis demonstrate that undertaking a UACR test early within CKD progression for patients with T2D is cost-effective, and has potential to be cost saving depending on the starting KDIGO category with emerging treatment options, versus no UACR testing. With the emergence of new CKD therapies that are able to slow disease progression further, it is important that CKD diagnostic testing is accessible to practitioners, that they are regular in using them, and that test results are being optimally integrated into clinical practiceCitation39,Citation40.
Transparency
Declaration of funding
This study was funded by Bayer, AG and conducted by Wickenstones Ltd.
Declaration of financial/other relationships
FG reports personal fees from Bayer AG Division Pharmaceuticals, during the conduct of the study; personal fees from Bayer AG Division Pharmaceuticals, outside the submitted work.
GR reports personal fees from Bayer AG Division Pharmaceuticals, during the conduct of the study; personal fees from Bayer AG Division Pharmaceuticals, outside the submitted work.
KF reports personal fees from Bayer AG Division Pharmaceuticals, during the conduct of the study; personal fees from Bayer AG Division Pharmaceuticals, outside the submitted work.
PM reports personal fees from Bayer AG Division Pharmaceuticals, during the conduct of the study; personal fees from Bayer AG Division Pharmaceuticals, outside the submitted work.
KM is employed by Wickenstones Ltd, a company that received consultancy fees from Bayer.
JH is employed by Wickenstones Ltd, a company that received consultancy fees from Bayer.
MC is employed by Wickenstones Ltd, a company that received consultancy fees from Bayer.
ÖÅ is employed by Wickenstones Ltd, a company that received consultancy fees from Bayer.
PR reports grants and other from Bayer, during the conduct of the study; grants and other from Astra Zeneca, other from Astellas, other from Boehringer Ingelheim, other from Novo Nordisk, other from Gilead, other from Abbott, other from Merck, other from Sanofi, outside the submitted work.
FDRH reports grants from National Institute for Health Research (NIHR) School for Primary Care Research, NIHR Applied Research Collaboration, the NIHR Oxford Biomedical Research Centre (BRC), and the NIHR Oxford Medtech and In-Vitro Diagnostics Co-operative (MIC), outside the submitted work; and FDRH occasionally consults or lectures, usually linked to an international medical society event, for global biotech companies which include Amgen, Bayer, BI, BMS, Novartis, Novo Nordisk, and Pfizer in the past 5 years on his specialty expertise in cardiovascular disease and digital studies.
CW reports personal fees from AstraZeneca, personal fees from Amgen, personal fees from Bayer, personal fees from Boehringer Ingelheim, personal fees from FMC, personal fees from MSD, personal fees from GSK, personal fees from GILEAD, personal fees from Vifor, outside the submitted work.
Author contributions
All authors met the requirements for authorship outlined by the ICMJE.
Reviewer disclosures
Peer reviewers on this manuscript have received an honorarium from JME for their review work but have no other relevant financial relationships to disclose.
Acknowledgements
No assistance in the preparation of this article is to be declared.
Correction Statement
This article was originally published with errors, which have now been corrected in the online version. Please see Correction (https://doi.org/10.1080/13696998.2023.2245636)
References
- Romagnani P, Remuzzi G, Glassock R, et al. Chronic kidney disease. Nat Rev Dis Primers. 2017;3:17088. doi: 10.1038/nrdp.2017.88.
- Evans M, Lewis RD, Morgan AR, et al. A narrative review of chronic kidney disease in clinical practice: current challenges and future perspectives. Adv Ther. 2022;39(1):33–43. doi: 10.1007/s12325-021-01927-z.
- Kidney Disease: improving Global Outcomes Diabetes Work Group. KDIGO 2022 clinical practice guideline for diabetes management in chronic kidney disease. Kidney Int. 2022;102(5S):S1–S127.
- Kidney Disease: improving Global Outcomes (KDIGO) CKD Work Group. KDIGO 2012 clinical practice guideline for the evaluation and management of chronic kidney disease. Kidney Inter. 2013;(Suppl):1–150.
- Bakris GL, Agarwal R, Anker SD, et al. Effect of finerenone on chronic kidney disease outcomes in type 2 diabetes. N Engl J Med. 2020;383(23):2219–2229. doi: 10.1056/NEJMoa2025845.
- Pitt B, Filippatos G, Agarwal R, et al. Cardiovascular events with finerenone in kidney disease and type 2 diabetes. N Engl J Med. 2021;385(24):2252–2263. doi: 10.1056/NEJMoa2110956.
- Heerspink HJL, Stefánsson BV, Correa-Rotter R, et al. Dapagliflozin in patients with chronic kidney disease. N Engl J Med. 2020;383(15):1436–1446. doi: 10.1056/NEJMoa2024816.
- Herrington WG, Staplin N, Wanner C, et al. Empagliflozin in patients with chronic kidney disease. N Engl J Med. 2023;388(2):117–127. doi: 10.1056/NEJMoa2204233.
- American Diabetes, A. Introduction: standards of medical care in diabetes-2022. Diabetes Care. 2022;45(Suppl 1):S1–S2.
- Folkerts K, Petruski-Ivleva N, Comerford E, et al. Adherence to chronic kidney disease screening guidelines among patients with type 2 diabetes in a US administrative claims database. Mayo Clin Proc. 2021;96(4):975–986. doi: 10.1016/j.mayocp.2020.07.037.
- Adhya J, Li C, Eisenmenger L, et al. Positive predictive value and stroke workflow outcomes using automated vessel density (RAPID-CTA) in stroke patients: one year experience. Neuroradiol J. 2021;34(5):476–481. doi: 10.1177/19714009211012353.
- Assogba GFA, Couchoud C, Roudier C, et al. Prevalence, screening and treatment of chronic kidney disease in people with type 2 diabetes in France: the ENTRED surveys (2001 and 2007). Diabetes Metab. 2012;38(6):558–566. doi: 10.1016/j.diabet.2012.08.004.
- National Diabetes Audit - 2015–2016: Report 1. Care Processes and Treatment Targets. 2017. https://digital.nhs.uk/data-and-information/publications/statistical/national-diabetes-audit/national-diabetes-audit-2015-2016-report-1-care-processes-and-treatment-targets
- Shen J, Huang Y-M, Song X-N, et al. Protection against death and renal failure by renin-angiotensin system blockers in patients with diabetes and kidney disease. J Renin Angiotensin Aldosterone Syst. 2016;17(3):1470320316656481. doi: 10.1177/1470320316656481.
- Stempniewicz N, Vassalotti JA, Cuddeback JK, et al. Chronic kidney disease testing among primary care patients with type 2 diabetes across 24 U.S. Health care organizations. Diabetes Care. 2021;44(9):2000–2009. doi: 10.2337/dc20-2715.
- Willison A, Tully V, Davey P. All patients with diabetes should have annual UACR tests. Why is that so hard? BMJ Qual Improv Rep. 2016;5(1):u209185.w3747.
- Groehl F, Garreta-Rufas A, Meredith K. The drivers of non-adherence to albuminuria testing guidelines and the clinical and economic impact of not identifying chronic kidney disease. Clinical Nephrol. 2023. doi: 10.5414/CN111106.
- Levey AS, Eckardt K-U, Dorman NM, et al. Nomenclature for kidney function and disease: executive summary and glossary from a kidney disease: improving global outcomes (KDIGO) consensus conference. Kidney Dis (Basel). 2020;6(5):309–317. doi: 10.1159/000509359.
- American Diabetes Association Professional Practice Committee. 11 Chronic kidney disease and risk management: standards of medical care in diabetes-2022. Diabetes Care. 2022;45(Suppl 1):S175–S184.
- Levey AS, de Jong PE, Coresh J, et al. The definition, classification, and prognosis of chronic kidney disease: a KDIGO controversies conference report. Kidney Int. 2011;80(1):17–28. doi: 10.1038/ki.2010.483.
- NICE. Updated guide to the methods of technology appraisal. 2013.
- Consortium YHE. Delphi Method. 2016. https://yhec.co.uk/glossary/delphi-method/
- Diamond IR, Grant RC, Feldman BM, et al. Defining consensus: a systematic review recommends methodologic criteria for reporting of delphi studies. J Clin Epidemiol. 2014;67(4):401–409. doi: 10.1016/j.jclinepi.2013.12.002.
- Hasson F, Keeney S, McKenna H. Research guidelines for the Delphi survey technique. J Adv Nurs. 2000;32(4):1008–1015. doi: 10.1046/j.1365-2648.2000.01567.x.
- Shardlow A, McIntyre NJ, Fraser SDS, et al. The clinical utility and cost impact of cystatin C measurement in the diagnosis and management of chronic kidney disease: a primary care cohort study. PLoS Med. 2017;14(10):e1002400. doi: 10.1371/journal.pmed.1002400.
- National Health Service England. 2019/20 National Cost Collection Data Publication 2021. Available from: https://www.england.nhs.uk/publication/2019-20-national-cost-collection-data-publication/
- Shore J, Green M, Hardy A, et al. The compliance and cost-effectiveness of smartphone urinalysis albumin screening for people with diabetes in England. Expert Rev Pharmacoecon Outcomes Res. 2020;20(4):387–395. doi: 10.1080/14737167.2019.1650024.
- Kent S, Schlackow I, Lozano-Kühne J, et al. What is the impact of chronic kidney disease stage and cardiovascular disease on the annual cost of hospital care in moderate-to-severe kidney disease? BMC Nephrol. 2015;16:65. doi: 10.1186/s12882-015-0054-0.
- Neuen BL, Young T, Heerspink HJL, et al. SGLT2 inhibitors for the prevention of kidney failure in patients with type 2 diabetes: a systematic review and meta-analysis. Lancet Diabetes Endocrinol. 2019;7(11):845–854. doi: 10.1016/S2213-8587(19)30256-6.
- NICE. NICE health technology evaluations: the manual. 2022. https://www.nice.org.uk/process/pmg36/chapter/economic-evaluation
- Jesky MD, Dutton M, Dasgupta I, et al. Health-Related quality of life impacts mortality but not progression to End-Stage renal disease in Pre-Dialysis chronic kidney disease: a prospective observational study. PLoS One. 2016;11(11):e0165675. doi: 10.1371/journal.pone.0165675.
- NICE. Chronic kidney disease in adults: assessment and management. 2015.
- Kovesdy CP. Epidemiology of chronic kidney disease: an update 2022. Kidney Int Suppl (2011). 2022;12(1):7–11. doi: 10.1016/j.kisu.2021.11.003.
- Gheith O, et al. Diabetic kidney disease: world wide difference of prevalence and risk factors. J Nephropharmacol. 2016;5(1):49–56.
- Garibotto G. A changing perspective for treatment of chronic kidney disease. J Clin Med. 2021;10(17):3840.
- Burgos-Calderon R, Depine SA, Aroca-Martinez G. Population kidney health. A new paradigm for chronic kidney disease management. Int J Environ Res Public Health. 2021;18(13):6786.
- Iroegbu C, Lewis L, Matura LA. An integrative review: chronic kidney disease awareness and the social determinants of health inequities. J Adv Nurs. 2022;78(4):918–928. doi: 10.1111/jan.15107.
- Marion Kerr IHE. Chronic Kidney Disease in England: the Human and Financial Cost. 2012. https://www.england.nhs.uk/improvement-hub/wp-content/uploads/sites/44/2017/11/Chronic-Kidney-Disease-in-England-The-Human-and-Financial-Cost.pdf
- Agarwal R, Filippatos G, Pitt B, et al. Cardiovascular and kidney outcomes with finerenone in patients with type 2 diabetes and chronic kidney disease: the FIDELITY pooled analysis. Eur Heart J. 2022;43(6):474–484. doi: 10.1093/eurheartj/ehab777.
- Perkovic V, Jardine MJ, Neal B, et al. Canagliflozin and renal outcomes in type 2 diabetes and nephropathy. N Engl J Med. 2019;380(24):2295–2306. doi: 10.1056/NEJMoa1811744.