
Abstract
Aims
In the SUSTAIN 6 cardiovascular outcomes trial, once-weekly semaglutide was associated with a statistically significant reduction in major adverse cardiovascular events compared with placebo. To date, no studies have assessed how accurately existing diabetes models predict the outcomes observed in SUSTAIN 6. The aims of this analysis were to investigate the performance of the IQVIA Core Diabetes Model when used to predict the SUSTAIN 6 trial outcomes, to calibrate the model such that projected outcomes reflected observed outcomes, and to examine the impact of calibration on the cost-effectiveness of once-weekly semaglutide from a UK healthcare payer perspective.
Methods
The IQVIA Core Diabetes Model was calibrated to ensure that the projected non-fatal stroke event rates reflected the non-fatal stroke event rates observed in SUSTAIN 6 over a two-year time horizon. Cost-effectiveness analyses of once-weekly semaglutide versus placebo plus standard of care were conducted over a lifetime horizon using the uncalibrated and calibrated models to assess the impact on cost-effectiveness outcomes.
Results
To replicate the non-fatal stroke event rate in SUSTAIN 6, calibration of the model through the application of relative risks for stroke of 1.07 and 1.65 with once-weekly semaglutide and placebo, respectively, was required. In the long-term cost-effectiveness analysis, the uncalibrated model projected an incremental cost-effectiveness ratio for once-weekly semaglutide versus placebo plus standard of care of GBP 22,262 per quality-adjusted life year (QALY) gained, which fell to GBP 17,594 per QALY gained when the calibrated model was used.
Conclusions
The requirement for calibration to replicate the outcomes observed in SUSTAIN 6 suggests that the reductions in risk of cardiovascular complications observed with once-weekly semaglutide cannot be solely explained by differences in conventional risk factors. Accurate estimation of the risk of diabetes-related complications using methods such as calibration is important to ensure accurate cost-effectiveness analyses are conducted.
Introduction
People with type 2 diabetes are at an increased risk of a wide range of complications, including cardiovascular disease, kidney disease, ophthalmic complications and neuropathyCitation1–3. Guidelines such as those released by the National Institute for Health and Care Excellence (NICE), and the American Diabetes Association (ADA) and the European Association for the Study of Diabetes (EASD) on the treatment of type 2 diabetes seek to optimize treatment to reduce the risk of micro- and macrovascular diabetes-related complicationsCitation4,Citation5. As the prevalence of type 2 diabetes continues to rise and scarce healthcare resources come under increasing pressure, assessment of the cost-effectiveness of diabetes medications is crucial for healthcare payers to make informed decisions on which medications to reimburse. It is increasingly common for health technology assessment agencies to take into account cost-effectiveness evaluations to inform the positioning and optimal use of new interventionsCitation6. It is crucial that these cost-effectiveness analyses are accurate in order for appropriate reimbursement decisions to be made. Due to the chronic and progressive nature of type 2 diabetes, cost-effectiveness analyses require a long-term time horizon, moving well beyond the typical follow-up period of randomized controlled trials. Conventional health economic models of type 2 diabetes therefore take changes in risk factors from clinical trials and project the cumulative incidence of diabetes-related complication, life expectancy, quality-adjusted life expectancy and costs using risk equations developed based on long-term studies. Risk factors included in these models include age, duration of diabetes, sex, smoking status, glycated haemoglobin (HbA1c), blood pressure, serum lipids, body mass index (BMI), estimated glomerular filtration rate (eGFR) and history of complications.
In 2008, the Food and Drug Administration issued guidelines on the conduct of cardiovascular outcomes trials, aiming to assess the impact of new diabetes medications on cardiovascular risk in people with type 2 diabetesCitation7. These studies have a longer follow-up period than standard phase 2 or 3 trials of diabetes medications, and collect data on the incidence of diabetes-related complications rather than changes in surrogate outcomes. The primary endpoint of these studies is the time to first major adverse cardiovascular events (MACE), most commonly defined as the composite endpoint of cardiovascular death, non-fatal myocardial infarction or non-fatal stroke. The cardiovascular outcomes trials were designed to promote “glycemic equipoise” between the trial arms, aiming to reduce the confounding impact of differences in glycaemic control between the treatment armsCitation8. However, in the majority of cardiovascular outcomes trials, differences in glycaemic control and other risk factors for cardiovascular events persist for the duration of the studyCitation8. As such, it is unclear how much of the reduced risk of cardiovascular disease is driven by conventional risk factors included in existing health economic models of diabetes, and how much is driven by other aspects of treatment.
Existing health economic models of type 2 diabetes were prepared before the cardiovascular outcomes trials were conducted and, therefore, rely on risk equations developed in the absence of these data. There is concern that these models may not fully capture the cardiovascular benefits associated with new treatments observed in the cardiovascular outcomes trials and, increasingly, studies are aiming to capture data from cardiovascular outcomes trials as part of the health economic models. A number of approaches have been proposed, with the aim of moving away from conventional modelling based purely on changes in risk factorsCitation9. The most commonly used approach is calibration, the key strengths of which are that modelled outcomes exactly reflect those observed in clinical trials and that the drug-specific benefit outside of conventional risk factors can be calculated. At the 9th Mount Hood Diabetes Challenge, modellers aimed to investigate model performance and the calibration required to replicate the outcomes observed in the EMPA-REG OUTCOME and CANVAS cardiovascular outcomes trials (assessing empagliflozin and canagliflozin, respectively)Citation10–12. All of the tested models required calibration to reflect the observed outcomes in both the intervention and placebo arms. Moreover, the rate ratios calculated in the EMPA-REG OUTCOME calibration were not transferable to the CANVAS calibration, showing that calibration to each cardiovascular outcomes trial individually is required.
In the SUSTAIN 6 cardiovascular outcomes trial, once-weekly semaglutide plus standard of care was compared with placebo plus standard of careCitation13. Standard of care comprised encouraging investigators to treat all patients according to local guidelines to achieve the most effective glycaemic control, and additional non-investigational anti-hyperglycaemic medications could be initiated and/or titrated. People with type 2 diabetes with a glycated haemoglobin above 7% and prior or increased risk of cardiovascular disease were followed for a median of 2.1 years. Of the enrolled participants, 83% had established cardiovascular disease, chronic kidney disease or both. The majority of patients were taking antihypertensive medications (93.5%), lipid-lowering medications (76.5%), and antithrombotic medications (76.3%). Over the follow-up period, once-weekly semaglutide was associated with a statistically significant reduction in MACE compared with placebo (hazard ratio 0.74, 95% confidence interval 0.58 to 0.95). Once-weekly semaglutide was associated with reductions in all components of the composite endpoint (), but only the reduction in the risk of non-fatal stroke reached statistical significance (hazard ratio 0.61, 95% confidence interval 0.38 to 0.99). During the SUSTAIN 6 trial, once-weekly semaglutide was associated with greater reductions in HbA1c, blood pressure, serum lipids, eGFR and body weight. To date, no studies have assessed the performance of existing health economic models of diabetes with respect to how accurately they predict the outcomes observed in the SUSTAIN 6 trial, and the implications of this in terms of to how much of the reduction in MACE observed in SUSTAIN 6 can be explained by risk factors currently included in these models.
Table 1. Outcomes of the SUSTAIN 6 trial.
The aim of the present analysis was to investigate the performance of the IQVIA Core Diabetes Model in terms of prediction of the outcomes observed in the SUSTAIN 6 trial, to calibrate the model such that projected outcomes reflected those observed in the SUSTAIN 6 trial, and to examine the impact of calibration on the long-term cost-effectiveness profile of once-weekly semaglutide from a UK healthcare payer perspective.
Methods
The IQVIA Core Diabetes Model
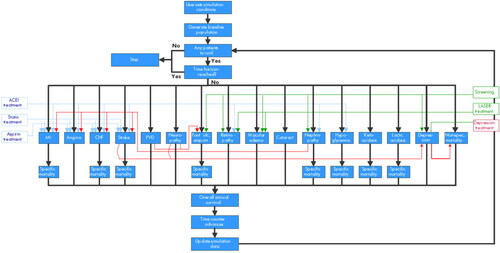
The analysis was performed using version 9.5 of the IQVIA Core Diabetes Model, a previously published non-product-specific diabetes policy analysis toolCitation14. The model is comprised of a number of sub-models to simulate diabetes-related complications and mortality (), each with a semi-Markov structure. Patient-level simulations are performed based on patient risk factors, treatment approaches for microvascular and end-stage complications, and frequency of screening for microvascular complications. Outputs produced by the model include life expectancy and quality-adjusted life expectancy, mean time to onset and cumulative incidence of diabetes-related complications, costs, and incremental cost-effectiveness ratios (ICERs). Model validations against real-life data have been published on first release of the model in 2004 and more recently in 2014Citation15,Citation16.
Figure 1. Schematic of the IQVIA Core diabetes model. Abbreviations. ACEI, angiotensin-converting enzyme inhibitor; CHF, congestive heart failure; MI, myocardial infarction; Non-spec, non-specific; PVD, peripheral vascular disease; ulc, ulcer.
The model includes a number of different risk equations to estimate the risk of primary macrovascular and microvascular events in people with diabetes, most notably those based on the United Kingdom Prospective Study (UKPDS). The UKPDS 68 risk equations were first published in 2004 based on a median follow-up of 10.3 years and 39,460 person-years from 3,642 patients in the UKPDS for whom annual data on potential risk factors were availableCitation17. The UKPDS 82 risk equations were released in 2013, capturing a median 17.6 years of follow-up and up to 89,760 person-years of dataCitation18. The UKPDS 82 risk equations were used in the base case analysis, as they capture a greater duration of follow-up, with the UKPDS 68 risk equations applied in a sensitivity analysis. It should be noted that the UKPDS 68 risk equations only allow calculation of the risk of first events and, therefore, the risks of second events were based on data from the Framingham Heart Study in this sensitivity analysisCitation19. The model also contains options to estimate mortality, and this was based on the UKPDS 82 mortality equations in the base case analysisCitation18.
Examination of the predictive accuracy of the IQVIA Core Diabetes Model based on the SUSTAIN 6 trial
To investigate the performance of the IQVIA Core Diabetes Model in the population of people with type 2 diabetes at high risk of cardiovascular disease, the uncalibrated model was used to project outcomes based on the SUSTAIN 6 trial over a two-year time horizon. The predicted non-fatal stroke event rate (expressed in events per 100 patient years) was compared with the event rate observed in the SUSTAIN 6 trial. The time horizon of 2 years marginally reduced the follow-up time from the median 2.1 years in the primary trial publicationCitation13. The modelling analysis reflected the SUSTAIN 6 trial as closely as possible. Baseline cohort characteristics were based on the SUSTAIN 6 trial () and changes in risk factors (HbA1c, systolic blood pressure, diastolic blood pressure, total cholesterol, LDL cholesterol, HDL cholesterol, triglycerides, BMI eGFR and hypoglycaemic event rates), were applied in both the first and second years of the analysis, reflecting those observed with once-weekly semaglutide plus standard of care and placebo plus standard of care in SUSTAIN 6. Example risk factor progression curves are shown for HbA1c and BMI in and , respectively.
Figure 2. HbA1c progression. In the two-year calibration analysis (panel a), HbA1c was modelled to reflect the SUSTAIN 6 values in year 1 and year 2 in the once-weekly semaglutide and placebo arms. In the lifetime horizon cost-effectiveness analysis (panel b), HbA1c was modelled to reflect the SUSTAIN 6 values in year 1 and year 2 in the once-weekly semaglutide and placebo arms after which assumptions were required. Basal bolus insulin was initiated at the start of year 5 in the once-weekly semaglutide arm and at the start of year 4 in the placebo arm. HbA1c, glycated haemoglobin.
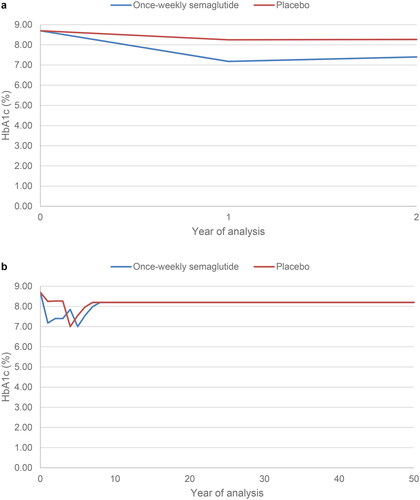
Figure 3. BMI progression. In the two-year calibration analysis (panel a), BMI was modelled to reflect the SUSTAIN 6 values in year 1 and year 2 in the once-weekly semaglutide and placebo arms. In the lifetime horizon cost-effectiveness analysis (panel b), BMI was modelled to reflect the SUSTAIN 6 values in year 1 and year 2 in the once-weekly semaglutide and placebo arms after which assumptions were required. Basal bolus insulin was initiated at the start of year 5 in the once-weekly semaglutide arm and at the start of year 4 in the placebo arm. Abbreviation. BMI, body mass index.
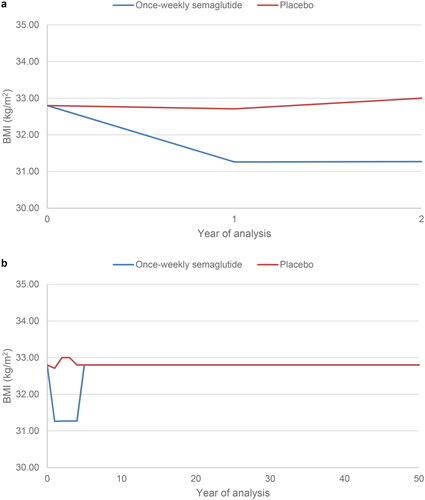
Table 2. Baseline cohort characteristics in the SUSTAIN 6 trial.
Calibration of the model
The model was calibrated such that the non-fatal stroke event rate projected by the IQVIA Core Diabetes Model was equal to that observed in SUSTAIN 6 at 2 years in both the once-weekly semaglutide and placebo arms (0.80 and 1.31 events per 100 patient years, respectively). This approach was chosen as non-fatal stroke was the only event with a statistically significant difference between the once-weekly semaglutide and placebo arms in SUSTAIN 6 that is also directly modelled in the IQVIA Core Diabetes Model. A statistically significant reduction in the rate of revascularization was observed with once-weekly semaglutide compared with placebo in SUSTAIN 6, but this is not modelled as a stand-alone complication in the IQVIA Core Diabetes Model and therefore this could not be captured in the present analysis. Calibration to outcomes where there was no statistically significantly difference between the once-weekly semaglutide and placebo arms was not conducted, to ensure that these events did not drive the cost-effectiveness analysis.
In each year of a simulation, the IQVIA Core Diabetes Model calculates the annual probability of stroke based on the simulated patient’s characteristics using the risk equation selected by the user (UKPDS 82 in the base case analysis, UKPDS 68 in the sensitivity analysis). The model contains the functionality to adjust this probability in each treatment arm using a relative risk, thereby allowing the cardioprotective effect of medications not mediated through conventional risk factors included in the risk equations to be captured. An iterative process was used to calculate the relative risk applied in the two treatment arms:
The uncalibrated model (i.e. relative risk of 1 applied in each treatment arm) was run over a two-year time horizon, as described above.
Initial relative risk values were applied separately in the once-weekly semaglutide and placebo arms, the model was re-run and the non-fatal stroke event rate was compared with the values observed in SUSTAIN 6.
A linear trend line was used to predict the next best choice of relative risk for stroke in each arm, based on the previous relative risks applied and the non-fatal stroke event rate predicted by the model.
The IQVIA Core Diabetes Model was rerun with the new relative risk values applied.
The above two steps were repeated until the non-fatal stroke event rates at 2 years were 0.80 events per 100 patient years in the once-weekly semaglutide arm and 1.31 events per 100 patient years in the placebo arm.
Long-term cost-effectiveness analysis
Base case analysis
To evaluate the importance of calibration on the long-term cost-effectiveness of once-weekly semaglutide for the treatment of patients at high risk of cardiovascular disease in the UK setting from a healthcare payer perspective, analyses were conducted over patient lifetimes with the uncalibrated and calibrated models. A lifetime time horizon is recommended in modelling guidelines for the UK released by NICE, to ensure that all differences in long-term complications (and their impact on costs and quality of life) and mortality with diabetes interventions are capturedCitation20. The only difference between the analyses using the uncalibrated and calibrated models was the application of the relative risks generated during the calibration step for the first two years of the analysis, matching the duration of SUSTAIN 6 where a reduced risk of non-fatal stroke with once-weekly semaglutide compared with placebo has been demonstratedCitation13. Projected cost and clinical outcomes were discounted at 3.5% annually, in line with modelling guidelines for the UKCitation20.
Baseline cohort characteristics and changes in risk factors aligned with the SUSTAIN 6 trial in the once-weekly semaglutide and placebo plus standard care arms. From year 3 of the analysis, assumptions were required to project beyond the trial period. HbA1c and BMI were assumed to remain at the values observed in year 2 of the SUSTAIN 6 trial in the third year of the simulation in both treatment arms. In the fourth year of the analysis, in the once-weekly semaglutide arm, HbA1c increased based on the UKPDS HbA1c progression equation. As a result, HbA1c exceeded 7.5%, the threshold at which NICE recommend intensification of treatment, and basal bolus insulin was assumed to be initiated at the start of year 5Citation4. HbA1c fell to 7.0% and BMI returned to baseline when basal bolus insulin was initiated. In the following years, HbA1c increased based on the UKPDS progression equation until it reached 8.2%, a value reflecting typical glycaemic control in the UK, where it was held constant, and BMI remained unchanged for the remainder of patients’ lifetimesCitation21. In the standard of care arm, HbA1c was above the 7.5% threshold in the fourth year of the analysis, and basal bolus insulin was, therefore, assumed to be initiated one year earlier than in the once-weekly semaglutide arm. Assumptions around the impact of basal bolus insulin were equivalent, with HbA1c falling to 7.0% and BMI returning to baseline. Progression assumptions were also equivalent, with HbA1c increasing based on the UKPDS progression equation until it reached 8.2% where it was held constant, and BMI remaining unchanged. Progression of HbA1c and BMI over patient lifetimes are shown in and , respectively.
Costs of treatment with once-weekly semaglutide plus standard care and placebo plus standard care included costs of anti-diabetic medications, needles, and self-monitoring of blood glucose testing. The analysis captured the medications received alongside once-weekly semaglutide and placebo at baseline and those initiated during the SUSTAIN 6 trial period, including oral medications and insulin. A greater proportion of patients in the placebo arm initiated concomitant medications during the trial, most notably insulin glargine U100. Annual treatment costs in each year of the analysis are shown in .
Table 3. Annual costs of treatment.
As diabetes progresses, patients develop complications that result in increased costs and reduced health-related quality of life. Costs of treating each modelled diabetes-related complication were applied to the events projected by the IQVIA Core Diabetes model, and were consistent with previously published cost-effectiveness analyses in the UK setting, inflated to 2020 values where required ()Citation22–24. In order to capture the impact of diabetes-related complications on quality of life, utilities were sourced from a systematic literature review published in 2014 which represent the IQVIA Core Diabetes Model default valuesCitation25. This review selected utilities that fulfilled the requirements of the NICE reference case. The impact of hypoglycaemic events on quality of life was included in the analysis based on a 2013 publication (published after the literature searches for the 2014 review had been conducted)Citation26.
Table 4. Annual costs of treating diabetes-related complications.
Sensitivity analyses
Projection of long-term outcomes is associated with uncertainty and, therefore, a series of sensitivity analyses were performed to test the impact of alternative modelling assumptions. The base case analysis used a 50-year time horizon, and the impact of shortening the time horizon of the analysis was examined by running an analysis over a 20-year time horizon. It should be noted that not all simulated patients had died at the end of these simulations and, therefore, the full impact of the interventions on cost and clinical outcomes was not captured. To examine the impact of a shorter treatment duration, an analysis was performed with treatment switching to basal bolus insulin after two years, equivalent to the trial period of SUSTAIN 6 and, therefore, the duration where a reduced risk of non-fatal stroke has been demonstrated. As the only difference between the uncalibrated and calibrated models was the relative risks for stroke applied in the calibrated version, the sensitivity of outcomes to changes in the duration of these effects was assessed by applying the relative risks for three years (rather than two years in the base case), matching the duration of treatment with semaglutide or placebo plus standard of care. To examine the impact of the uncertainty around the outcomes observed in the SUSTAIN 6 trial, analyses were conducted with the IQVIA Core Diabetes Model calibrated to reflect the upper and lower 95% confidence limits of the non-fatal stroke hazard ratio. In these upper and lower confidence limit analyses, the model was calibrated to 1.30 and 0.50 events per 100 patient years, respectively, at 2 years in the once-weekly semaglutide arm (the placebo arm was unchanged, calibrated to 1.31 events per 100 patient years at 2 years).
The calibration analysis and long-term cost-effectiveness analysis were repeated using the UKPDS 68 risk equations to predict the outcomes. In this analysis, the relative risks required to ensure that the projected non-fatal stroke event rates reflected those observed in SUSTAIN 6 were re-calculated using an equivalent methodology. These values were then applied for the first two years of the simulation, as in the base case analysis.
Results
Examination of the predictive accuracy of the IQVIA Core Diabetes Model based on the SUSTAIN 6 trial
Projections over a two-year time horizon found that the uncalibrated IQVIA Core Diabetes Model underpredicted the non-fatal stroke event rate (the only event with a statistically significant difference in event rate in SUSTAIN 6 that is also modelled in the IQVIA Core Diabetes Model) in both the once-weekly semaglutide and placebo arms compared with the outcomes observed in the SUSTAIN 6 trial (). In addition, the benefits of treatment with once-weekly semaglutide in terms of reducing the non-fatal stroke event rate were underestimated. A reduction of 0.03 events per 100 patient years with once-weekly semaglutide was predicted, compared with a reduction of 0.51 events per 100 patient years observed in SUSTAIN 6. Therefore, the full impact of once-weekly semaglutide in terms of the reduced risk of non-fatal stroke cannot be explained by changes in conventional risk factors alone, and was underestimated in the modelling analysis.
Table 5. Comparison of the non-fatal stroke event rate in the SUSTAIN 6 trial and projected by the IQVIA Core Diabetes Model.
The other complications reported in SUSTAIN 6 and captured by the IQVIA Core Diabetes Model were all-cause mortality, myocardial infarction, angina and congestive heart failure. Observed and modelled cumulative incidences (capturing first events only, and not subsequent events) in the once-weekly semaglutide arm were 3.8% versus 7.0%, 2.9% versus 2.3%, 1.3% versus 1.8%, and 3.6% versus 0.8% for all-cause mortality, myocardial infarction, angina and congestive heart failure, respectively. Similarly, observed versus modelled cumulative incidences were 3.6% versus 7.3%, 3.9% versus 2.5%, 1.6% versus 1.9%, and 3.3% versus 0.9% in the placebo arm for all-cause mortality, myocardial infarction, angina and congestive heart failure, respectively.
Calibration conducted in order to reflect the stroke outcomes of the SUSTAIN 6 trial
In order for the IQVIA Core Diabetes Model to accurately predict the non-fatal stroke event rate observed in the SUSTAIN 6 trial, relative risks for stroke of 1.07 and 1.65 were required in the once-weekly semaglutide arm and placebo arms, respectively. Application of these relative risks brought the non-fatal stroke event rates from 0.75 and 0.78 events per hundred patient years to 0.80 and 1.31 events per 100 patient years with once-weekly semaglutide and placebo, respectively, in line with event rates seen in the SUSTAIN 6 trial.
The impact of calibration on long-term cost-effectiveness
Clinical outcomes
When the uncalibrated model was used to project outcomes over a lifetime horizon, once-weekly semaglutide was associated with mean discounted life expectancy of 9.94 years (95% confidence interval 9.93 to 9.95 years) and mean quality-adjusted life expectancy of 6.14 QALYs (95% confidence interval 6.14 to 6.15 QALYs, ). In comparison, placebo was associated with mean discounted life expectancy and quality-adjusted life expectancy of 9.85 years (95% confidence interval 9.84 to 9.86 years) and 6.05 QALYs (95% confidence interval 6.04 to 6.05 QALYs), respectively. Once-weekly semaglutide was associated with gains in life expectancy of 0.09 years (95% confidence interval +0.07 to +0.10) and in quality-adjusted life expectancy of 0.10 QALYs (95% confidence interval +0.09 to +0.11). When the calibrated model was used, mean discounted life expectancy and quality-adjusted life expectancy were unchanged with once-weekly semaglutide. In the placebo arm, discounted life expectancy fell by 0.04 years and quality-adjusted life expectancy fell by 0.02 QALYs, due to the increased incidence of stroke in the first 2 years of the analysis. Life expectancy and quality-adjusted life expectancy were projected to be 9.94 years (95% confidence interval 9.93 to 9.95 years) and 6.14 QALYs (95% confidence interval 6.14 to 6.15 QALYs), respectively, with once-weekly semaglutide and 9.82 years (95% confidence interval 9.81 to 9.83 years) and 6.02 QALYs (95% confidence interval 6.01 to 6.03 QALYs), respectively, with placebo. The benefit in quality-adjusted life expectancy with once-weekly semaglutide versus placebo increased by 0.025 QALYs to 0.12 QALYs (95% confidence interval +0.11 to +0.13) when the calibrated model was used.
Table 6. Projection of outcomes over a lifetime horizon using the uncalibrated and calibrated IQVIA Core Diabetes Model.
Differences between the results of the uncalibrated and calibrated analyses were predominantly driven by changes in the cumulative incidence of stroke, though the cumulative incidence of other complications changed slightly due to differences in mortality. Over a lifetime horizon, the uncalibrated model projected a cumulative incidence of stroke of 9.42% and 9.70% with once-weekly semaglutide and placebo, respectively. Use of the calibrated model of resulted in project cumulative incidence of 9.49% (95% confidence interval 9.43 to 9.56%) with once-weekly semaglutide and 10.21% (95% confidence interval 10.14 to 10.27%) with placebo. Calibration increased the difference between the treatment arms over a lifetime horizon, despite relative risks only being applied for the first two years of the analysis, thereby reflecting the benefits of once-weekly semaglutide demonstrated in SUSTAIN 6 that would otherwise not have been reflected in the modelling analysis.
Cost outcomes
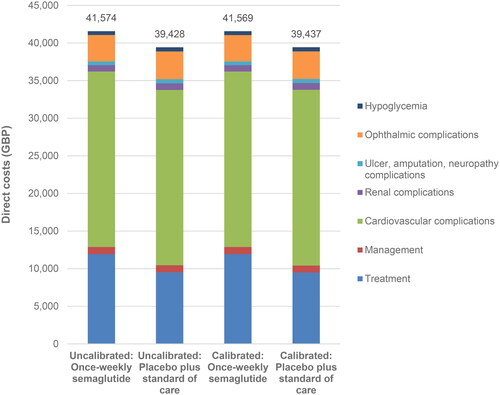
The uncalibrated model projected mean total costs of GBP 41,574 (95% confidence interval GBP 41,512 to 41,636) and GBP 39,428 (95% confidence interval GBP 39,365 to 39,491) with once-weekly semaglutide and placebo plus standard of care, respectively, over a lifetime horizon, an increased cost of GBP 2,146 (95% confidence interval + GBP 2,060 to +2,232) with once-weekly semaglutide. When the calibrated model was used, mean total costs were projected to be GBP 41,569 (95% confidence interval GBP 41,505 to 41,633) with once-weekly semaglutide and GBP 39,437 (95% confidence interval GBP 39,373 to 39,501) with placebo plus standard of care. Therefore, the cost difference fell from GBP 2,146 (95% confidence interval + GBP 2,060 to +2,232) to GBP 2,132 (95% confidence interval + GBP 2,044 to +2,221, ). In both analyses, once-weekly semaglutide was associated with increased treatment costs, but this was partially offset by reduced costs of treating diabetes-related complications. The increase in treatment costs remained similar in both analyses, but once-weekly semaglutide was associated with greater cost savings as a result of avoided complications when the calibrated model was used, increasing from GBP 278 per patient when the uncalibrated model was used to GBP 330 with the calibrated model.
Figure 4. Projection of costs over a lifetime horizon using the uncalibrated and calibrated IQVIA Core Diabetes model. GBP, 2020 pounds sterling.
Cost-effectiveness outcomes
Based on the projections of quality-adjusted life expectancy and costs made by the uncalibrated model, once-weekly semaglutide 1 mg was associated with an ICER of GBP 22,262 per QALY gained versus placebo plus standard of care over a lifetime horizon from a UK healthcare payer perspective. The calibrated model estimated an ICER of GBP 17,594 per QALY gained, GBP 4,669 per QALY gained lower than when the uncalibrated model was used. The ICER fell from just above to below the commonly-quoted willingness-to-pay threshold of GBP 20,000 per QALY gained, showing the importance of calibration, as this may lead to a change in payer decision making.
Sensitivity analyses
Across the range of sensitivity analyses performed using the calibrated model, all of the calculated ICERs remained below the willingness-to-pay threshold of GBP 20,000 per QALY gained in all but one sensitivity analysis, showing that the results were robust to changes in the modelling inputs and assumptions applied (). When outcomes were projected over a shorter time horizon of 20 years, the projected ICER increased, as the benefits of once-weekly semaglutide in terms of reducing the cumulative incidence of complications over the long term were not fully captured. Shortening the duration of treatment before intensification resulted in an increased ICER compared with the base case analysis, with once-weekly semaglutide associated with a smaller clinical benefit and a smaller increase in costs. Similarly, applying the stroke relative risks for three years (compared with two years in the base case analysis) resulted in a small decrease in the ICER to GBP 17,584 per QALY gained. In order to calibrate the model to the upper and lower 95% confidence limits of the non-fatal stroke hazard ratio observed in SUSTAIN 6, relative risks for stroke of 1.75 and 0.67 were required in the once-weekly semaglutide arm, respectively. Applying the relative risk of 1.75 in the long-term analysis increased the ICER to GBP 23,069 per QALY gained, while applying the relative risk of 0.66 had the converse effect, reducing the ICER to GBP 16,520 per QALY gained,
Table 7. Sensitivity analyses using the calibrated IQVIA Core Diabetes Model.
When the analysis was performed using the UKPDS 68 risk equations, relative risks for stroke of 0.39 and 0.60 were required in the modelled once-weekly semaglutide and placebo arms, respectively, in order to ensure that non-fatal stroke event rates reflected those observed in SUSTAIN 6. The relative risk values less than 1 show that the UKPDS 68 risk equations overpredict the risk of stroke, while the UKPDS 82 risk equations used in the base case analysis underpredicted risk. In the long-term cost-effectiveness analysis, once-weekly semaglutide was associated with an increase in quality-adjusted life expectancy of 0.14 QALYs and an increase in costs of GBP 1,968, resulting in an ICER of GBP 14,569 per QALY gained.
Discussion
The present analysis has shown that changes in risk factors used in conventional diabetes modelling do not fully capture the differences in the risk of cardiovascular complications with once-weekly semaglutide plus standard of care versus placebo plus standard of care in SUSTAIN 6. As such, the IQVIA Core Diabetes Model was not able to accurately predict the stroke outcomes (the only event with a statistically significant difference in event rate in SUSTAIN 6 that is also modelled in the IQVIA Core Diabetes Model) observed in the SUSTAIN 6 trial, and calibration was required in order to improve the predictive accuracy of the model. In the long-term cost-effectiveness analysis of once-weekly semaglutide for the treatment of people with type 2 diabetes at high risk of cardiovascular disease, applying the calibration to the first 2 years of the analysis resulted in once-weekly semaglutide becoming cost-effective, unlike when the uncalibrated model was used, with the ICER reduced by GBP 4,669 per QALY gained and falling from above to below the willingness to pay threshold of GBP 20,000 per QALY gained. Therefore, calibration of the IQVIA Core Diabetes Model had an important impact on the cost-effectiveness profile of once-weekly semaglutide in the UK setting. Calibration aims to increase the clinical accuracy of the modelling analysis. As such, the calibrated analysis could allow more accurate healthcare decision making around the optimal treatments at each stage of the diabetes treatment algorithm, with the aim of avoiding diabetes-related complications for patients and maximizing the use of scarce resources for the healthcare payer. The present analysis investigated the predictive accuracy of only one of the currently available diabetes models and, therefore, the conclusions are specific to the IQVIA Core Diabetes Model. However, conclusions are likely to apply to other diabetes models that use a similar structure, as shown at the 9th Mount Hood meeting, where all of the tested models required calibration in order to replicate two cardiovascular outcomes trialsCitation10.
Calibration of the IQVIA Core Diabetes model aimed to increase the accuracy of the projected incidence of diabetes-related complications and, therefore, the process allows healthcare decision makers to be better informed when making decisions on the optimal diabetes treatment algorithm. The present analysis only included non-fatal stroke, as conducting analyses around MACE are challenging due to the composite endpoint. If calibration to the MACE event rates observed in SUSTAIN 6 were possible, it is likely that the ICER would fall further. Additionally, prior calibration studies have aimed to calibrate multiple outcomes simultaneouslyCitation10. This is challenging due to the interdependence between complications with, for example, prior heart failure increasing the risk of myocardial infarction. While complex, calibration to multiple endpoints aims to provide a more accurate reflection of the clinical impact of a medication and, therefore, the associated health economic outcomes.
This modelling analysis was unable to investigate why changes in conventional risk factors do not fully reflect the differences in cardiovascular risk, or additional risk factors that should be included in revised risk equations. Further studies are required to elucidate the drug-specific mechanistic effect that results in the greater reduction in risk observed in the SUSTAIN 6 trial compared with the modelled prediction. This is challenging, as while the main target of GLP-1 is the pancreatic islet, GLP-1 receptors are expressed in the stomach, duodenum, exocrine pancreas, brain stem, thalamus, hypothalamus, hippocampus, heart, lung, and kidney, and GLP-1 binding sites have been found in muscle cells, adipocytes, and the liverCitation27. The presence of GLP-1 receptors and GLP-1 binding sites in many tissues results in a wide range of direct and indirect downstream effects from both native and exogenous GLP-1, including reduced inflammation, improved left ventricular function, increased heart rate, increased vasodilation, improved endothelial function, increased plaque stability, reduced platelet aggregation, increased natriuresis, as well as reduced blood glucose, blood pressure and postprandial lipidsCitation28. At this point in time, the relative importance of these treatment effects in terms of reducing cardiovascular risk cannot be determined, and further analysis of patient-level data from the cardiovascular outcomes trials is required. Once the key effects of GLP-1 receptor agonists in reducing cardiovascular risk have been identified, quantitative assessment will be required in order to incorporate them into health economic models.
Care should be taken when interpreting the results of modelling studies where implementations of the UKPDS Outcomes Model are used to model cardiovascular outcomes trials. A number of differences in the populations enrolled in the UKPDS and the cardiovascular outcomes trials may limit the predictive accuracy on the UKPDS Outcomes Model in the cardiovascular outcomes trial populations. The UKPDS enrolled newly diagnosed patients, who were notably younger with fewer complications at baseline than the cohort of patients typically enrolled in cardiovascular outcomes trialsCitation29. Furthermore, differences in concomitant medication use could reduce the predictive ability of the UKPDS Outcomes Model. For example, statin use was minimal in the UKPDS, as the first statin was approved for use in 1987, 10 years after the study beganCitation30. In comparison, 76.5% of patients in SUSTAIN 6 were receiving lipid-lowering medicationsCitation13. A final consideration is that new interventions for type 2 diabetes, including once-weekly semaglutide, are associated with weight loss, while patients in the UKPDS received medications that are generally associated with weight neutrality or weight gain. Consequently, changes in BMI have a limited impact in the UKPDS Outcomes ModelCitation17,Citation18. While risk equations developed based on data from the UKPDS may have limitations when used to predict outcomes in modern cohorts, models based on the UKPDS Outcomes Model have formed the cornerstone of long-term projection of outcomes in patients with type 2 diabetes in both the published literature and submissions to health technology assessment agencies.
The calibration approach used in the present analysis has a number of strengths that make it useful when assessing the cost-effectiveness of new diabetes interventions. Calibration allows modelled outcomes to exactly reflect those observed in clinical trials, and the calculation of relative risks allows the drug-specific benefit outside of conventional risk factors to be calculated. This avoids the potential for double counting of benefits if both changes in risk factors and hazard ratios taken directly from cardiovascular outcomes trials are applied. Additionally, the minimal modification required of existing health economic models of type 2 diabetes allows timely preparation of modelling analyses that are useful to healthcare payers. However, the approach is not without its weaknesses. There is uncertainty around the relative risks calculated as part of the analysis to calibrate the model, as there is uncertainty around the results observed in SUSTAIN 6 (while the reduction in stroke risk with semaglutide was statistically significant, the 95% confidence interval around the hazard ratio was 0.38 to 0.99) and further uncertainty around outcomes projected by the model. Additionally, there is uncertainty around how long the calculated relative risks should be applied for, with the sensitivity analyses showing that this could be a key driver of results, with the ICER falling as the relative risks were applied for longer. Furthermore, decisions will be required on which outcomes to calibrate. The present analysis calibrated only the predicted incidence of non-fatal stroke, based on the statistically significant reduction observed with once-weekly semaglutide in SUSTAIN 6. Calibration to multiple outcomes may give a more accurate reflection of the cost-effectiveness profile, but may be complicated by differences in endpoint definitions used in the cardiovascular outcomes trial and the health economic model.
The calibration approach used in the present analysis allows comparison of an intervention included in a cardiovascular outcomes trial with the comparator standard care arm, but a key research question is the relative cost-effectiveness of interventions assessed in different cardiovascular outcomes trials. Due to lack of active comparators in cardiovascular outcomes trials, a network meta-analysis combining data from cardiovascular outcomes trials would be required to allow comparison of these interventions. While a number of indirect comparisons combining data from cardiovascular outcomes trials have been published, conducting such a study in a robust manner is challenging due to a number of factorsCitation31–35. First, there is significant heterogeneity between the populations enrolled in the cardiovascular outcomes trials, with the percentage of the population with prior cardiovascular disease ranging from 31% in REWIND (assessing dulaglutide) to 100% in ELIXA (assessing lixisenatide), and duration of diabetes ranging from 7.1 years in EXAMINE (assessing alogliptin) to 14.9 years in PIONEER 6 (assessing oral semaglutide)Citation36–39. The cohort enrolled has been shown to be crucial to the outcomes observed in a cardiovascular outcomes trial. A matching-adjusted indirect comparison has aimed to assess how the efficacy of once-weekly semaglutide would change if the study had enrolled the REWIND populationCitation40. This analysis found that the hazard ratio for MACE for semaglutide versus placebo fell from 0.75 to 0.65, driven purely by the different trial population. A further aspect is the duration of the cardiovascular outcomes trials, which range from 1.3 years in PIONEER 6 to 5.4 years in REWINDCitation36,Citation39. It is currently unclear how the events rates observed in cardiovascular outcomes trials would change if all studies had been conducted over longer durations, with patients’ risk factors evolving over time. A final consideration is the different endpoint definitions used. An example is the definition of myocardial infarction, where silent myocardial infraction is included in a number of studies but is excluded in EMPA-REG OUTCOME (assessing empagliflozin)Citation10. Use of consistent definitions is crucial, as when the Food and Drug Administration requested a re-analysis of the primary three-point MACE endpoint from EMPA-REG OUTCOME with silent MI included, the hazard ratio for MACE increased from 0.86 to 0.92, with the difference for empagliflozin versus placebo no longer statistically significantCitation41. Any attempt to collate and combine data from across the cardiovascular outcomes trials for use in a cost-effectiveness analyses would have to adjust for multiple factors, and must find a robust method to account for these differences. With the data currently available, a cost-effectiveness analysis based on each cardiovascular outcomes trial comparing a single intervention with standard care in a specific population is possible, but a wide-ranging analysis capturing all interventions assessed in cardiovascular outcomes trials would be associated with significant uncertainty.
In addition to the calibration approach, other methods of capturing evidence from cardiovascular outcomes trials have been proposedCitation9. Modelling based on hazard ratios only with no impact of conventional risk factors for diabetes-related complications is conceptually simple and allows cardiovascular outcomes trials to be replicated. This approach was used recently in an economic evaluation conducted by NICE, which modelled a conventional care arm based on conventional risk factors using the UKPDS Outcomes Model 2 and then applied hazard ratios for myocardial infarction, stroke, ischaemic heart disease, and heart failure to model glucagon-like peptide-1 (GLP-1) receptor agonists, sodium-glucose cotransporter-2 (SGLT-2) inhibitors and dipeptidyl peptidase-4 (DPP-4) inhibitorsCitation42. However, this approach only allows endpoints directly measured in the trial to be included, and there is significant uncertainty around the duration of impact of medications and, therefore, the interval for which the hazard ratios should be applied. Development of new risk equations, potentially capturing new risk factors, would represent an attractive option, aiming to produce a generalizable model that could be applied to any medication. However, development of such a model may be challenging. The statistical analysis would require pooling of patient-level data from multiple cardiovascular outcomes trials, and interpretation of which risk factors (both established and new) have a causal relationship with micro- and macrovascular diabetes-related complications. While the follow-up period of the cardiovascular outcomes trials is relatively long compared with phase 2 or 3 studies, the study durations are around 15 years shorter than the UKPDS. Additionally, validation would have to be conducted across all cardiovascular outcomes trials to confirm the accuracy of model predictions in all populations.
Conclusions
The requirement for calibration of the IQVIA Core Diabetes Model to replicate the non-fatal stroke outcomes observed in SUSTAIN 6 suggests that the reductions in risk of cardiovascular complications observed with once-weekly semaglutide versus standard care cannot be fully explained by differences in conventional risk factors, and therefore existing models of type 2 diabetes may not be able to accurately predict event rates observed in cardiovascular outcomes trials, and additional adjustment is required in an attempt to improve performance. Accurate estimation of the risk of diabetes-related complications using methods such as calibration is important to ensure appropriate cost-effectiveness analyses are conducted, and to therefore optimize decision making by healthcare payers, as calibration can have an important impact on the cost-effectiveness profile of diabetes interventions. The analysis suggests that once-weekly semaglutide is likely to be a cost-effective treatment option compared with standard care for people with type 2 diabetes at high risk of cardiovascular disease in the UK, when the health-economic model is calibrated to capture the cardioprotective effect observed in the SUSTAIN 6 cardiovascular outcomes trial.
Transparency
Declaration of financial/other relationships
B Chubb and A Acs are employees of Novo Nordisk A/S. S Berry is an employee of Novo Nordisk Ltd. E Falla and A Verma are employees of IQVIA, which received consulting fees from Novo Nordisk Ltd to support preparation of the analysis. B Hunt and S Malkin are employees of Ossian Health Economics and Communications, which received consulting fees from Novo Nordisk Ltd to support preparation of the analysis. The authors have no other relevant affiliations or financial involvement with any organization or entity with a financial interest in or financial conflict with the subject matter or materials discussed in the manuscript apart from those disclosed. Peer reviewers on this manuscript have no relevant financial or other relationships to disclose.
Author contributions
All named authors meet the International Committee of Medical Journal Editors (ICMJE) criteria for authorship for this article, take responsibility for the integrity of the work as a whole, and have given their approval for this version to be published. The analysis was conceived and designed by all others. The analysis was performed by E Falla and A Verma. The manuscript was drafted by B Hunt, and critically reviewed by all other authors.
Acknowledgements
None provided.
Data availability statement
All data sets generated in the analysis are included in the manuscript.
Additional information
Funding
References
- American Diabetes Association Professional Practice Committee. 10. Cardiovascular disease and risk management: standards of medical care in diabetes-2022. Diabetes Care. 2022;45(Suppl 1):S144–S174.
- Draznin B, Aroda VR, Bakris G, et al. 11. Chronic kidney disease and risk management: standards of medical care in diabetes-2022. Diabetes Care. 2022;45(Suppl 1):S175–S184.
- Draznin B, Aroda VR, Bakris G, et al. 12. Retinopathy, neuropathy, and foot care: standards of medical care in diabetes-2022. Diabetes Care. 2022;45(Suppl 1):S185–S194.
- National Institute for Health and Care Excellence. Type 2 diabetes in adults: management [NG28]; [updated 2021 Nov; cited 2021 Nov]. Available from: https://www.nice.org.uk/guidance/ng28/chapter/1-Recommendations#blood-glucose-management-2
- Buse JB, Wexler DJ, Tsapas A, et al. 2019 Update to: management of hyperglycaemia in type 2 diabetes, 2018. A consensus report by the American Diabetes Association (ADA) and the European Association for the Study of Diabetes (EASD). Diabetologia. 2020;63(2):221–228. doi: 10.1007/s00125-019-05039-w.
- National Institute for Health and Care Excellence. The guidelines manual; [published 2012 Nov 30; cited 2021 Nov]. Available from: https://www.nice.org.uk/process/pmg6/resources/the-guidelines-manual-pdf-2007970804933
- Kieffer CM, Robertson AS. Impact of FDA-required cardiovascular outcome trials on type 2 diabetes clinical study initiation from 2008 to 2017. Ther Innov Regul Sci. 2019;2168479019860122. doi: 10.1177/2168479019860122.
- Cefalu WT, Kaul S, Gerstein HC, et al. Cardiovascular outcomes trials in type 2 diabetes: where do We go from here? Reflections from a diabetes care editors’ expert forum. Diabetes Care. 2018;41(1):14–31. doi: 10.2337/dci17-0057.
- Willis M, Asseburg C, Nilsson A, et al. Challenges and opportunities associated with incorporating new evidence of drug-mediated cardioprotection in the economic modeling of type 2 diabetes: a literature review. Diabetes Ther. 2019;10(5):1753–1769. doi: 10.1007/s13300-019-00681-4.
- Si L, Willis MS, Asseburg C, et al. Evaluating the ability of economic models of diabetes to simulate new cardiovascular outcomes trials: a report on the ninth mount hood diabetes challenge. Value Health. 2020;23(9):1163–1170. doi: 10.1016/j.jval.2020.04.1832.
- Zinman B, Wanner C, Lachin JM, et al. Empagliflozin, cardiovascular outcomes, and mortality in type 2 diabetes. N Engl J Med. 2015;373(22):2117–2128. doi: 10.1056/NEJMoa1504720.
- Neal B, Perkovic V, Mahaffey KW, et al. Canagliflozin and cardiovascular and renal events in type 2 diabetes. N Engl J Med. 2017;377(7):644–657. doi: 10.1056/NEJMoa1611925.
- Marso SP, Bain SC, Consoli A, et al. Semaglutide and cardiovascular outcomes in patients with type 2 diabetes. N Engl J Med. 2016;375(19):1834–1844. doi: 10.1056/NEJMoa1607141.
- Palmer AJ, Roze S, Valentine WJ, et al. The CORE diabetes model: projecting long-term clinical outcomes, costs and cost-effectiveness of interventions in diabetes mellitus (types 1 and 2) to support clinical and reimbursement decision-making. Curr Med Res Opin. 2004;20(Suppl 1):S5–S26. doi: 10.1185/030079904X1980.
- Palmer AJ, Roze S, Valentine WJ, et al. Validation of the CORE diabetes model against epidemiological and clinical studies. Curr Med Res Opin. 2004;20(Suppl 1):S27–S40.
- McEwan P, Foos V, Palmer JL, et al. Validation of the IMS CORE diabetes model. Value Health. 2014;17(6):714–724. doi: 10.1016/j.jval.2014.07.007.
- Clarke PM, Gray AM, Briggs A, et al. A model to estimate the lifetime health outcomes of patients with type 2 diabetes: the United Kingdom prospective diabetes study (UKPDS) outcomes model (UKPDS no. 68). Diabetologia. 2004;47(10):1747–1759. doi: 10.1007/s00125-004-1527-z.
- Hayes AJ, Leal J, Gray AM, et al. UKPDS outcomes model 2: a new version of a model to simulate lifetime health outcomes of patients with type 2 diabetes mellitus using data from the 30 year United Kingdom prospective diabetes study: UKPDS 82. Diabetologia. 2013;56(9):1925–1933. doi: 10.1007/s00125-013-2940-y.
- D’Agostino RB, Russell MW, Huse DM, et al. Primary and subsequent coronary risk appraisal: new results from the Framingham study. Am Heart J. 2000;139(2):272–281. doi: 10.1016/S0002-8703(00)90236-9.
- National Institute for Health and Care Excellence. Guide to the methods of technology appraisal; 2013 [cited 2021 Nov]. Available from: https://www.nice.org.uk/process/pmg9/resources/guide-to-the-methods-of-technology-appraisal-2013-pdf-2007975843781
- National Institute for Health and Care Excellence. Type 2 diabetes in adults: management, appendix F: full health economics report. 2015 [cited 2021 Nov]. Available from: https://www.nice.org.uk/guidance/ng28/evidence/appendix-f-full-health-economics-report-pdf-78671532601
- Johansen P, Chubb B, Hunt B, et al. Evaluating the long-term cost-effectiveness of once-weekly semaglutide versus once-daily liraglutide for the treatment of type 2 diabetes in the UK. Adv Ther. 2020;37(5):2427–2441. doi: 10.1007/s12325-020-01337-7.
- Bain SC, Hansen BB, Malkin SJP, et al. Oral semaglutide versus empagliflozin, sitagliptin and liraglutide in the UK: long-term cost-effectiveness analyses based on the PIONEER clinical trial programme. Diabetes Ther. 2020;11(1):259–277. doi: 10.1007/s13300-019-00736-6.
- Capehorn M, Hallén N, Baker-Knight J, et al. Evaluating the cost-effectiveness of once-weekly semaglutide 1 mg versus empagliflozin 25 mg for treatment of patients with type 2 diabetes in the UK setting. Diabetes Ther. 2021;12(2):537–555. doi: 10.1007/s13300-020-00989-6.
- Beaudet A, Clegg J, Thuresson PO, et al. Review of utility values for economic modeling in type 2 diabetes. Value Health. 2014;17(4):462–470. doi: 10.1016/j.jval.2014.03.003.
- Evans M, Khunti K, Mamdani M, et al. Health-related quality of life associated with daytime and nocturnal hypoglycaemic events: a time trade-off survey in five countries. Health Qual Life Outcomes. 2013;11(1):90. doi: 10.1186/1477-7525-11-90.
- Ahrén B. GLP-1 and extra-islet effects. Horm Metab Res. 2004;36(11-12):842–845. doi: 10.1055/s-2004-826173.
- Drucker DJ. The cardiovascular biology of glucagon-like peptide-1. Cell Metab. 2016;24(1):15–30. doi: 10.1016/j.cmet.2016.06.009.
- UK prospective diabetes study. IV. Characteristics of newly presenting type 2 diabetic patients: male preponderance and obesity at different ages. Multi-center study. Diabet Med. 1988;5(2):154–159.
- Hajar R. Statins: past and present. Heart Views. 2011;12(3):121–127. doi: 10.4103/1995-705X.95070.
- Fei Y, Tsoi MF, Cheung BMY. Cardiovascular outcomes in trials of new antidiabetic drug classes: a network meta-analysis. Cardiovasc Diabetol. 2019;18(1):112. doi: 10.1186/s12933-019-0916-z.
- Alfayez OM, Al Yami MS, Alshibani M, et al. Network meta-analysis of nine large cardiovascular outcome trials of new antidiabetic drugs. Prim Care Diabetes. 2019;13(3):204–211. doi: 10.1016/j.pcd.2019.01.003.
- Yamada T, Wakabayashi M, Bhalla A, et al. Cardiovascular and renal outcomes with SGLT-2 inhibitors versus GLP-1 receptor agonists in patients with type 2 diabetes mellitus and chronic kidney disease: a systematic review and network meta-analysis. Cardiovasc Diabetol. 2021;20(1):14. doi: 10.1186/s12933-020-01197-z.
- Kristensen SL, Rørth R, Jhund PS, et al. Cardiovascular, mortality, and kidney outcomes with GLP-1 receptor agonists in patients with type 2 diabetes: a systematic review and meta-analysis of cardiovascular outcome trials. Lancet Diabetes Endocrinol. 2019;7(10):776–785. doi: 10.1016/S2213-8587(19)30249-9.
- Zheng SL, Roddick AJ, Aghar-Jaffar R, et al. Association between use of sodium-glucose cotransporter 2 inhibitors, glucagon-like peptide 1 agonists, and dipeptidyl peptidase 4 inhibitors with All-Cause mortality in patients with type 2 diabetes: a systematic review and meta-analysis. JAMA. 2018;319(15):1580–1591. doi: 10.1001/jama.2018.3024.
- Gerstein HC, Colhoun HM, Dagenais GR, et al. Dulaglutide and cardiovascular outcomes in type 2 diabetes (REWIND): a double-blind, randomised placebo-controlled trial. Lancet. 2019;394(10193):121–130. doi: 10.1016/S0140-6736(19)31149-3.
- Pfeffer MA, Claggett B, Diaz R, et al. Lixisenatide in patients with type 2 diabetes and acute coronary syndrome. N Engl J Med. 2015;373(23):2247–2257. doi: 10.1056/NEJMoa1509225.
- White WB, Cannon CP, Heller SR, et al. Alogliptin after acute coronary syndrome in patients with type 2 diabetes. N Engl J Med. 2013;369(14):1327–1335. doi: 10.1056/NEJMoa1305889.
- Husain M, Birkenfeld AL, Donsmark M, et al. Oral semaglutide and cardiovascular outcomes in patients with type 2 diabetes. N Engl J Med. 2019;381(9):841–851. doi: 10.1056/NEJMoa1901118.
- Evans LM, Mellbin L, Johansen P, et al. A population-adjusted indirect comparison of cardiovascular benefits of once-weekly subcutaneous semaglutide and dulaglutide in the treatment of patients with type 2 diabetes, with or without established cardiovascular disease. Endocrinol Diabetes Metab. 2021;4(3):e00259.
- FDA Briefing Document, Endocrine and Metabolic Drug Advisory Committee. Meeting; 2016 [cited 2021 Nov]. Available from: https://www.fda.gov/files/advisory%20committees/published/FDA-Briefing-Information-for-the-June-28–2016-Meeting-of-the-Endocrinologic-and-Metabolic-Drugs-Advisory-Committee.pdf
- National Institute for Health and Care Excellence. Type 2 diabetes in adults: management (update) Health economic model report. 2022 [cited 2021 Nov]. Available from: https://www.nice.org.uk/guidance/ng28/evidence/health-economic-model-report-pdf-10959500845
- Alva ML, Gray A, Mihaylova B, et al. The impact of diabetes-related complications on healthcare costs: new results from the UKPDS (UKPDS 84). Diabet Med. 2015;32(4):459–466. doi: 10.1111/dme.12647.
- Danese M, Gleeson M, Kutikova L, et al. Costs of cardiovascular (CV) events in the United Kingdom (UK) using real-world data. Value Health. 2015;18:A335–A766.
- NHS England. National tariff payment system 2020/21; 2020; cited 2021 Dec 10]. Available from: https://www.england.nhs.uk/publication/national-tariff-payment-system-documents-annexes-and-supporting-documents/
- Kent S, Schlackow I, Lozano-Kuhne J, et al. What is the impact of chronic kidney disease stage and cardiovascular disease on the annual cost of hospital care in moderate-to-severe kidney disease? BMC Nephrol. 2015;16:65. doi: 10.1186/s12882-015-0054-0.
- Chubb B, Tikkanen C. The cost of non-severe hypoglycaemia in Europe. Value Health. 2015;18(7):A611. doi: 10.1016/j.jval.2015.09.2118.
- Hammer M, Lammert M, Mejias SM, et al. Costs of managing severe hypoglycaemia in three european countries. J Med Econ. 2009;12(4):281–290. doi: 10.3111/13696990903336597.
- Monthly Index of Medical Specialities. 2021 [cited 2021 Dec]. Available from: https://www.mims.co.uk/.
- Ghatnekar O, Willis M, Persson U. Cost-effectiveness of treating deep diabetic foot ulcers with promogran in four European countries. J Wound Care. 2002;11(2):70–74. doi: 10.12968/jowc.2002.11.2.26675.