
Abstract
Aims
Out-of-pocket (OOP) costs may constitute a substantial financial burden to patients diagnosed with cancer. Earlier stage diagnosis and treatment of cancers may promote decreased morbidity and mortality, subsequently also lowering costs. To better understand costs experienced by patients with cancer, OOP costs by stage post-diagnosis were estimated.
Materials and methods
A retrospective analysis was conducted using Optum’s de-identified Integrated Claims-Clinical dataset with Enriched Oncology, which includes data from commercially insured members (June 1, 2015–July 31, 2020). Mean annual and cumulative OOP costs (co-pay + co-insurance + deductible) (2020 USD) were reported through a 3-year period post-cancer diagnosis among adult commercially insured members (not including Medicare Advantage members) diagnosed with staged breast, cervical, colorectal, lung, ovarian, or prostate cancer between January 1, 2016 and June 30, 2020 with continuous enrollment for ≥1-month post-diagnosis.
Results
A total of 7,494 eligible members were identified who were diagnosed with breast, cervical, colorectal, lung, ovarian, or prostate cancer. A greater proportion of OOP costs were incurred in year 1 post-diagnosis but remained relatively high through year 3 post-diagnosis. Cumulative mean OOP costs were as high as $35,243 (lung stage IV) per commercially insured patient by year 3 post-diagnosis and were generally higher among those diagnosed at later stages (III/IV) than those diagnosed at earlier stages (I/II) across all cancers.
Limitations
Generalizability of these results is limited to those with commercial health insurance coverage. Additionally, cancer staging was dependent on accuracy of staging as recorded in the electronic medical record and as determined by Optum’s proprietary algorithm using natural language processing.
Conclusion
Cumulative mean OOP costs among commercially insured patients during the 3-year period post-cancer diagnosis were substantial and generally higher among those with later stage cancer diagnoses. Diagnosis of cancer at earlier stages may allow for more timely treatment and lessen patient OOP costs.
PLAIN LANGUAGE SUMMARY
Patients diagnosed with cancer may face significant out-of-pocket costs (expenses that are not reimbursed by insurance) for care. However, lower costs may be achieved if the cancer is identified, diagnosed, and treated at earlier stages before the cancer tumor can grow or spread to other parts of the body. In this study, we examined patient out-of-pocket costs on an annual basis and over a 3-year period by cancer stage (I–IV) at diagnosis. Data were obtained from a large healthcare database (Optum’s Claims-Clinical dataset with Enriched Oncology) that has administrative claims with out-of-pocket cost records as well as health records to determine cancer type and stage at diagnosis. Out-of-pocket costs recorded in the database included the co-pay, co-insurance, and deductible. Data from 7,494 adult patients with commercial insurance (not including Medicare Advantage) who were newly diagnosed with breast, cervical, colorectal, lung, ovarian, or prostate cancer between January 1, 2016 and June 30, 2020 were identified and analyzed. Patients incurred most of their out-of-pocket costs during the first year after a cancer diagnosis and these costs remained high for an additional 2 years. In general, patients diagnosed with cancer at later stages (III/IV) had a higher 3-year total out-of-pocket cost compared to those diagnosed at earlier stages (I/II) and this reached as high as $35,243 among patients diagnosed with stage IV lung cancer. Diagnosis of cancer at an earlier stage may reduce out-of-pocket costs for patients.
Introduction
The disease burden attributable to cancer is significant in the United States (US), with national data estimating one in two men and one in three women will develop an invasive cancer within their lifetimeCitation1. In addition, over 1.9 million individuals are estimated to have been newly diagnosed with cancer in 2022Citation2. The economic burden associated with cancer is also substantial in the US, with estimated medical costs of $183 billion in 2015, which are projected to increase to $246 billion by 2030Citation3. Additionally, patient financial burden is also notable, with an estimated $16.2 billion in cancer-related out-of-pocket costs in 2019Citation4.
Moreover, on an individual level, a cancer diagnosis can result in significant financial burden and distress for patients. A recent claims analysis on the cost burden of breast, lung, and colorectal cancer care among those with employer-sponsored insurance found that cancer patients incurred an average of $3,600 to $5,500 in OOP costs (excluding premiums) in the first year post-diagnosis and that these costs may persist beyond that timeframeCitation5. Another retrospective cohort study data utilizing the Health Retirement Study found $1,058 higher mean OOP costs among cancer patients versus those without a history of cancer and the results suggested that even cancer patients with insurance coverage were not protected from experiencing OOP costsCitation6. As many individuals in the US may not be prepared financially to cope with unexpected costs such as a health emergency, OOP costs may present an extreme economic stressor on patients diagnosed with cancer. One study found that almost half (46%) of the US households who experienced a health emergency or job loss in the year prior did not have enough cash on hand to cover an unexpected $400 expenseCitation7. Continued OOP costs well beyond $400 may push some patients with cancer into financial toxicity, which may subsequently lead to a decline in quality-of-life and emotional distress, and reduced treatment adherence and access, which further contribute to disparities in care, ultimately leading to worse clinical outcomesCitation8–19. An estimated 50% of patients with cancer experienced high economic burdenCitation20 and an estimated 42% of patients newly diagnosed with cancer depleted their life assets within 2 yearsCitation21. In line with this data, a recent survey among individuals with a breast cancer diagnosis showed almost half (47%) indicated significant or catastrophic burden in relation to their OOP costs and 37% reduced spending on basic necessities, including food and housingCitation22. Medical debt related to cancer care can last for years and, as detailed in another recent survey among cancer patients and survivors, of the 51% percent reporting medical debt, 53% faced collection and 46% had their credit score negatively impactedCitation18.
The stage at the time of cancer diagnosis may impact overall healthcare costs. In a recently conducted retrospective claims analysis, mean annual and cumulative healthcare costs through year 4 post-cancer diagnosis were significantly higher among those diagnosed at later versus earlier cancer stagesCitation23. The increase in overall healthcare costs by stage of diagnosis suggests that patient OOP costs may follow a similar pattern, with greater OOP costs experienced by those diagnosed at a later versus earlier cancer stage.
Published evidence on patient economic burden and the OOP cost of cancer varies widely in methodology, with limited data on comprehensive OOP costs across cancer types by stage and coverage greater than 1 year after diagnosis. In this analysis, the objective is to estimate the annual and cumulative OOP costs from diagnosis through 3 years post-diagnosis by cancer type and stage in order to better understand the OOP contributions to patient financial burden by stage at diagnosis.
Methods and materials
Using Optum’s de-identified Integrated Claims-Clinical dataset with Enriched Oncology, which included health record and medical and pharmacy claims data from commercially insured members (June 1, 2015–July 31, 2020), a retrospective analysis was conducted. Analyses were initiated upon determination of the Western Institutional Review Board (WIRB)-Copernicus Group Institutional Review Board (WCG IRB) that this research was exempt on December 9, 2021. Commercially insured adult members (≥ 18 years of age; no upper limit on age) with newly diagnosed and staged solid tumor cancer and who had continuous enrollment for at least 30-days post-diagnosis were included. Only members with private commercial insurance were included; thus, those insured with non-private commercial insurance (Medicare Advantage) or other types of non-commercial coverage (e.g. Medicare or Medicaid) were not included. The study analysis results for those commercially insured members were further restricted to those diagnosed between January 1, 2016 and June 30, 2020. Results for six of the 18 solid tumor cancers assessed – breast, cervical, colorectal, lung, ovarian, or prostate cancer (cancer types with greatest sample size) are presented in greater detail. This focus on more recent data among cancer types with a larger sample size was intended to better reflect current OOP costs and trends.
Patients were categorized at the point of cancer diagnosis into cancer types and stages, based on Optum’s Enriched Oncology data. Data reflecting cancer type and stage at diagnosis was leveraged which was based on Optum’s iterative natural language processing (NLP) via clinically-validated provider notes located in the electronic health records and joined by patient identification number to claims data. Based on a supervised machine learning model informed by NLP scientists and clinical experts, Optum NLP extracted additional data from the unstructured clinical notesCitation24. Cancer groups were determined from listed neoplasm type and histology data per published guidelines such as those reported by the National Institutes of Health and the National Cancer Institute Surveillance Epidemiology and End Results Program. Stages were captured in the data either as numbered stages (I–IV) or per the American Joint Committee on Cancer tumor (T), node (N), and metastasis (M) (TNM) systemCitation25–27. In the numbered staging, I–III represents that cancer is present, with a higher number indicative of a larger tumor and increased expansion to neighboring tissues, and IV representing advanced, metastatic cancer with a further spread throughout the body. Based on oncology clinical experts’ recommendation, number staging was assigned for patients with only TNM values as follows: M0 and N0 and T1 was converted to stage I; M0 and N1/N2 and/or T2 was considered equivalent to stage II; M0 and N3 and/or T3/T4 was reclassified as stage III; and M1 was recategorized as stage IV. Converting the staging data to one system allowed for a larger analytic sample size.
Upon identifying eligible patients with staging data available in Optum’s Enriched Oncology data, the claims data associated with these patients in the Integrated Claims-Clinical dataset were linked and assessed to identify the date of cancer diagnosis (index date). The index date was defined as the earliest claim date in the medical records with an International Classification of Diseases (ICD)-9-Clinical Modification (CM) or ICD-10-CM cancer diagnosis code. When a > 365-day (year) gap occurred in claims with ICD-9/10 cancer diagnosis codes, the claim date closest to the date indicated in the cancer stage note was applied. Using the index date as a reference, the pre-index and post-index periods of assessment were created. Clinical characteristics identified in the 6-month pre-index period terminating the day before the index date were used for Charlson Comorbidity Index (CCI) calculations. Patient demographics were assessed at the time of the index date. The post-index period varied in length from a minimum requirement of 1 month after the index date up to 3-years or ending earlier in the case of patient death, termination of continuous enrollment, or conclusion of the study period (June 30, 2020). The OOP costs were calculated in the post-index period.
Out-of-pocket costs were defined as the sum of copay, coinsurance, and deductible costsCitation28 for healthcare services covered by the patient’s individual commercial plan and identified in either the pharmacy or medical (physician or facility) data (e.g. office visits, prescription drugs, and other inpatient and outpatient services). Other potential OOP cost components not available in the claims data analyzed, such as expenses for transportation, accommodation, caregivers, and childcare services, were not included in OOP cost calculations. Out-of-pocket costs were calculated among patients newly diagnosed with cancer on an annual and cumulative basis for up to 3 years post-index date. Population characteristics along with annual and cumulative OOP costs among commercially insured patients were analyzed descriptively and stratified by cancer type and stage up to year 3 post-diagnosis. For eligible patients with commercial insurance coverage (not including Medicare Advantage), the mean OOP costs were calculated monthly and were then added together for the time period of interest. To minimize selection bias that may be introduced by limiting to patients with a minimum follow-up period, OOP cost eligibility was considered on a monthly basis. This approach helped expand the analysis to capture most of cancer patients despite highly variable follow-up post cancer diagnosis and minimized the risk of bias to potentially favor patients with better outcomes due to longer continuous health insurance coverage. Log transformation of OOP costs were not performed based on the descriptive nature of the analyses and to preserve interpretability. No multivariate regression models were conducted due to both the limited availability of explanatory data and because exploratory subgroup analyses on data available (age, geographic region, CCI) suggested that this method would not be appropriate (e.g. inconsistent trends, lack of statistical significance, insufficient sample size).
Results
Among commercially insured members diagnosed with breast, cervical, colorectal, lung, ovarian, and prostate cancer from 2016–2020, 7,495 eligible members were identified for inclusion in this analysis (breast: 3,686 [49.2%]; cervical: 714 [9.5%]; colorectal: 1,010 [13.5%]; lung: 1,010 [13.5%]; ovarian: 322 [4.3%]; prostate: 753 [10.0%]) (Supplemental Tables S1–S6). Across the cancers reported, the mean age ranged from 48 years (ovarian stage I) to 62 years (prostate stage IV). The percentage of females ranged from 41.5% (colorectal stage IV) to 63.5% (lung stage I) among the cancer types not exclusively one sex. Most individuals resided in the Midwest (24.1–44.8%) or Northeast (24.1–69.0%) geographic regions. The mean CCI was below or equal to a score of 1.4 across cancers reported.
Table 1. Out-of-pocket cost in commercially insured patients by cancer type and stage, year 1 post-diagnosis.
Table 2. Out-of-pocket cost in commercially insured patients by cancer type and stage, year 2 post-diagnosis.
Table 3. Out-of-pocket cost in commercially insured patients by cancer type and stage, year 3 post-diagnosis.
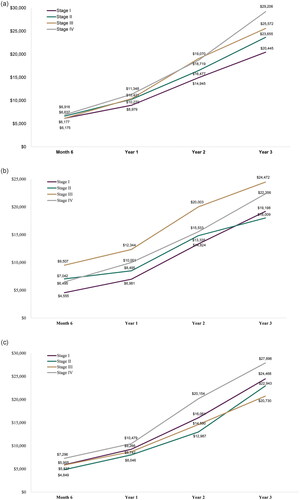
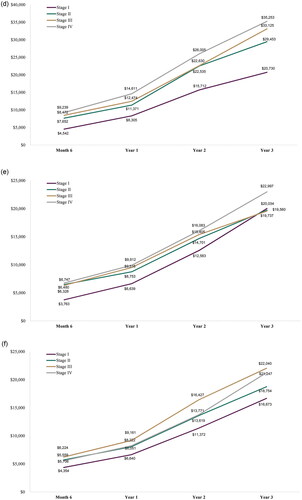
Cumulative OOP costs by the end of year 3 post-diagnosis ranged from an average of $16,673 (stage I prostate cancer) to $35,253 (stage IV lung cancer) among the cancers reported (). In general, mean cumulative OOP costs were greater by the end of year 3 post-diagnosis for those diagnosed at stage III or IV as compared to stage I and II. This trend was consistent across the 6-month, 1-year, and 2-year timepoints for mean cumulative OOP costs, with a few fluctuations among the cancer types reported.
Figure 1. Cumulative out-of-pocket cost by stage at diagnosis. (a) Breast cancer; (b) Cervical cancer; (c) Colorectal cancer; (d) Lung cancer; (e) Ovarian cancer; and (f) Prostate cancer.
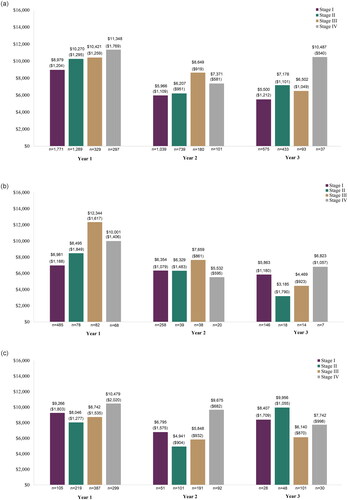
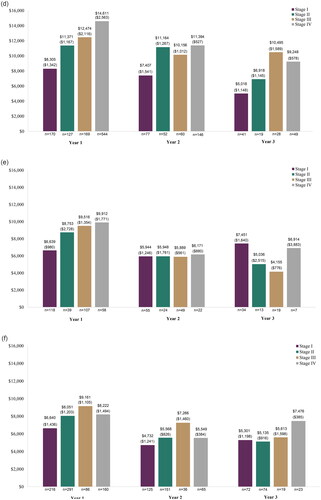
When evaluating the mean OOP costs annually by stage, similar trends were generally found with increased mean annual OOP costs among those diagnosed at stage III or IV as compared to stage I and II in year 1, and with fluctuations in years 2 and 3 (; ). Across the cancer types reported, mean OOP costs were often highest in year 1 and then decreased in subsequent years.
Figure 2. Out-of-pocket cost by stage at diagnosis, years 1–3 post-diagnosis. (a) Breast cancer; (b) Cervical cancer; (c) Colorectal cancer; (d) Lung cancer; (e) Ovarian cancer; and (f) Prostate cancer.
In assessment of the full list of 18 solid cancer types, mean OOP cost in year 1 ranged from $2,754 (stage I anal cancer) to $25,876 (stage IV vaginal cancer) (Supplemental Table S7; year 2 and 3 full list: Supplemental Tables S8 and S9). Trends of increased mean OOP costs among patients diagnosed with stage III or IV cancer compared to I and II was also observed among the other 12 solid cancers evaluated, with the exceptions of testicular, thyroid, and ureter/urinary bladder cancer. However, due to small sample sizes, these results should be interpreted with caution.
Discussion
Results of this analysis fill an evidence gap in patient OOP costs by cancer type and stage. Most published literature on OOP costs among US cancer patients varies widely in methodology, are not stratified by cancer stage, and are reported in only a single stage for one or a few cancer types. A few case studies report a breakdown by select stages and cancer types. However, these are typically based on assumed data inputs for scenarios given a specific type of health plan with sample characteristics and do not reflect OOP cost calculations using real-world data. A recently conducted systematic literature review on the OOP burden of cancer care estimated that adult patients and caregivers in the US were faced with a mean of $300 (2018 USD) per month (range: $180–$2,600 per month) in OOP costsCitation29. While OOP costs were not detailed by cancer type and stage (mean costs likely more reflective of earlier stage cancers), and included data from some older studies (US study publication year range: 1979–2018), these estimates extrapolated out over 3 years seem largely consistent with the results of this study. Published research examining an array of cancers, while not directly comparable due to the population assessed (Medicare) and the focus on phases of care (initial, continuing, and end-of-life) rather than stage at cancer diagnosis, supports the finding that OOP costs are generally higher for patients diagnosed at later stages than those diagnosed at an earlier stageCitation4. Compared to a study that examined cumulative OOP costs among patients with breast, colorectal, or lung cancer with employer-sponsored insurance over a 4-year time frame ($7,500–$11,000) in the USCitation5, the mean OOP costs in this analysis were somewhat higher (almost 2× or more). However, the aforementioned study was based on older data (2011–2014), with a mix of patients diagnosed at unknown stages who had potentially more comprehensive insurance benefits and were likely healthier and less costly based on continuous insurance coverage through year 4 post-diagnosis. Of note, one trend that is consistent between the two studies is greater average OOP costs in year 1 post-diagnosis that then decreased through the following few years. Furthermore, results of this study on patient OOP are consistent in trends with those observed in a previous study for overall healthcare costsCitation23, with greater annual and cumulative costs among those diagnosed at a later cancer stage (III/IV) versus an earlier one (I/II).
The OOP costs in this study included the copay, co-insurance, and deductible; insurance premiums and other unrecorded OOP costs, such as transportation-related or household or other support costs were not captured. Thus, OOP cost estimates are conservative and may not reflect the full financial burden to patients. These estimates also focus on the more immediate timeframe and not the potential long-term impacts, such as on retirement savings. Although the direct long-term impact of OOP costs was not assessed in this study, literature shows that cancer patients or survivors in comparison to those with similar key characteristics but without cancer were more likely to file for bankruptcy (2.7 × [any cancer] to 3.8 × [lung cancer])Citation30 and had lower asset ownership and lower net worthCitation31. Some research suggests being a younger and non-White patient with cancer may increase the risk of filing for bankruptcyCitation32. While average OOP costs in year 1 post-diagnosis remain below $15,000 in the cancers of interest, some patients face extreme economic burden, with year 1 costs reaching several hundred thousand dollars (). Given that many US households (46%) do not have enough cash on hand to cover an unexpected $400 expenseCitation7, average OOP costs consistent with estimates from this study could impose a significant financial burden. Patients over the age of 65, who are more likely to rely on a fixed and/or smaller income, may be more burdened by OOP cost and at greater risk to experience financial toxicity. As a potential mediator of disparities in care and clinical trial access, financial toxicity can heighten existing inequities and further the divide in cancer treatmentCitation8,Citation33,Citation34. Medical debt among cancer patients and survivors can also cause delays or avoidance of care or limit treatment options due to costCitation18. Out-of-pocket costs are associated with delayed treatment initiation, early discontinuation of medication, and poor adherenceCitation9,Citation35–37.
In addition to low-income households, catastrophic OOP expenses may also apply to middle-income Americans with employer insurance coverageCitation38. Among cancer patients, private health insurance plans with high cost sharing, such as high-deductible plans, may also offer poor protection against unexpected expensesCitation39.
Details on plan types and features are limited in the data available to the researchers from Optum. Commercial plan types represented in the data from United Healthcare are reported as follows by Optum: 53.0% point of service, 17.9% health maintenance organization, 12.4% other, 10.6% exclusive provider organization, 5.9% preferred provider organization, and 0.3% indemnity. Additionally, 21.1% of the plan members had a health savings account (15.6%) or a health reimbursement agreement (5.5%), which is a common feature of high-deductible health plans. Future research into plan types and features such as potential cost component drivers (e.g. co-pays, co-insurance, deductibles) of total OOP expenses is needed to provide insight into what insurance plan types and features (e.g. high or low deductible) may help minimize patient OOP burden. Furthermore, scenario analyses by continuous coverage length may also be warranted to add insight into how the length and continuity of insurance coverage may impact OOP burden in patients.
A multitude of factors and potential interactions of these factors not assessed by this study of claims data may play a part in the patterns observed for diagnosis of cancer at a later stage and outcomes, such as OOP costs. To better identify and understand the nuances of sociodemographic (e.g. age, gender, race/ethnicity, geography, income, insurance access and type, education), health (e.g. comorbidities, performance status), psychosocial (e.g. norms around health-seeking behavior) and other disease (e.g. presenting nature of symptoms) factors’ relationship with stage at cancer diagnosis and/or OOP costs, additional studies using data with more expansive capture of such factors and of sufficient sample size are important.
The current analysis captures total OOP cost based on the stage assigned to the cancer at diagnosis but does not include assessment of how that cost may differ during later periods of remission or progression or by subgroup populations based on their later remission or progression status. While the current data available to the researchers does not allow for these analyses, they do offer an interesting avenue to explore when more extensive oncology data is available from Optum in the future.
Some data captured in this study were during lock-downs and restrictions to access to healthcare in response to the COVID-19 pandemic (March 1, 2020 to June 30, 2020). An exploratory analysis was conducted to assess how much of this data contributed to cost calculations. Results suggest that this data is minimal, with only 2.0–5.4% of patients with at least a month cost from this period contributing to the year 1 cost data and the month cost contributing less than 1% of the total year 1 cost, except in the case for month 1 costs, where the contribution rose to 2.1%.
Limitations are generally consistent to those for retrospective analyses. The generalizability of these results is limited to those with private commercial health insurance coverage provided through United Healthcare only. The commercially insured population included in this study may have a higher proportion of younger and employed individuals in comparison to a population insured by Medicare or Medicare Advantage which was not included in the analysis that typically sets eligibility at age 65 years or older. To better understand the representativeness of the study population to the national cancer population, stage, age, and gender distribution by cancer type (breast, cervical, colorectal, lung, ovarian, and prostate) in this study was compared to national data from the United States Cancer Statistics (USCS) data visualization toolCitation40 produced by the Centers for Disease Control and Prevention (CDC) and the National Cancer Institute (NCI) which sources data from the CDC’s National Program of Cancer Registries (NPCR) and the NCI’s Surveillance, Epidemiology, and End Results (SEER) Program. Although the data is not directly comparable, trends in distributions by stage, age, and gender were relatively similar between the study and USCS data, with some deviations likely a reflection of the commercially insured population analyzed in this study. Deviations of note were the following: (1) the study data seemed to capture a smaller proportion of stage I patients for some cancers (breast, colorectal, lung, prostate) in comparison to those noted as “localized” in the USCS data and (2) while the study data mean age was representative of close to 40–50% distribution in the USCS data for most cancers, a few cancers skewed slightly younger (breast and colorectal) or older (cervical) compared to the UCSC data. While this study is limited to United Healthcare patient data that allows linkage of oncology staging, electronic medical records and claims, United Healthcare is the largest healthcare company in the United States by revenue and the study sample is sourced from 24 million linked records across the United States. Additionally, cancer staging was dependent on the accuracy of staging as recorded in the electronic medical record and as determined by Optum’s proprietary algorithm using natural language processing. Due to limited numbers of patients having cancer staging data documented and those patients also having OOP costs recorded, sample sizes for this analysis stratified by stage are relatively small for some cancer types, especially as analyses were extended past year 1. Results should be interpreted taking these sample sizes into account. Furthermore, OOP value standard deviations and ranges were large with data skewed to the right (mean larger than the median). Mean OOP values should be assessed within the context of the data distribution.
Conclusion
For patients with commercial insurance (not including Medicare Advantage) diagnosed with cancer, the results suggest that OOP costs may represent a significant burden, with increased patient OOP costs observed for later stage cancer diagnoses compared to earlier stage cancer diagnoses. Although mean OOP costs were generally higher in the first-year post-diagnosis, meaningful patient financial costs were sustained throughout the end of year 3 post-diagnosis. An opportunity may exist to reduce patient financial burden through earlier cancer diagnosis, requiring less intensive treatment and management, and associated OOP costs. Future research into the predictors of OOP costs are needed to help clarify the type of patient most burdened by OOP costs and potential areas to focus on to reduce OOP costs in the development and implementation of policies and guidelines to improve efficiency of the cancer diagnostic process, promote diagnosis at an earlier stage, and increase access to health plans that minimize patient cost sharing. Such efforts may help patients newly-diagnosed with cancer limit negative impacts associated with economic burden due to OOP costs and contribute toward their long-term financial health.
Transparency
Declaration of funding
GRAIL LLC a subsidiary of Illumina Inc. currently held separate from Illumina Inc. under the terms of the Interim Measures Order of the European Commission dated 29 October 2021, provided funding support for the study research.
Declaration of financial/other relationships
KCC is an employee of GRAIL LLC, with equity in the company. NM and MG are employees of BluePath Solutions. EF was employed by BluePath Solutions during the time of the study conduction. BluePath Solutions received funding from GRAIL LLC to conduct analyses for this study.
Author contributions
KCC, MG, and NM designed the study. EF ran statistical analyses. All authors interpreted the study results and drafted the manuscript. All authors approved the final version of the manuscript.
Reviewer disclosures
Peer reviewers on this manuscript have no relevant financial or other relationships to disclose.
The Editor in Chief helped with adjudicating the final decision on this paper.
Previous presentations
A portion of the data (year 1 only; 4/18 cancer types) was presented at the Professional Society for Health and Economics Research (ISPOR) 2022 conference (May 15–18, 2022; National Harbor, MD, USA).
Supplemental Material
Download MS Word (59.8 KB)Acknowledgements
Not applicable.
References
- Lifetime Risk of Developing or Dying from Cancer. American Cancer Society; 2020.
- Cancer Facts & Figures 2022. Atlanta, GA: American Cancer Society; 2022.
- Mariotto AB, Enewold L, Zhao J, et al. Medical care costs associated with cancer survivorship in the United States. Cancer Epidemiol Biomarkers Prev. 2020;29(7):1304–1312. doi: 10.1158/1055-9965.EPI-19-1534.
- Yabroff KR, Mariotto A, Tangka F, et al. Annual report to the nation on the status of cancer, part 2: patient economic burden associated with cancer care. J Natl Cancer Inst. 2021;113(12):1670–1682. doi: 10.1093/jnci/djab192.
- Dieguez G, Ferro C, Pyenson BS. A multi-year look at the cost burden of cancer care. Milliman Research Report; 2017. Available from: https://www.milliman.com/en/insight/2017/a-multi-year-look-at-the-cost-burden-of-cancer-care
- Mudaranthakam DP, Wick J, Calhoun E, et al. Financial burden among cancer patients: a national-level perspective. Cancer Med. 2023;12(4):4638–4646. doi: 10.1002/cam4.5049.
- Larrimore J, Dodini S, Thomas L. Report on the economic well-being of U.S. households in 2015. Board of Governors of the Federal Reserve System Report. 2016. Available from: https://www.federalreserve.gov/2015-report-economic-well-being-us-households-201605.pdf
- Chino F, Zafar SY. Financial toxicity and equitable access to clinical trials. Am Soc Clin Oncol Educ Book. 2019;39:11–18. doi: 10.1200/EDBK_100019.
- Dusetzina SB, Winn AN, Abel GA, et al. Cost sharing and adherence to tyrosine kinase inhibitors for patients with chronic myeloid leukemia. J Clin Oncol. 2014;32(4):306–311. doi: 10.1200/JCO.2013.52.9123.
- Fenn KM, Evans SB, McCorkle R, et al. Impact of financial burden of cancer on survivors’ quality of life. J Oncol Pract. 2014;10(5):332–338. doi: 10.1200/JOP.2013.001322.
- Kent EE, Forsythe LP, Yabroff KR, et al. Are survivors who report cancer-related financial problems more likely to forgo or delay medical care? Cancer. 2013;119(20):3710–3717. doi: 10.1002/cncr.28262.
- Lathan CS, Cronin A, Tucker-Seeley R, et al. Association of financial strain with symptom burden and quality of life for patients with lung or colorectal cancer. J Clin Oncol. 2016;34(15):1732–1740. doi: 10.1200/JCO.2015.63.2232.
- Lu L, Gavin A, Drummond FJ, et al. Cumulative financial stress as a potential risk factor for cancer-related fatigue among prostate cancer survivors. J Cancer Surviv. 2021;15(1):1–13. doi: 10.1007/s11764-020-00906-7.
- Smith GL, Lopez-Olivo MA, Advani PG, et al. Financial burdens of cancer treatment: a systematic review of risk factors and outcomes. J Natl Compr Canc Netw. 2019;17(10):1184–1192. doi: 10.6004/jnccn.2019.7305.
- Sullivan R, Peppercorn J, Sikora K, et al. Delivering affordable cancer care in high-income countries. Lancet Oncol. 2011;12(10):933–980. doi: 10.1016/S1470-2045(11)70141-3.
- Zafar SY, Peppercorn JM, Schrag D, et al. The financial toxicity of cancer treatment: a pilot study assessing out-of-pocket expenses and the insured cancer patient’s experience. Oncologist. 2013;18(4):381–390. doi: 10.1634/theoncologist.2012-0279.
- Zheng Z, Han X, Zhao J, et al. Financial hardship, healthcare utilization, and health among U.S. cancer survivors. Am J Prev Med. 2020;59(1):68–78. doi: 10.1016/j.amepre.2020.02.016.
- American Cancer Society Cancer Action Network. Survivor Views: Cancer & Medical Debt [cited 2022 Feb 02]. Available from: https://www.fightcancer.org/policy-resources/survivor-views-cancer-medical-debt#:∼:text=In%20line%20with%20recent%20national,their%20credit%20score%20negatively%20impacted. 2022.
- Boulanger M, Mitchell C, Zhong J, et al. Financial toxicity in lung cancer. Front Oncol. 2022;12:1004102. doi: 10.3389/fonc.2022.1004102.
- Han X, Zhao J, Zheng Z, et al. Medical financial hardship intensity and financial sacrifice associated with cancer in the United States. Cancer Epidemiol Biomarkers Prev. 2020;29(2):308–317. doi: 10.1158/1055-9965.EPI-19-0460.
- Gilligan AM, Alberts DS, Roe DJ, et al. Death or debt? National estimates of financial toxicity in persons with Newly-Diagnosed cancer. Am J Med. 2018;131(10):1187–1199 e5. doi: 10.1016/j.amjmed.2018.05.020.
- Managing Life With Cancer/Covering the Costs of Your Breast Cancer Care. Special Report: The Cost of Breast Cancer Care. Date Accessed: 02 Febrruary. 2022. Available from: https://www.breastcancer.org/managing-life/covering-cost-of-care/cost-of-care-report.
- McGarvey N, Gitlin M, Fadli E, et al. Increased healthcare costs by later stage cancer diagnosis. BMC Health Serv Res. 2022;22(1):1155. doi: 10.1186/s12913-022-08457-6.
- Optum Clinical Natural Language Processing [cited 2021 December 15]. Available from: htps://www.optum.com/content/dam/optum3/optum/en/resources/PDFs/wf2202949-enriched-oncology-data%20article-nlp.pdf.
- Amin MB, Greene FL, Edge SB, et al. The Eighth Edition AJCC Cancer Staging Manual: Continuing to build a bridge from a population-based to a more "personalized" approach to cancer staging. CA Cancer J Clin. 2017;67(2):93–99. doi: 10.3322/caac.21388.
- NCCN Guidelines: National Comprehensive Cancer Network; 2021. Available from: https://www.nccn.org/guidelines/category_1.
- Adamo M, Dickie L, Ruhl J. SEER program coding and staging manual 2016. Bethesda, MD: National Cancer Institute; 2016.
- Organisation for Economic Co-operation and Development (OECD). OECD.Stat [cited 2022 Feb 02]. Available from: https://stats.oecd.org/glossary/detail.asp?ID=1967.
- Iragorri N, de Oliveira C, Fitzgerald N, et al. The out-of-pocket cost burden of cancer care-a systematic literature review. Curr Oncol. 2021;28(2):1216–1248. doi: 10.3390/curroncol28020117.
- Ramsey S, Blough D, Kirchhoff A, et al. Washington state cancer patients found to be at greater risk for bankruptcy than people without a cancer diagnosis. Health Aff (Millwood). 2013;32(6):1143–1152. doi: 10.1377/hlthaff.2012.1263.
- Doroudi M, Coughlan D, Banegas MP, et al. Is cancer history associated with assets, debt, and net worth in the United States? JNCI Cancer Spectr. 2018;2(2):004.
- Obeng-Gyasi S, Timsina LR, Bhattacharyya O, et al. Bankruptcy among insured surgical patients with breast cancer: who is at risk? Cancer. 2021;127(12):2083–2090. doi: 10.1002/cncr.33468.
- Abrams HR, Durbin S, Huang CX, et al. Financial toxicity in cancer care: origins, impact, and solutions. Transl Behav Med. 2021;11(11):2043–2054. doi: 10.1093/tbm/ibab091.
- Nipp RD, Lee H, Gorton E, et al. Addressing the financial burden of cancer clinical trial participation: longitudinal effects of an equity intervention. Oncologist. 2019;24(8):1048–1055. doi: 10.1634/theoncologist.2019-0146.
- Doshi JA, Li P, Huo H, et al. High cost sharing and specialty drug initiation under medicare part D: a case study in patients with newly diagnosed chronic myeloid leukemia. Am J Manag Care. 2016;22(4 Suppl):S78–S86.
- Hershman DL, Tsui J, Meyer J, et al. The change from brand-name to generic aromatase inhibitors and hormone therapy adherence for early-stage breast cancer. J Natl Cancer Inst. 2014;106(11):dju319. doi: 10.1093/jnci/dju319.
- Kaisaeng N, Harpe SE, Carroll NV. Out-of-pocket costs and oral cancer medication discontinuation in the elderly. J Manag Care Spec Pharm. 2014;20(7):669–675. doi: 10.18553/jmcp.2014.20.7.669.
- Glied SA, Zhu B. Catastrophic out-of-pocket health care costs: a problem mainly for Middle-income americans with employer coverage. Commonwealth Fund; 2020. Available from: https://www.commonwealthfund.org/sites/default/files/2020-04/Glied_catastrophic_OOP_costs_ib.pdf
- Fu SJ, Rose L, Dawes AJ, et al. Out-of-pocket costs among patients with a new cancer diagnosis enrolled in high-deductible health plans vs traditional insurance. JAMA Netw Open. 2021;4(12):e2134282. doi: 10.1001/jamanetworkopen.2021.34282.
- U.S. Cancer Statistics Working Group. U.S. Cancer Statistics Data Visualizations Tool, based on 2021 submission data (1999–2019): U.S. Department of Health and Human Services, Centers for Disease Control and Prevention and National Cancer Institute; www.cdc.gov/cancer/dataviz., released in June 2022.