
Abstract
Background
Heart failure (HF) is a clinical syndrome with a global burden. Signs and symptoms of HF are nonspecific and often shared with other conditions. The N-terminal prohormone of brain natriuretic peptide (NT-proBNP) serves as a useful biomarker for the diagnosis of HF not only in patients with acute symptoms but also in outpatients with an ambiguous clinical presentation. The aim of the analysis is to evaluate the cost-effectiveness of implementing NT-proBNP in the diagnostic algorithm in patients with/without type 2 diabetes mellitus (T2DM), compared with a diagnosis based primarily on clinical signs or symptoms from the perspective of the Austrian and Swiss healthcare system.
Methods
A time-discrete Markov model was developed to simulate the effect/improvement (lifetime-costs, quality-adjusted life-years [QALYs], and life-years [LYs]) due to an NT-proBNP screening in undetected HF patients. Undetected HF patients are included in the model according to a distribution of New York Heart Association (NYHA) classes. The model considers disease progression by transition of NYHA classes. Undetected patients may remain undetected or be detected with the help of NT-proBNP or symptoms. Patients with known HF exhibit a slower disease progression. The probability of dying is influenced by the respective NYHA class. Direct costs (2021 € or CHF) were derived from published sources. QALYs, LYs, and costs were discounted (3% p.a.).
Results
In the per-patient analysis (at age 60 over lifetime), the incremental cost–utility ratio (ICUR)/QALY of NT-proBNP vs. no screening was €3,042 for HF patients in Austria. Considering the total cohort of undetected HF patients (n = 9,377) with the corresponding age structure over a lifetime, the ICUR increases to €4,356. In Switzerland, the per-patient results show an ICUR of CHF 897. Considering the total cohort of undetected HF patients (n = 6,826) the ICUR amounts to CHF 4,513. If indirect costs are considered, NT-proBNP screening becomes the dominant strategy in both countries.
Conclusion
Overall, the analysis concludes that screening with NT-proBNP is a highly cost-effective or cost-saving diagnostic option for patients with HF, and a sensitivity analysis confirmed these findings.
Introduction
Heart failure (HF) has been singled out as an epidemic and is a staggering clinical and public health problem, associated with significant mortality, morbidity, and healthcare expenditures.
HF is a complex clinical syndrome resulting from either functional or structural cardiac dysfunction leading to progressive worsening of physical capacity, fatigue, shortness of breath, and other typical symptoms and clinical signs. Beside hemodynamic alterations, as a decrease in cardiac output and an increase in vascular resistance, a plethora of activated neurohumoral and inflammatory systems lead to a nutritional under-supply of the cells, leading to cell and organ death. Thus, HF is – despite advances in therapy and prevention – still one of the leading causes of cardiovascular morbidity and mortality worldwide. On the one hand, the muscle can primarily be impaired by metabolic, toxic, or familiar affections, or the dysfunction is the final result of all cardiac diseasesCitation1.
An estimated 64.3 million people worldwide are living with HF. In developed countries, it is estimated that 1–2% of the general adult population have a diagnosis of HF. A meta-analysis of echocardiographic-based screening of the general population in developed countries showed that the prevalence of HF is about 11.8% among people aged 65 years and older. This would correspond to a calculated prevalence in the general population of 4.2%, which is about twice as high as the reported prevalence based on registries containing only detected casesCitation2,Citation3. Based on healthcare claims data, the estimated prevalence in Germany of HF of over 3 million inhabitants was around 4%Citation4, which confirms this figure. Despite differences in diagnostic criteria, most studies estimated that more than half of all HF patients in the general population have preserved left ventricular ejection fraction (LVEF) and that this proportion is increasingCitation2. Notably, the diagnosis of HF with preserved LVEF (HfpEF) is particularly challenging and frequently missed. Up to 76% of undetected cases of HF are patients with a preserved LVEF. The reasons for nondetection are varied and include misclassification as chronic obstructive pulmonary disease, deconditioning, aging or obesity due to similarity of symptoms, and the unavailability of echocardiography in primary careCitation2.
Type 2 diabetes mellitus (T2DM) is established as a separate risk factor for HF, as demonstrated in numerous cardiovascular studies conducted in both hospital and population-based settingsCitation5. Furthermore, the presence of T2DM significantly elevates the likelihood of unfavorable clinical outcomes among outpatients with HF, irrespective of several commonly shared risk factors. Diabetes and HF are closely connected, and a robust reciprocal association between these two conditions is evidentCitation6. Early detection of cardiac dysfunction and initiation of modern HF treatment (optimally during the preclinical phase of HF, before the first symptoms appear) have the potential to reduce the rate of disease progression, improve symptoms and quality of life, and reduce mortality. Moreover, economically, treatment significantly decreases hospitalization and keeps patients in self-care. Again, this depends on an early initiation of this treatment.
Measurement of natriuretic peptides (NPs) such as brain natriuretic peptide (BNP)/N-terminal prohormone of brain natriuretic peptide (NT-proBNP) might be helpful to support outpatient and inpatient diagnosis of HF. NPs have excellent sensitivity and good specificityCitation7 and a very high negative predictive value of 0.94–0.98. Hence, they may be used to exclude the diagnosis of HF (regardless of LVEF) if the values are below the cutoffCitation8, also in patients with T2DMCitation9–12. On the other hand, it is important to note that NPs have a limited positive predictive value (ranging from 0.66 to 0.67) and are insufficient for confirming a diagnosisCitation8. In the STENO-2 study, a notable example of substantial cardiovascular risk reduction achieved through multifactorial intervention in patients with type 2 diabetes, the authors observed that the preselection criterion of “microalbuminuria” was only significantly associated with increased risk when coupled with elevated NT-proBNP levels in patientsCitation9,Citation13. However, it is worth emphasizing that the positive predictive value of NPs remains relatively low and cannot definitively establish a diagnosisCitation8. This remains the domain of echocardiography or other diagnostic modalities.
The aim of the present economic analysis is to evaluate the cost-effectiveness of a screening program of HF using NT-proBNP, compared with no screening in patients with or without T2DM without a previous diagnosis of HF. In the control arm, diagnosis is suspected only based on symptoms or clinical signs compatible with HF. Diagnosis with subsequent treatment leads to an improved quality of life for patients and reduced mortality, i.e. increased life expectancy. Results are presented for two countries, Austria and Switzerland, from the perspective of their respective healthcare systems.
Method
Overview of the screening strategies
Identifying patients with HF or deciding which patients need further tests is a challenge. All patients with suspected HF should be diagnosed using objective tests. The European Society of Cardiology (ESC) guidelines recommend NP as complementary tests for the differential diagnosis of HF, before expensive echocardiographyCitation14. This is a relevant issue, as the number of under-reported cases is up to around 20%Citation15.
To investigate the impact of NT-proBNP versus no screening, the model compared the following strategies:
NT-proBNP (including a clinical visit). The clinical visit includes a clinical history (risk factors) combined with the assessment of symptoms and clinical signs: dyspnea, fatigue, ankle edema, nocturia, or palpitations. If present, this is followed by an NT-proBNP determination. If NT-proBNP is <125 pg/ml, then no further tests are carried out. Only if NT-proBNP is >125 pg/ml is an echocardiography carried out to confirm or rule out HF.
Clinical visit with assessment of symptoms and clinical signs. If present, an echocardiography is carried out to confirm or rule out HF in each patient.
In the NT-proBNP-supported strategy, the initial determination of the patient’s disease status was made based on an NT-proBNP test result. The target value of 125 pg/ml was chosen, as prior data had shown that this is an excellent threshold for risk prediction in this populationCitation9,Citation10,Citation16.
The economic analysis assumes that in patients aged 60 and upwards who have T2DM other risk factors/symptoms are eligible for NT-proBNP screening. HF is detected or not detected according to sensitivity. In the case of undetected HF, an NT-proBNP test is performed again the following year. Patients with detected HF are treated with medication and receive annual monitoring.
The probability of detecting HF based on signs and symptoms corresponds to the incidence rate, according to age and the New York Heart Association (NYHA) stage. The specificity in NYHA stage IV is 1.
For the present cost-effectiveness model, sensitivities from a published economic model were usedCitation16. Data are derived from a real-world study by Boonman-de Winter (2015)Citation17, which documented a good discrimination score for detecting or excluding HF with NT-proBNP (c-statistic according to bootstrapping AUC 0.84; 95% confidence interval [CI] 0.81–0.88). Broken down into the NYHA classes, the following sensitivities were calculated: NYHA I is 25%, NYHA II 87.9%, NYHA III 89.7%, and NYHA IV 100%. The model assumes a 20% HF risk.
Study population
To estimate the undetected HF cases in both countries, the following derivations were carried out:
First, it was necessary to determine the incidence of HF in Austria and Switzerland. To assess the HF incidence in both countries, a German registry studyCitation4 was used, which maps both the outpatient and the inpatient sector. Störk et al. (2017)Citation4 examined, in a retrospective study, a representative sample of the German population according to age and gender distribution, with a total of over three million insured persons. Transferred to Austria, there are 49,007 newly detected HF patients and 35,674 patients in Switzerland per year.
Since the probability of T2DM is higher in Germany than in Austria and Switzerland, we decided in the context of validation interviews to use the Swedish registry study (30,696 HF patients prospectively included) to determine the proportion of patients with a T2DM comorbidity, which was 24.4%Citation18. Thus, NYHA II + was present in 87.2% of patients with T2DM and 91.6% in patients without T2DM in the detected population.
Second, regarding the unknown cases, there is little information in the literature. Data by Boonman-de Winter et al.Citation19 determined unreported cases of 27.7%. Stratified according to NYHA stages, an unreported figure of 19.1% was calculated (see ). The current ESC GuidelinesCitation14, refers to a paper that assumes that the true prevalence is likely to be higher by 15.7%; 95% CI 12.9–19.0Citation15. This means that an additional 9,377 cases are not detected in Austria, and 6,826 not detected in Switzerland. In the undetected population NYHA II + was present in a higher degree of 97.7% of patients.
Table 1. Clinical input data.
The total patient flow is shown in the supplementary appendix. The model is performed for the following patients, as well as cohorts:
an average symptomatic patient with undetected HF from age 60 over a lifetime
an average symptomatic patient with undetected HF and T2DM from age 60 over a lifetime
an average symptomatic patient with undetected HF without T2DM from age 60 over a lifetime
the cohort with undetected HF
the cohort with undetected HF and T2DM
the cohort with undetected HF without T2DM
Model design
A cost–utility model was developed to simulate HF screening as well as its long-term consequences in undetected HF population from age 60 over lifetime. A Markov chain simulation cohort model of HF progression was developed ().
Figure 1. Markov model. Markov process with cycle length of 3 months and nine defined states.
HF = heart failure; NTproBNP = N-terminal prohormone of brain natriuretic peptide; NYHA = New York Heart Association; T2DM = Type 2 diabetes mellitus.
Undetected HF patients run into the model and were either detected or remain undetected. In the case of undetected HF, an NT-proBNP test is performed again the following year. Gray arrows: after the first screening, patients were assigned to NYHA states. The base case distribution corresponds to that of van Giesen et al. (2016)Citation16 based on Boonman-de Winter et al. (2012)Citation17. Patients with detected HF subsequently move between the “NYHA detected” health states. Patients with undetected HF (“NYHA undetected” states) undergo re-screening. Dark blue health states refer to detected HF according to the sensitivity. The transition probabilities (transitions shown with blue arrows) in the direction to worse NYHA health states are lower than in the case of undetected patients and refer to a slower disease progression. Light blue health states: refer to the undetected HF. The transition probabilities in the direction to worse NYHA health states are higher than in the case of detected patients. No screening arm: the base case distribution corresponds to that of van Giesen et al. (2016)Citation16 based on Boonman-de Winter et al. (2012)Citation17 illustrated in light blue undetected NYHA health conditions. The state NYHA IV is always detected (spcicificity 1). The green arrows describe the transitions between undetected and detected HF according to the incidence rates. Health states refer to the following populations: (1) undetected NYHA I without T2DM, undetected NYHA II without T2DM, undetected NYHA III without T2DM, undetected NYHA IV without T2DM; (2) undetected NYHA I with T2DM, undetected NYHA II with T2DM, undetected NYHA III with T2DM, undetected NYHA IV with T2DM; (3) detected without T2DM NYHA I, detected without T2DM NYHA II, detected without T2DM NYHA III, detected without T2DMNYHA IV, and death; (4) detected with T2DM NYHA I, detected with T2DM NYHA II, detected with T2DM NYHA III, detected with T2DM NYHA IV and death.
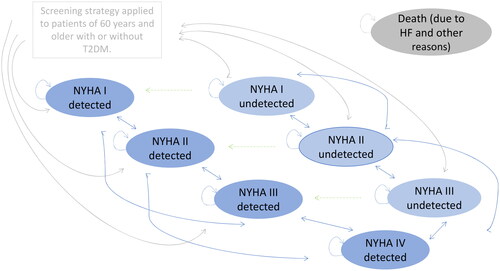
In the present model, screening is performed in patients aged 60 onward who do not have diagnosed HF. This hypothetical cohort of undiagnosed were screened according to the two screening strategies. As a consequence, patients were detected or remain undetected. The majority of undetected patients are in NYHA I and II stage (78.5%) at model start, a few in NYHA III (21.5%) and none in NYHA IV. When HF is detected, they are assigned an NYHA stage according to the distribution documented by van Giesen et al.Citation16. The model assumes that if no HF is detected, patients will be screened again next year. The model allows detection based on signs and symptoms in both arms. In the screening arm, it is included in the sensitivity rates and in the no screening arm on the extent of the HF incidence rates, stratified according to NYHA stage and presence of T2DM. This proportion of patients is treated. HF in NYHA IV is always diagnosed based on signs and symptoms, as the specificity is 1 (see ).
The long-term expected health effects due to an early detection of HF are expressed by a slower progression to a worse NYHA class, due to treatment. In addition, it is possible to improve by one stage. Thus, patients can transit from NYHA II to NYHA I, NYHA III, or NYHA IV, or remain in NYHA II. All states may lead to death. If a patient dies, they will move to the dead state and remain there for the rest of the simulation. The model considers disease-dependent mortality rates and age-dependent mortality according to mortality tables (including death due to reasons other than HF). Patients were followed through the model over their lifetime or 480 cycles, with a Markov cycle length of 3 months. No half-cycle correction was adopted due to the short cycle length. Each health state is assigned time-dependent utilities and costs.
The model results present cumulative direct costs, clinical outcomes expressed as quality-adjusted life-years (QALYs) saved, and life-years (LYs) saved over a lifetime horizon for Austria and Switzerland. The incremental cost–utility ratio (ICUR) can be interpreted as additional costs or savings per QALY gained. Probabilities and utilities were derived from literature. QALYs, LYs, and total costs were discounted at 3% p.a.
Results were presented for an individual patient from age 60 upwards, as well as for the undetected cohort defined as a cross-section of ages ≥60 in both healthcare systems.
It is considered good research practice to validate economic models against local data when such data are available. External model validation, in which model results are compared with events observed in real-world use, provides the opportunity to test model assumptions, bolsters confidence in the validity of model results, and enhances model credibility. In addition, clinical experts from both countries were consulted to ensure that the clinical pathway and disease complexity, as well as important differences in costs and outcomes between treatments, were accurately captured by the model.
The model was constructed and analyzed using Microsoft Excel for Microsoft 365 MSO (Version 2210). The analysis was conducted in consideration of the Modeling Good Research Practices published by The Professional Society for Health Economics and Outcomes Research Task ForceCitation20 and the Austrian Health Economic GuidelinesCitation21.
Transition probabilities
Patients with undetected HF align with the baseline NYHA distribution described in the publication by van Giesen et al.Citation16 which is based on the cohort study conducted by Boonman-de Winter et al.Citation17. This is the only available data set that documented NYHA classes in the undetected HF population.
Starting from the baseline health state distribution, in the screening arm, HF is detected or not detected according to NT-proBNP (including a clinical visit) sensitivity. The sensitivities used for the present analysis were derived from Giesen et al.Citation16. The authors have documented sensitivities for different screening strategies based on the real-world evidence study by Boonman-de Winter et al.Citation17, including 581 consecutive patients from 21 primary care practices in the Netherlands for whom the diagnosis of HF was not knownCitation17. The model assumes that if no HF is detected, patients will be screened again next year. For this purpose, the sensitivities are applied again in the cohort of undetected patients (see left Markov process in ). The occurrence of HF in the no screening arm corresponds to the incidence rate. In addition, a specificity of 1 in NYHA class IV is assumed. Detected and undetected HF patients progress according to their assigned health state transition probabilities.
Information on transition probabilities between NYHA functional classes in HF is limited in published reports. In this study, we employed a well-established transition matrix commonly used in cost-effectiveness analyses, which was derived from data originating from the SENIORS study (Study of the Effects of Nebivolol Intervention on Outcomes and Rehospitalization in Seniors With Heart Failure)Citation22–25. We adopted a conservative assumption, considering that the probability of disease progression corresponds to the detected subpopulation without T2DM. A higher risk, such as T2DM or undetected HF, leads to a worse condition (higher NYHA class) more quickly. Analogous to the approach in the economic analysis by van Giessen et al.Citation16, it was assumed that the faster progression corresponds to the relative increase in mortality. The transition probabilities are shown in .
Table 2. Transition probabilities.
The annual mortality rate of the patient group with HF and T2DM was derived from the analysis by van Giessen et al.Citation16 and Boonman-de Winter et al.Citation19. The annual mortality rates differ according to NYHA class and whether HF is diagnosed or not. Mortality rates are presented as a gender-specific weighted mean for the subgroups of patients with T2DM. Cohort studies have demonstrated that patients with the presence of T2DM have an elevated mortality risk due to HF, compared with patients suffering exclusively from HF. To describe the mortality of the subgroup without T2DM, published hazard ratios (HRs) by Johansson et al.Citation18 mapped to NYHA classes were used. Converted to NYHA classes, the HRs of mortality due to T2DM are 1.42 for the NYHA I class and 1.43 for NYHA II to NYHA IV. For mortality from other reasons, the national mortality tables were used.
All probabilities were time adjusted to Markov cycle length by means of the actuarial method to make it usable for calculation. The used probabilities are displayed in .
Cost assessment
The cost evaluation relies on attributing expenses to specific health states. The costs associated with each health state were calculated based on the resources utilized within that state. To estimate the costs for HF patients in Austria and Switzerland, our analysis focused exclusively on direct medical costs. These encompass screening, monitoring, HF-related costs categorized by NYHA classes, and medication expenses. Direct medical costs were gathered from the payer’s perspective during the given year 2021.
As resource consumption and costs differ between the two countries considered, validation interviews were conducted. The questionnaire is displayed in the supplementary appendix.
The biggest differences were revealed for the cost components of screening for HF diagnosis. Screening costs in Austria include a GP visit, laboratory testing plus serum electrolytes, creatinine and eGFR, as well as vital parameters and finally NT-proBNP. In case of an NT-proBNP >125 pg/ml an echocardiography is performed. The average costs amount to €57.55. In Switzerland, inflammatory markers C-reactive protein, liver enzymes (ALT, AST), HbA1c, TSH, total protein ± albumin in serum, the urine status, albumin in urine in the subgroup with T2DM, and an ECG are added. The average cost is CHF 270.58. Details are provided in .
Table 3. Cost data.
The subsequent monitoring includes GP consultations and specialist visits, laboratory tests including serum electrolytes and creatinine levels, an ECG (blocks), and an echocardiography. In Austria, the average annual cost is €69.68. In Switzerland, ferritin is also monitored. The average monitoring costs are CHF 202.54 on average per year.
If HF is detected, patients receive medication. From a payer’s perspective, it is irrelevant whether it is given as indicated or off label. Therefore, we calculated each principal HF drug (renin–angiotensin system inhibitors [RASI]. beta-blocker [BB], mineralocorticoid receptor antagonist [MRA], sodium/glucose cotransporter 2 [SGLT2i]) as prescribed in contemporary studies. It is assumed that patients with heart failure with reduced ejection fraction (HfrEF) receive medication that corresponds to the DAPA-HF studyCitation26. Patients with HfpEF and HfmrEF are estimated to receive medication consistent with the EMPEROR-PRESERVED studyCitation27. According to the face-validation meeting results, we assume that HF patients with T2DM receive prescriptions of SGLT2. Only patients with NYHA II to IV are eligible for medication. The percentages of HfrEF, HfpEF, and HfmrEF transferred to NYHA classes are based on data from Johansson et al.Citation18.
For Austria, medication expenses were obtained from the Austrian product index (Warenverzeichnis) and corresponded to reimbursement prices. For outpatient expenses, we referenced the outpatient clinic catalog as well as the nine tariff catalogs provided by the Austrian health insurance fund. The outpatient costs were calculated as weighted averages across these nine regions. For Switzerland, outpatient costs represent TARMED tariffs and lab-cost lump-sums from the laboratory test list. Medication costs were derived from pharmaceutical specialties lists.
The model also includes HF costs according to the NYHA classes in addition to the costs already described. These costs of illness were systematically retrieved from the literature. Only a few publications are available, which present costs by NYHA class. A systematic review by Shafie et al. (2017)Citation28 identified four studies. The biggest increment of cost occurred when the severity of HF increases from NYHA class II to NYHA class III. Two cost studies, one conducted for GermanyCitation29 and another for SpainCitation30, were considered. The study by Czech et al.Citation31 documenting costs for Poland that are difficult to transfer to the two countries considered, and a study by Parissis et al.Citation32, which determined exclusively inpatient costs, were both excluded. For Austria, a further study describing Austrian HF costs was also addedCitation33,Citation34. HF costs were the subject of the validation meetings and were derived differently in the two countries. In Austria, a pooled value was determined. For Switzerland, a linear cost increase by NYHA class was calculated based on the publication by Delgado et al.Citation30. Costs were inflated, and purchasing power parity adjusted.
A discount rate of 3% was applied, due to a lifetime horizon. All costs are presented in .
Health state utilities
Utilities serve as a metric for gauging preferences among different health states, with preferences indicating their value or desirability. We acquired utilities for the health states incorporated into the model from international literature. If necessary, these utilities were transformed onto a scale ranging from 0 to 1, where 0 represents the state of death, and 1 signifies perfect health, through the application of weighting factors. The concept of QALYs enables us to amalgamate the impact of healthcare interventions on both the quantity and quality of remaining life-years into a single index. QALYs are determined by multiplying the duration spent in a particular health state by the corresponding utility scoreCitation35.
We employed the NYHA functional classification as an indicator of the patients’ health status, and NYHA-specific utility values were extracted from the CARE-HF (Cardiac Resynchronization in Heart Failure) trialCitation22. To compute QALYs for each patient, their survival and quality of life, relying on EQ-5D utility scores collected at various time points, including baseline, 3 months, 18 months, and the end of the study, were usedCitation36. Utilities were generated using an area under the curve model with linear interpolation applied to each individual patient-level estimate. Our analysis was based on the assumption that these utilities can be applied to the Austrian und Swiss population. All utilities are presented in .
Table 4. Utilities.
Sensitivity analysis
We conducted a deterministic one-way sensitivity analysis to evaluate how changes in specific input parameter values impact the model outcomes, particularly the resulting ICUR. This analysis was carried out to gage the robustness of our findings. Input parameter ranges for sensitivity analysis were determined by extracting values from the 95% confidence interval or by adjusting the baseline estimates by adding/subtracting a specified percentage (±20% for costs and ±10% for clinical input data).
Furthermore, we conducted a probabilistic sensitivity analysis, which enables to explore the influence of individual parameters on model results while considering the uncertainty surrounding other model variables. To achieve this, we integrated a probability distribution of input variables through a second-order Monte Carlo simulation. This simulation involved assessing the performance of 500 hypothetical patients based on the distributions of all input variables, utilizing a gamma distribution for costs and a beta distribution for probabilities and utilities.
To include indirect costs, a scenario analysis was conducted. As indirect cost data were scarce, incorporating such costs is difficult and associated with a high degree of uncertainty. Therefore, it was decided not to integrate the indirect costs for the base case analysis. Due to the lack of data availability, the indirect costs can only be calculated for the entire HF cohort (with and without T2DM). Results and the influences on these costs are presented in the Discussion section.
Results
Base case results
Austria
In the per-patient analysis (at age 60 over lifetime), an NT-proBNP screening leads to costs of €43,538 and 4.65 QALYs (7.94 life-years [LYs]) over a lifetime horizon. No screening is associated with €42,473 and 4.30 QALYs (7.54 LYs). NT-proBNP screening yields €1,065 in additional costs and a QALY gain of 0.35 or 4.2 months in perfect health. NYHA costs account for the largest part of total costs: 90.2% in the NT-proBNP screening group and 92.8% when no screening is carried out. The ICUR/QALY of NT-proBNP vs. no screening was €3,042 for HF patients with and without T2DM. Considering the total cohort of undetected HF patients with or without T2DM (n = 9,377) with the corresponding age structure over lifetime, the ICURs increase to €4,356. Assuming a willingness to pay (WTP) of €25,000 for each QALY, an NT-proBNP screening is highly cost-effective.
In the subgroup of patients with undetected HF and T2DM, an ICUR of €3,218 per average patient was determined for the NT-proBNP screening strategy vs. no screening. For the entire cohort (n = 2,292), cost-effectiveness improves to an ICUR of €1,646. For the subgroup of HF patients without T2DM, an ICUR of €1,745 was determined per average patient. Considering the entire cohort (n = 7,085) results in an ICUR of €3,344.
Looking at life expectancy, patients with the comorbidity T2DM have a lower life expectancy than patients without T2DM, namely 5.9 LYs vs. 7.7 LYs. Thus, an NT-proBNP screening is able to increase life expectancy by 0.25 LYs or 3 months; this corresponds to 0.45 quality-adjusted LYs or 5 months in perfect health.
Switzerland
In Switzerland, the costs per HF patient (with and without T2DM) with an NT-proBNP screening is CHF 81,965. An average patient in the no screening group causes an average total cost of CHF 81,651. The two alternatives are therefore budget neutral. Despite the national mortality tables, the outcome corresponds to those already described for Austria. This results in an ICUR of CHF 897. NYHA costs again account for the largest part of total costs: 88.6% in the NT-proBNP screening group and 91.8% when no screening is carried out. Considering the total cohort of undetected HF patients (n = 6,826), the ICUR amounts to CHF 4,513. Assuming a WTP of CHF 50,000 for one QALY gained, an NT-proBNP screening is highly cost-effective.
In the subgroup of undetected HF patients with T2DM, an ICUR of CHF 6,612.50 per average patient was calculated for the NT-proBNP screening strategy vs. no screening. For the entire cohort (n = 1,669), cost-effectiveness improves to an ICUR of CHF 3,194. For the subgroup of HF patients without T2DM, an NT-proBNP screening dominates (cost-saving and more effective) no screening. Consequently, a negative ICUR of CHF −1,712 was calculated. Considering the entire cohort (n = 5,157) results in a highly cost-effective ICUR of CHF 2,269.
Deterministic sensitivity analysis
A one-way deterministic sensitivity analysis was carried out to assess the impact of variations in single parameter assumptions on the incremental cost-effectiveness ratio (ICER) of NT-proBNP versus no screening. Results were expressed as incremental costs per QALY gained. Tornado diagrams () were chosen to display the results.
Figure 2. Deterministic sensitivity analysis visualized as Tornado plots where each bar represents a one-way sensitivity analysis, and the width of bars represents the impact on model results. Deterministic sensitivity analysis was used to identify the critical variables affecting risk analysis. The incremental cost-effectiveness ratio (ICER) per patient is plotted on the x-axis.
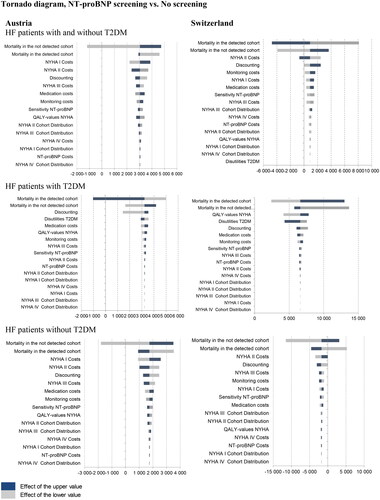
In both counties, results from the sensitivity analyses showed that the model was sensitive to several inputs (). Base case results for an average HF patient (with or without T2DM) are most sensitive against the mortality rates (undetected and detected HF) followed by NYHA II costs and the discount rate in both countries. The result for HF patients with T2DM shows a higher sensitivity for QALY inputs and T2DM disutility. The results for HF patients without T2DM show a similar sensitivity behavior as for the average HF patient. Results of the deterministic sensitivity analysis demonstrated a limited impact on the results.
Probabilistic sensitivity analysis
A probabilistic sensitivity analysis (PSA) was conducted by employing a Monte Carlo simulation involving 500 hypothetical patients. This analysis involved comparing the incremental costs and health outcomes associated with NT-proBNP screening against those of a no-screening strategy.
Austria
The location of the majority of data points in the upper right quadrant (56.4%) indicates that these simulations yield additional costs and improved health outcomes. The resulting scatter plots () revealed that an NT-proBNP screening dominates or shows cost-effective results compared with no screening. The acceptability curve revealed that in case of a WTP of about €25,000, an NT-proBNP screening was a cost-effective strategy in 86.6% of the simulations (see Figure S3 supplementary appendix). In the subgroup of HF patients with T2DM, 66.6% of simulations are cost-effective; 95.5% in the subgroup without T2DM.
Figure 3. Probabilistic sensitivity analysis: the scatterplot shows results of the Monte Carlo probabilistic sensitivity analysis for 500 patients. Incremental costs are plotted on the y-axis, and incremental effectiveness is plotted on the x-axis. The location of the majority of points in the lower-right quadrant shows that the simulations yield cost savings and improved health outcomes. Apixaban dominates comparators. The base case results attest to the model’s low level of uncertainty.
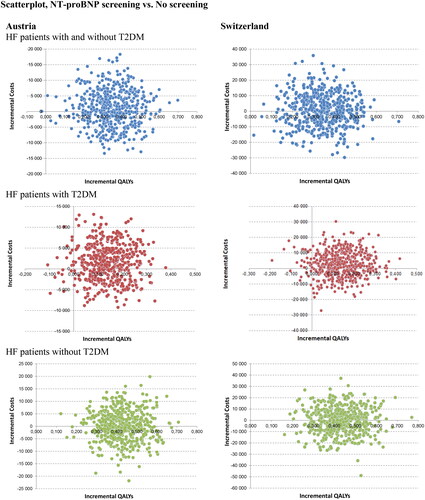
Switzerland
PSA results revealed that half of simulations lead to additional cost and half to cost savings. The acceptability curve showed that in case of a WTP of about CHF 50,000, an NT-proBNP screening was a cost-effective strategy in 92.6% of the simulations (see Figure S3 supplementary appendix). In the subgroup of HF patients with T2DM, 71.8% of simulations are cost-effective, 95.2% in the subgroup without T2DM ().
Table 5. Base-Case cost-effectiveness results (per patient from age 60 over lifetime).
Discussion
HF is one of the most common and costly chronic diseases in industrialized countries, with increasing incidence and prevalence over the past years. In Austria, symptomatic HF was responsible for 22,793 hospitalizations in the year 2021Citation37. A comprehensive systematic review of cost-of-illness studies that employed a prevalence-based approach revealed a spectrum of cost estimates for HF. These estimates were expressed as annual costs per patient, spanning from Int$2496.00 to Int$84,434.00 per patient per yearCitation28. Additionally, cost estimates for HF were expenses per hospitalization, ranging from Int$3,780.00 to Int$34,233.00 per hospitalizationCitation28.
We demonstrate that NT-proBNP guided screening, is highly cost-effective or cost-saving, while improving clinical outcomes as compared with no screening. Costs directly associated with the NT-proBNP measurements accounted for <1% of the total cost, and changing price levels of NT-proBNP measurement did not alter our results. The results for Austria show an ICUR of €3,042.36. In the subgroup with T2DM, the ICER increases minimally to €3,218.23; in the subgroup without T2DM, the ICUR improves to €1,744.95. The results for Switzerland show even better results. The ICUR amounts to CHF 896.74. In patients with T2DM, the ICER rises to CHF 6,616.96. An NT-proBNP screening leads to cost savings in the subgroup without T2DM; NT-proBNP screening is the dominant strategy in this case (ICUR: CHF −1,712.40).
How was this figure interpreted? The additional expenses per QALY gained, or the ICUR, served as the reference point for a cost-effectiveness threshold. Research conducted in both higher- and middle-income countries in Europe and Latin America has revealed a cost-effectiveness threshold below 1 times the national GDP per capita (approximately $24,000–$40,000) per QALY as a measure of opportunity costsCitation38,Citation39. These thresholds demonstrate the high degree of cost-effectiveness of NT-proBNP screening in both countries.
Based on these results, it can be shown that integrating NT-proBNP into a diagnostic strategy leads to small cost increases or savings according to patient populations. Early diagnosis with NT-proBNP can prevent the development of symptoms and signs of HF, and increase patients’ utility. Our data are in line with previous studies. For example, Moertl et al.Citation33 indicated that NT-proBNP measurements compared with usual care and multidisciplinary care was the dominant strategy for reduced costs and increased QALY from the perspective of the Austrian healthcare system. A cost-effectiveness analysis authored by van Giessen et al.Citation16 assessed the cost-effectiveness of five screening strategies in patients with T2DM aged 60 years or over. Diagnosis of HF per signs and symptoms plus NT-proBNP yields an ICUR of €6,288 for men and €6,408 for women compared with no screeningCitation14. These results are comparable with our findings for the T2DM subpopulation. Laramée et al.Citation40 found that the serial BNP measurement by a specialist was the most cost-effective option compared with clinical assessment and usual care showing an ICER of £3,304 compared with clinical assessment, but it does not prove to be a cost-effective approach for individuals aged 75 years or older. In a similar investigation, Mohiuddin et al.Citation41 pointed out that in younger patients with HF and reduced ejection fraction, BNP-guided care exhibited a higher degree of cost-effectiveness than standard clinical care (ICER £9,840). Siebert et al.Citation42 analyzed in an economic evaluation an NT-proBNP-supported diagnostic strategy in dyspneic patients suspected of acute HF in the emergency department (ED) from the United States (US) Medicare perspective. Utilizing NT-proBNP for assessment increased the likelihood of a correct diagnosis by approximately 7% relative to other methods. Furthermore, the incorporation of NT-proBNP reduced the average inpatient management expenses by approximately 10%, resulting in cost reductions of US$2,337 per patient ED visitCitation42.
The key strength of the present model is that the analysis was developed based on real-world evidence data, on the one hand regarding the chosen cohort, and on the other hand with regard to the diagnostic data. The considered cohort corresponds to the studies of Störk et al.Citation4 and Johanson et al.Citation18, which described population-representative samples. Boonman-de WinterCitation17 generates sensitivities of NT-proBNP in combination with physical examination from 21 primary care practices in the Netherlands. The sensitivities determined are generally lower than in published diagnostic studies on NT-proBNPCitation43 and thus represent a conservative assumption. Input data were locally validated by clinical experts concerning transferability among counties.
Among the limitations of this analysis, which must be mentioned when interpreting the results, is the problem that transition probabilities based on NYHA classes are not available for different risk profiles of HF cohorts. Therefore, it was necessary to make an adjustment for the risk groups (HF with T2DM and undetected HF) based on the timely shift in mortality. The approach has already been described in the economic analysis by van Giessen et al.Citation16. Validation was necessary in relation to NYHA cost differentiated by NYHA classes, as data were available with limitations for both countries. Another constraint of this analysis is the omission of indirect costs. HF-related complications entail a substantial economic impact, encompassing not only direct expenses but also indirect costs such as income loss, decreased productivity, and the strain on caregivers and family members. Due to the scarcity of data on indirect costs, integrating them into the analysis is challenging and comes with a considerable level of uncertainty. The attempt to partially depict the loss of work is fraught with limitations.
Therefore, it was decided not to integrate the indirect costs for the base case analysis. Another argument was that these costs are not considered by the reimbursement authorities in both countriesCitation21,Citation44,Citation45.
If indirect costs (work absenteeism of HF patients) would be considered in a scenario analysis, this would have a significant impact. For this scenario the following assumptions were made: (1) only patients with NYHA class II and III exhibit absenteeism; NYHA class IV patients are no longer in the employment process due to their advanced age (≥ 60 years); (2) the average number of sick days based on ICD10 codes (I.11; I.13 and I.50) is 33 daysCitation46; (3) no distinction can be made between patients with or without T2DM. Since, in Switzerland, the employment rate (77% vs. 30.9% between age 60 and 64 and 11.6% vs. 4.5% ≥ 65 years)Citation47,Citation48 and gross salaries plus ancillary labor costs (CHF 311 vs. €255 per day)Citation49,Citation50 in this age group are considerably higher than in Austria, the shift in the direction of savings takes place to a greater extent. In Switzerland, the incremental indirect costs are CHF −4,838, whereas in Austria, these amount to €−468.94 per patient. The savings due to the loss of work compensate for the higher direct costs. In both countries, the NT-proBNP screening strategy becomes the dominant alternative (see Table S1 supplementary appendix).
According to the results of the current study, measuring NT-proBNP levels represents good value for money. It might reduce costs and increase QALYs compared with standard clinical assessment. Given the result of this study, cost coverage of an NT-proBNP screening by healthcare insurance should be recommended.
Transparency
Declaration of funding
This work was supported by a grant from Roche Diagnostics GmbH Vienna, Austria and Roche Diagnostics (Schweiz) AG Rotkreuz, Switzerland.
Declaration of financial/other relationships
E.W. has received an honorarium from Roche Diagnostics GmbH and Roche Diagnostics (Schweiz) AG for the submitted work. M.H. has received personal fees from Roche Diagnostics GmbH. M.A. has no conflict of interest to declare; honoraria from Roche Diagnostics (Schweiz) AG were devolved to the foundation of the hospital (Stiftung Stadtspital). S.A. is employed at Roche Diagnostics GmbH Vienna, Austria. P.M. is employed at Roche Diagnostics (Schweiz) AG Rotkreuz, Switzerland.
Author contributions
E.W. has substantially contributed to the concept of the study, the analysis, and the modeling and interpretation of the data, drafted the article, revised the article, and finally approved the version to be published. M.H. validated the data inputs, drafted the article, revised the article, and finally approved the version to be published. M.A. validated the data inputs, revised the article, and finally approved the version to be published. S.A and P.M. acquired and interpreted the data, and finally approved the version to be published.
Reviewer disclosures
Peer reviewers on this manuscript have no relevant financial or other relationships to disclose.
Supplemental Material
Download MS Word (178 KB)Acknowledgements
None reported.
References
- Hajouli S, Ludhwani D. Heart failure and ejection fraction. In StatPearls [Internet]. Treasure Island (FL): StatPearls Publishing; 2022.
- Groenewegen A, Rutten FH, Mosterd A, et al. Epidemiology of heart failure. Eur J Heart Fail. 2020;22(8):1342–1356. doi: 10.1002/ejhf.1858.
- van Riet EE, Hoes AW, Wagenaar KP, et al. Epidemiology of heart failure: the prevalence of heart failure and ventricular dysfunction in older adults over time. A systematic review. Eur J Heart Fail. 2016;18(3):242–252. doi: 10.1002/ejhf.483.
- Störk S, Handrock R, Jacob J, et al. Epidemiology of heart failure in Germany: a retrospective database study. Clin Res Cardiol. 2017;106(11):913–922. doi: 10.1007/s00392-017-1137-7.
- Delgado E, Jódar E, Mezquita-Raya P, et al. Benefits of SGLT2i for the treatment of heart failure irrespective of diabetes diagnosis: a state-of-the-art review. Diabetes Ther. 2022;13(Suppl 1):19–34. doi: 10.1007/s13300-022-01278-0.
- De Couto G, Ouzounian M, Liu PP. Early detection of myocardial dysfunction and heart failure. Nat Rev Cardiol. 2010;7(6):334–344. doi: 10.1038/nrcardio.2010.51.
- Palazzuoli A, Gallotta M, Quatrini I, et al. Natriuretic peptides (BNP and NT-proBNP): measurement and relevance in heart failure. Vasc Health Risk Manag. 2010;6:411–418. doi: 10.2147/vhrm.s5789.
- Roberts E, Ludman AJ, Dworzynski K, et al. The diagnostic accuracy of the natriuretic peptides in heart failure: systematic review and diagnostic meta-analysis in the acute care setting. BMJ. 2015;350(mar04 22):h910. doi: 10.1136/bmj.h910.
- Huelsmann M, Neuhold S, Resl M, et al. PONTIAC (NT-proBNP selected prevention of cardiac events in a population of diabetic patients without a history of cardiac disease): a prospective randomized controlled trial. J Am Coll Cardiol. 2013;62(15):1365–1372. doi: 10.1016/j.jacc.2013.05.069.
- Huelsmann M, Neuhold S, Strunk G, et al. NT-proBNP has a high negative predictive value to rule-out short-term cardiovascular events in patients with diabetes mellitus. Eur Heart J. 2008;29(18):2259–2264. Epub 2008 Jul 23. PMID: 18650200. doi: 10.1093/eurheartj/ehn334.
- Neuhold S, Resl M, Huelsmann M, et al. Repeat measurements of glycated haemoglobin A(1c) and N-terminal pro-B-type natriuretic peptide: divergent behaviour in diabetes mellitus. Eur J Clin Invest. 2011;41(12):1292–1298. doi: 10.1111/j.1365-2362.2011.02539.x.
- Clodi M, Resl M, Neuhold S, et al. A comparison of NT-proBNP and albuminuria for predicting cardiac events in patients with diabetes mellitus. Eur J Prev Cardiol. 2012;19(5):944–951. doi: 10.1177/1741826711420015.
- Gaede P, Hildebrandt P, Hess G, et al. Plasma N-terminal pro-brain natriuretic peptide as a major risk marker for cardiovascular disease in patients with type 2 diabetes and microalbuminuria. Diabetologia. 2005;48(1):156–163. doi: 10.1007/s00125-004-1607-0.
- McDonagh TA, Metra M, Adamo M, et al. 2021 ESC guidelines for the diagnosis and treatment of acute and chronic heart failure. Eur Heart J. 2021;42(36):3599–3726. Erratum in: Eur Heart J. 2021. doi: 10.1093/eurheartj/ehab368.
- van Riet EE, Hoes AW, Limburg A, et al. Prevalence of unrecognized heart failure in older persons with shortness of breath on exertion. Eur J Heart Fail. 2014;16(7):772–777. doi: 10.1002/ejhf.110.
- van Giessen A, Boonman-de Winter LJ, Rutten FH, et al. Cost-effectiveness of screening strategies to detect heart failure in patients with type 2 diabetes. Cardiovasc Diabetol. 2016;15(1):48. doi: 10.1186/s12933-016-0363-z.
- Boonman-de Winter LJ, Rutten FH, Cramer MJ, et al. Efficiently screening heart failure in patients with type 2 diabetes. Eur J Heart Fail. 2015;17(2):187–195. doi: 10.1002/ejhf.216.
- Johansson I, Dahlström U, Edner M, et al. Type 2 diabetes and heart failure: characteristics and prognosis in preserved, mid-range and reduced ventricular function. Diab Vasc Dis Res. 2018;15(6):494–503. doi: 10.1177/1479164118794619.
- Boonman-de Winter LJ, Rutten FH, Cramer MJ, et al. High prevalence of previously unknown heart failure and left ventricular dysfunction in patients with type 2 diabetes. Diabetologia. 2012;55(8):2154–2162. doi: 10.1007/s00125-012-2579-0.
- Caro JJ, Briggs AH, Siebert U, et al. Modeling good research practices–overview: a report of the. Value Health. 2012;15(6):796–803. doi: 10.1016/j.jval.2012.06.012.
- Walter E, Zehetmayr S. [Guidelines for health-economic evaluations in Austria]. Wien Med Wochenschr. 2006;156(23-24):628–632. doi: 10.1007/s10354-006-0360-z.
- King JB, Shah RU, Bress AP, et al. Cost-effectiveness of sacubitril-valsartan combination therapy compared with enalapril for the treatment of heart failure with reduced ejection fraction. JACC Heart Fail. 2016;4(5):392–402. doi: 10.1016/j.jchf.2016.02.007.
- Ford E, Adams J, Graves N. Development of an economic model to assess the cost-effectiveness of hawthorn extract as an adjunct treatment for heart failure in Australia. BMJ Open. 2012;2(5):e001094. doi: 10.1136/bmjopen-2012-001094.
- Yao G, Freemantle N, Flather M, et al. Long-term cost-effectiveness analysis of nebivolol compared with standard care in elderly patients with heart failure: an individual patient-based simulation model. Pharmacoeconomics. 2008;26(10):879–889. doi: 10.2165/00019053-200826100-00007.
- Flather MD, Shibata MC, Coats AJ, et al. Randomized trial to determine the effect of nebivolol on mortality and cardiovascular hospital admission in elderly patients with heart failure (SENIORS). Eur Heart J. 2005;26(3):215–225. doi: 10.1093/eurheartj/ehi115.
- McMurray JJV, Solomon SD, Inzucchi SE, et al. Dapagliflozin in patients with heart failure and reduced ejection fraction. N Engl J Med. 2019;381(21):1995–2008. doi: 10.1056/NEJMoa1911303.
- Anker SD, Butler J, Filippatos G, et al. Empagliflozin in heart failure with a preserved ejection fraction. N Engl J Med. 2021;385(16):1451–1461. doi: 10.1056/NEJMoa2107038.
- Shafie AA, Tan YP, Ng CH. Systematic review of economic burden of heart failure. Heart Fail Rev. 2018;23(1):131–145. doi: 10.1007/s10741-017-9661-0.
- Biermann J, Neumann T, Angermann CE, et al. Resource use and costs in systolic heart failure according to disease severity: a pooled analysis from the german competence network heart failure. J Public Health. 2012;20(1):23–30. doi: 10.1007/s10389-011-0452-0.
- Delgado JF, Oliva J, Llano M, et al. Health care and nonhealth care costs in the treatment of patients with symptomatic chronic heart failure in Spain. Rev Esp Cardiol (Engl Ed). 2014;67(8):643–650. doi: 10.1016/j.rec.2013.12.014.
- Czech M, Opolski G, Zdrojewski T, et al. The costs of heart failure in Poland from the public payer’s perspective. Polish programme assessing diagnostic procedures, treatment and costs in patients with heart failure in randomly selected outpatient clinics and hospitals at different levels of care: POLKARD. Kardiol Pol. 2013;71(3):224–232. doi: 10.5603/KP.2013.0032.
- Parissis J, Athanasakis K, Farmakis D, et al. Determinants of the direct cost of heart failure hospitalization in a public tertiary hospital. Int J Cardiol. 2015;180:46–49. doi: 10.1016/j.ijcard.2014.11.123.
- Moertl D, Steiner S, Coyle D, et al. Cost-utility analysis of nt-probnp-guided multidisciplinary care in chronic heart failure. Int J Technol Assess Health Care. 2013;29(1):3–11. doi: 10.1017/S0266462312000712.
- Adlbrecht C, Huelsmann M, Berger R, et al. Cost analysis and cost-effectiveness of nt-proBNP-guided heart failure specialist care in addition to home-based nurse care. Eur J Clin Invest. 2011;41(3):315–322. doi: 10.1111/j.1365-2362.2010.02412.x.
- Shepard DS. Cost-effectiveness in health and medicine. By M.R. Gold, J.E Siegel, L.B. Russell, and M.C. Weinstein (eds). New York: Oxford University Press, 1996. J Ment Health Policy Econ. 1999;2:91–92. doi: 10.1002/(SICI)1099-176X(199906)2:2<91::AID-MHP46>3.0.CO;2-I.
- Calvert MJ, Freemantle N, Yao G, et al. Cost-effectiveness of cardiac resynchronization therapy: results from the CARE-HF trial. Eur Heart J. 2005;26(24):2681–2688. doi: 10.1093/eurheartj/ehi662.
- Bundesministerium für Soziales, Gesundheit, Pflege und Konsumentenschutz. Überregionale Auswertung der Dokumentation in landesgesundheitsfondsfinanzierten Krankenanstalten 2021, Wien November 2022.
- Woods B, Revill P, Sculpher M, et al. Country-level cost-effectiveness thresholds: initial estimates and the need for further research. Value Health. 2016;19(8):929–935. doi: 10.1016/j.jval.2016.02.017.
- ICER Institute for Clinical and Economic Review. Overview of the ICER value assessment framework and update for 2017-2019, USA; 2017. Available from: https://icer-review.org/wp-content/uploads/2017/06/ICER-value-assessment-framework-update-FINAL-062217.pdf.
- Laramée P, Wonderling D, Swain S, et al. Cost-effectiveness analysis of serial measurement of circulating natriuretic peptide concentration in chronic heart failure. Heart. 2013;99(4):267–271. doi: 10.1136/heartjnl-2012-302692.
- Mohiuddin S, Reeves B, Pufulete M, et al. Model-based cost-effectiveness analysis of B-type natriuretic peptide-guided care in patients with heart failure. BMJ Open. 2016;6(12):e014010. doi: 10.1136/bmjopen-2016-014010.
- Siebert U, Milev S, Zou D, et al. Economic evaluation of an N-terminal Pro B-type natriuretic peptide-supported diagnostic strategy among dyspneic patients suspected of acute heart failure in the emergency department. Am J Cardiol. 2021;147:61–69. doi: 10.1016/j.amjcard.2021.01.036.
- Zaphiriou A, Robb S, Murray-Thomas T, et al. The diagnostic accuracy of plasma BNP and NTproBNP in patients referred from primary care with suspected heart failure: results of the UK natriuretic peptide study. Eur J Heart Fail. 2005;7(4):537–541. doi: 10.1016/j.ejheart.2005.01.022.
- Verfahrensordnung zur Herausgabe des Erstattungskodex nach § 351g ASVG – VO-EKO, amtlich verlautbart am 17.6.2004, Nr. 47/2004; zuletzt geändert durch die amtliche Verlautbarung Nr. 40/2020. Available from: https://www.ris.bka.gv.at/Dokumente/Avsv/AVSV_2004_0047/AVSV_2004_0047.pdfsig
- Schweizer eidgenossenschaft bundesamt für gesundheit BAG. Operationalisierung der Kriterien “Wirksamkeit, Zweckmässigkeit und Wirtschaftlichkeit” nach Artikel 32 des Bundesgesetzes über die Krankenversicherung (KVG), Version Stand 31.03.2022. Available from: file://Users/ew/Downloads/Operationalisierung%20der%20WZW-Kriterien%20vom%2031.03.2022,%20g%C3%Bcltig%20ab%2001.09.2022%20(1).pdf
- Bundesministerium für Gesundheit. Arbeitsunfähigkeit: fälle und Tage nach Diagnosen 2019. Available from: https://www.bundesgesundheitsministerium.de/fileadmin/Dateien/3_Downloads/Statistiken/GKV/Geschaeftsergebnisse/AU_nach_Diagnosen_2019.pdf
- Schweizer Eidgenossenschaft Bundesamt für Statistik. Erwerbsquote nach Geschlecht Nationalität, Altersgruppe, Familientyp. Available from: https://www.bfs.admin.ch/bfs/de/home/statistiken/querschnittsthemen/wohlfahrtsmessung/indikatoren/erwerbsquote.assetdetail.25085638.html
- Statistik Austria. Erwerbstätigkeit. Available from: https://www.statistik.at/statistiken/bevoelkerung-und-soziales/gender-statistiken/erwerbstaetigkeit
- Schweizer Eidgenossenschaft Bundesamt für Statistik. Schweizerische Lohnstrukturerhebung. Available from: https://www.bfs.admin.ch/bfs/de/home/statistiken/arbeit-erwerb/erhebungen/lse.html
- Statistik Austria. Jährliche Personeneinkommen. Available from: https://www.statistik.at/statistiken/bevoelkerung-und-soziales/einkommen-und-soziale-lage/jaehrliche-personeneinkommen
- Beaudet A, Clegg J, Thuresson PO, et al. Review of utility values for economic modeling in type 2 diabetes. Value Health. 2014;17(4):462–470. doi: 10.1016/j.jval.2014.03.003.