
 ?Mathematical formulae have been encoded as MathML and are displayed in this HTML version using MathJax in order to improve their display. Uncheck the box to turn MathJax off. This feature requires Javascript. Click on a formula to zoom.
Abstract
Aim
Increasing trend for progression-free survival (PFS)-based primary endpoint in oncology has led to lack of mature overall survival (OS) data at the time of approval. To address this evidence gap in economic evaluations, we used a joint Bayesian approach to predict survival outcomes using immature OS data from the RELAY trial.
Methods
Patient data from RELAY and systematic literature review (SLR) of phase 3 randomized clinical trials with hazard ratio (HR) estimates of mature PFS and immature OS were considered. OS and PFS were analyzed individually using a univariate model; bivariate analysis was performed using a joint model based on modified Bayesian normal induced copula estimation model. First, a Bayesian univariate model incorporated informative priors based on predicted HR and acceleration factor for OS and PFS. Second, a Bayesian-based joint model of RELAY PFS and OS data was based on the correlation between PFS and OS established in trials of similar populations. Marginal distribution of PFS was used to estimate the same for OS.
Results
Publications (N = 122) of first-line treatments in patients with epidermal growth factor receptor (EGFR)-mutated non-small cell lung cancer were identified in the SLR, of which 36 trials were linked to RELAY. Twenty-six trials with HR data were used. The univariate model could predict OS with reduced uncertainty compared with the frequentist approach. In the joint model, the marginal OS distribution borrowed strength from the marginal PFS distribution through the established correlation coefficient.
Limitations
Bayesian approach was successfully used in RELAY analysis but may not be universally applied to oncology trials due to the different associations of OS and PFS and different trial patient populations.
Conclusions
We demonstrated that both the univariate and joint Bayesian models reduced uncertainty in predicting OS compared to frequentist method. The methodology introduced here will have potential applications in clinical decision-making for other oncology trials.
Introduction
In the field of oncology, the criteria by which drugs receive regulatory approval are ever evolving. An increasing number of drug approvals in the metastatic setting are now based primarily on progression-free survival (PFS) outcomesCitation1. Correspondingly, the increase in PFS-based drug approvals, along with an increase in expedited approvals of anticancer and biologics in drug development, has resulted in the lack of mature overall survival (OS) data at the time of regulatory approval.
The immaturity of OS data presents a significant challenge for health technology assessment (HTA) bodies in countries where a cost-effectiveness model is required for reimbursement purposes. The OS data were used to calculate life years, and quality adjusted life years in cost-effectiveness analyses. Therefore, mature OS data are required to analyze drug cost-effectiveness.
In the countries where cost-effectiveness analysis is critical for decision making, uncertainty in OS outcomes is a significant challenge when evaluating a new therapy. Partitioned survival models in a frequentist framework have become the standard in recent oncology HTA submissions in the metastatic setting. However, these model results are highly sensitive to immature OS data. In cases where patients are living longer, OS data are often immature, leading to uncertainty associated with survival outcomes and reluctancy of HTA bodies to recommendCitation2. To this end, due to the lack of mature OS evidence, many promising anticancer therapies with superior PFS results may not become fully accessible to patients soon after approval. Thus, there is a pressing need to address payer agencies’ criticism about uncertainty resulting from immature OS in economic models.
Non-small cell lung cancer (NSCLC) represents around 85% of all lung cancersCitation3–5. Each year, approximately 2.1 million individuals are diagnosed with lung cancer; and the majority of those with NSCLC present with advanced or metastatic disease statesCitation6–9. The finding that, genetically, NSCLC is a highly heterogenous disease, and that these genetic alterations that drive initial tumor growth and progression in some forms of NSCLC can be targeted, has redefined the treatment landscape of lung cancerCitation10. In the United States, it is estimated that around 19% of people diagnosed with NSCLC have an epidermal growth factor receptor (EGFR) mutationCitation11. For these patients, EGFR tyrosine kinase inhibitors (TKIs) are the first-line standard of careCitation12. However, although patients respond positively to TKIs at first, resistance is inevitable and usually develops it in under 19 months of treatmentCitation13,Citation14. The use of combination therapy regimens to further slow NSCLC disease progression and resistance to TKIs is a growing area of interest. The combination of vascular endothelial growth factor (VEGF) inhibitors with EGFR TKIs is one such approach, which is already proving promising.
The randomized phase 3 RELAY trial (NCT02411448) was conducted to investigate the efficacy of ramucirumab, a selective antagonist of VEGF receptor 2 (VEGFR2), in combination with erlotinib versus placebo and erlotinib, as first-line treatment in adults with metastatic EGFR-mutated NSCLC. At the time of primary analysis, median PFS was significantly longer in the ramucirumab plus erlotinib group (19.4 months (95% CI 15.4–21.6)) compared to the placebo plus erlotinib group (12.4 months (95% CI 11.0–13.5)), with a stratified hazard ratio (HR) of 0.59 (95% CI 0.46–0.76; p < .0001)Citation15. Based on a statistically significant and clinically meaningful improvement in PFS, ramucirumab plus erlotinib received regulatory approvalCitation16,Citation17.
In countries where reimbursement decisions are based on HTA bodies, the cost-effectiveness of ramucirumab plus erlotinib will be compared to other treatment options. At the time of the primary analysis of RELAY, interim OS demonstrated no detrimentCitation15. However, HTA bodies have previously criticized the immaturity of OS data for first-line treatments in patients with EGFR-mutated NSCLC, including osimertinib (FLAURA trial − 25% mature) and dacomitinib (ARCHER trial – >45% mature), despite PFS data being fully mature, statistically significant, and clinically meaningful at the time of the primary analysisCitation18,Citation19. In the ramucirumab RELAY trial, the OS data maturity level was 26% (79 of 300 planned OS events at final analysis with censoring rate 82% (370 of 449))Citation15.
Using the ramucirumab RELAY trial as a case study, our modeling framework addresses the issue of immature OS data by using two Bayesian approaches to improve projected OS estimates for patients with NSCLC within the study period and the extrapolated survival probability beyond the study period from immature data and external data. First, a univariate modeling approach was applied, incorporating informative priors to inform RELAY OS marginal distribution. External data, including HR, Kaplan–Meier (KM), and accelerated failure time (AFT) coefficient estimates for OS and PFS derived from 26 other trials in patients with first-line treatment naïve patients with EGFR-positive NSCLC, were used to formulate the informative prior. By combining these pre-existing data, we reveal that treatment effect in PFS can inform treatment effect in OS. Due to this correlation, a predicted effect in OS (HR and AFT) was derived for RELAY using the observed effect in PFS of the trial, and the resulting predicted effect in OS (HR and AFT) was used as the informative prior in a Bayesian survival model.
The second approach is a Bayesian-based joint model of RELAY PFS and OS data. Depending on the extent to which RELAY PFS is associated with RELAY OS, the marginal OS distribution is expected to borrow strength from the marginal distribution of PFS through the correlation allowed by the joint model. In addition, the correlation coefficient between OS and PFS will be informed by a prior distribution constructed by data from trials conducted in a similar population to the RELAY trial. Here, we applied this joint Bayesian approach to predict RELAY survival outcomes based on the immature OS data.
Methods
Sources of data
Two main sources of data were used in this analysis.
Individual patient data
Individual patient data (IPD) from the primary analysis of the randomized, placebo-controlled, phase 3 RELAY trial (NCT02411448) are one of the main data sources (data cutoff occurred on 23 January 2019). This included mature PFS, however, OS was immature (censoring rate of 82%) at the time of the primary analysis. Final OS, a secondary objective of RELAY and that the study is not powered to detect an OS difference, will be evaluated after approximately 300 deaths have occurred. RELAY investigated the efficacy of ramucirumab in combination with erlotinib in first-line treatment of adults with metastatic NSCLC, versus placebo plus erlotinib.
Systematic literature review data
The other source of data was a systematic literature review (SLR) conducted via Ovid. A SLR was performed to identify randomized phase 3 trials in first-line patients with advanced (stage III/IV) EGFR-mutated NSCLC, to the RELAY trial. Studies with available HR estimates of PFS and OS were used for this analysisCitation20.
Analysis data type
OS analysis – univariate model
First, a linear predictive model was developed using data from 26 randomized phase 3 trials of first-line treatments for patients with EGFR-mutated NSCLC with OS HR (on log scale) acting as a dependent variable and PFS HR (on log scale) as a predictor. This predicted OS HR (log scale) for RELAY was incorporated in the Bayesian model as the mean of the prior distribution of log HR assumed to be normally distributed for parametric distributions allowing proportional hazards (exponential, Weibull and Gompertz).
A similar linear model based on treatment effect derived from AFT was considered for the distributions that do not have proportional hazards (log-logistic, log-normal, and generalized gamma). KM curves were published for 17 trials only. These curves were extracted and pseudo IPD were reconstructed based on the method described by Guyot et alCitation21. The resulting survival data were used to construct the linear regression model that predicts the OS AFT based on PFS AFT. Subsequently, the OS acceleration factor for RELAY was predicted using the observed RELAY acceleration factor of PFS for each of the AFT distributions.
PFS analysis – univariate model
A univariate Bayesian model assuming non-informative prior distributions was considered for PFS. The posterior distribution was based solely on the observed RELAY PFS data. The resulting univariate model PFS should be comparable to the RELAY trial PFS results, which were analyzed using a frequentist approach.
OS and PFS analysis – joint model
The joint model is based on a Bayesian normal induced copula estimation model modified to analyze five additional distributions beyond the exponential distribution that was reported by Fu et alCitation22. This model assumed a known correlation coefficient value between OS and time-to-progression (TTP). As TTP data were not routinely reported in the identified trials from the SLR, the correlation coefficient between OS and PFS was considered. The estimation of the correlation coefficient also required an assumption about the correlation between OS and PFS. Two approaches for estimating the Pearson correlation were considered using 17 randomized trials of first-line treatments for patients with EGFR-mutated NSCLC, where the HR estimates were available for both OS and PFS. The first approach was based on Fleischer et alCitation23. assuming exponential distribution for OS and PFS. The second was based on the finding of Li and ZhangCitation24 with the assumption that OS and PFS follow the Weibull distribution.
Various distributions were considered for the likelihood function, including the six distributions of interest.
Model for treatment effect
Treatment effect is modeled as the acceleration factor in the accelerated failure models (log-logistic, log-normal, and generalized gamma) and as a constant HR for distributions that allow proportional hazards (exponential, Weibull and Gompertz).
Bayesian modeling approach
OS analysis – univariate model
For the univariate Bayesian modeling approach, non-informative prior distributions were used for all parameters of the six parametric distributions except for treatment effect. Non-informative prior distributions may be eventually extended to minimal information in the priors. An informative prior was used for the treatment effect measured by log HR or log AFT. Specifically, the coefficient followed a normal distribution with mean and variance corresponding to the predicted OS effect for RELAY (transformed on the log scale) and its variance, respectively. The formulation was given by the following equation:
A similar linear model based on treatment effect derived from AFT was considered for the distributions that do not rely on proportional hazards and HRs (log-logistic, log-normal, and generalized gamma). Only the 17 trials that report that KM were used to predict the OS acceleration factor for the RELAY using the acceleration factor of PFS.
PFS analysis – univariate model
Non-informative prior distributions were used for parameters of the six parametric distributions.
OS and PFS analysis – joint model
A uniformly distributed prior for correlation coefficient was considered for the joint modeling Bayesian approach, the lower and upper bound parameters correspond respectively to minimum and maximum estimated correlations among the 17 studies in the SLR from which the estimation was possible:
is the estimated Pearson correlation for the trial k from the SLR results.
Likelihood function
OS analysis – univariate model
Bayesian methods involved formal combination of a prior probability distribution with the likelihood obtained from a sampling distribution used to model the observed data to obtain a posterior probability distribution of model parameters. The likelihood informed us about the extent to which different values for the parameter of interest were supported by the data.
The RELAY studied IPD were right censored for OS. The and
were the probability density function and the survival function of the parametric distribution, respectively, with
as parameter vector. Each patient then contributed
at observed time
when the event was death and contributed
when the event was censoring.
The probability density function, and the survival function
were known for all six distributions of interest: exponential, Weibull, Gompertz, log-logistic, log-normal, and generalized gamma. The data consist of
replications denoted as
for patient
where
was the follow-up time for OS of patient
which was time to death or censoring whichever happened first and
was binary variable equal to 1 when the patient
died and 0 when the patient was censored. Assuming non-informative censoring, the likelihood function was:
PFS analysis – univariate model
The univariate model for PFS analysis used the same likelihood function formulation as described in the univariate model analysis of OS.
OS and PFS analysis – joint model
The likelihood function was specified in the same way as the method proposed by Fu et alCitation22. The data consisted of replications denoted as
where
was the follow-up time for OS which was time to death or censoring whichever happened first and
equals 1 when the patient died and 0 when the patient was censored. Similarly,
was the follow-up time for PFS and
was the corresponding status.
There are four mutually exclusive cases for each patient:
Case 1: OS (death) was observed (
) and TTP (progression) was also observed (
The contribution to the likelihood function was in this case determined by the probability density function of the joint distribution (OS, TTP).
2. Case 2: OS (death) was observed (
The contribution to the likelihood function was in this case determined by the joint probability that death was observed and TTP was censored by death.
3. Case 3: OS time was censored at time (
The contribution to the likelihood function was in this case determined by the joint probability that TTP was observed and death was censored.
4. Case 4: OS and TTP times were censored at time
When and
were the two vectors of parameters in the hazard functions of TTP and OS time, respectively, and
was the correlation coefficient between TTP and OS, with non-informative censoring assumption, the likelihood function was given by:
where
is the probability density function for joint distribution of TTP and OS; and
and
were the partial derivatives of joint distributions relative to TTP and OS, respectively.
A similar approach to Fu et alCitation22. based on copula was taken to generate the joint distribution of OS and TTP using the observed Pearson correlation between OS and TTP from the SLR studies. In addition to exponential distribution used in Fu et alCitation22., the five parametric distributions usually required by HTA bodies in frequentist context were fitted to. Thus, the following six distributions were shown in the Bayesian joint model of OS and TTP: exponential, Weibull, Gompertz, log-logistic, log-normal, and generalized gamma. Afterwards, the PFS was derived based on OS and TTP by simulation as proposed by Fu et alCitation22.
Results
Results of the systematic literature review
In total, 122 publications of first-line treatments in patients with EGFR-mutated NSCLC were identified in SLR, of which 57 were found to be unique trials investigated in a first-line settingCitation20. Thirty-six randomized controlled trials reported data for any endpoint assessed and directly or indirectly connected to a treatment in the RELAY trial through TKI monotherapy or combination therapies, as previously described in the meta-analysis by Haeussler et alCitation20. However, for this analysis, trials identified during the literature review that did not report HR for both PFS and OS were excluded as both data points were required to develop the linear model. Based on these criteria, 26 of the identified 36 trials were included in this study. The baseline characteristics of the target population varied across the included trials. While the distribution of age, sex, percentage of ever smokers, and ECOG PS were widely varied, the distribution of NSCLC histological subtype was consistent across the trials, with the exception of TORCH trialCitation20. Overall, the similarity assumption held except for patients with brain and central nervous system (CNS) metastases. As previously demonstrated, through the application of unrelated means models to the data, the assumptions of consistency and transitivity were deemed to hold. This indicated that there were comparable distributions of known effect modifiers between studiesCitation20.
OS analysis – univariate model
The interim stratified OS HR 0.83 (95% CI 0.53–1.30) was evaluated at the time of data lockCitation15 out of the 26% of planned events for final OS analysis. First, a univariate Bayesian modeling approach was applied to extrapolate OS using informative prior to inform the marginal distribution from 26 trials similar to the RELAY trial. The fitted Weibull, exponential, and Gompertz curves are plotted against the nonparametric (KM) curves in , Supplementary Figures 1 and 2, respectively, from which an adequacy of fit and an increasing separation between the curves over time was observed. The resulting estimates of model parameters were consistent with the frequentist immature OS; however, the credible interval limits were much smaller than the 95% CI associated with the frequentist estimates. Upon the final analysis at 300 total OS events, the projected KM estimate of median OS was predicted to be longer for the ramucirumab plus erlotinib arm compared to the placebo plus erlotinib arm (). The resulting HR for OS obtained with the Bayesian univariate model with informative prior was 0.82 (95% credible interval 0.75–0.90), which is consistent with the point estimate of the frequentist HR; however, the 95% credible interval was smaller than the 95% CI associated with the frequentist HR ().
Figure 1. Placebo plus erlotinib and ramucirumab plus erlotinib Kaplan–Meier’s survival curve with estimated survival probability via the Weibull distribution with informative prior. Abbreviations. Erl, Erlotinib; PBO, Placebo; OS, Overall survival; RAM, Ramucirumab.
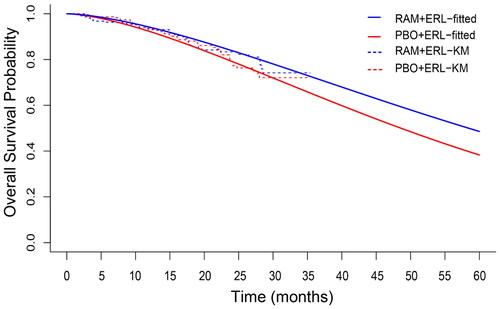
Table 1. Summary of posterior distribution of parameters for overall survival (OS) using informative prior distribution.
Table 2. Hazard ratio for overall survival using a Bayesian and frequentist approach.
PFS analysis – univariate model
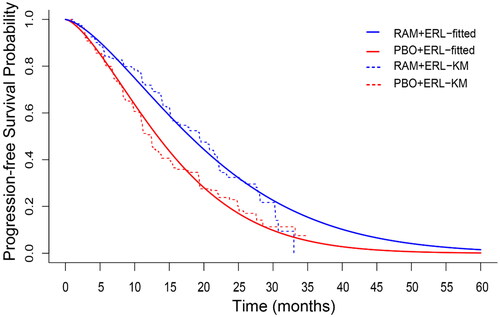
Using a frequentist approach to predict PFS, it was found that ramucirumab plus erlotinib group (median PFS, 19.4 months (95% CI 15.4–21.6)) PFS was significantly longer than placebo plus erlotinib group (median PFS, 12.4 months (95% CI 11.0–13.5)), with a stratified HR of 0.59 (95% CI 0.46–0.76)Citation15. RELAY PFS data were re-analyzed using a Bayesian framework to ensure consistency between the frequentist and Bayesian approaches (Supplementary Table 1). In this case, a univariate Bayesian model with a non-informative prior distribution was considered for PFS; the posterior distribution was based solely on the observed data in the RELAY trial. The resulting point and interval estimates were expected to be the same for both approaches; the Bayesian framework provided additional information about model parameter distributions. Near equivalent log HRs for PFS were obtained with the Bayesian univariate model with vague Gaussian non-informative prior (HR 0.59; 95% CI 0.46–0.75), and the parametric frequentist model (HR 0.59; 95% CI 0.46–0.76) ( and Supplementary Table 2). The fitted exponential and Gompertz curves were plotted over the PFS KM curves in Supplementary Figures 3 and 4, respectively.
Figure 2. Placebo plus erlotinib and ramucirumab plus erlotinib Kaplan–Meier’s survival curve with estimated progression-free survival probability via the Weibull distribution with informative prior. Abbreviations. Erl, Erlotinib; PBO, Placebo; PFS, Progression-free survival; RAM, Ramucirumab.
After demonstrating that a Bayesian approach could be used to accurately predict PFS using mature data, we next explored whether an OS could be predicted using mature PFS data with less uncertainty.
Model selection
The systematic model selection usually provided in frequentist model fitting was still applicable; the traditional frequentist good-fit statistics akaike information criterion (AIC) and Bayesian information criterion (BIC) for model selection were replaced by the Bayesian model fit statistics deviance information criterion (DIC), Dbar and Dmean and pD. Supplementary Tables 3 and 4 display these statistics for RELAY PFS Bayesian model fitting with non-informative prior.
OS and PFS analysis – joint model
Next, a joint Bayesian modeling approach was applied that assumed a correlation exists between RELAY OS and PFS in patients with NSCLC. The correlation coefficient between OS and PFS was informed by a prior distribution constructed using data from 17 of the 26 randomized trials of first-line treatments in patients with EGFR-mutated NSCLC (where reconstructed KM estimates for both OS and PFS were available). depicts the observed PFS and OS KM curves by treatment arm, overlaid by the estimated Weibull marginal distributions of OS and PFS based on the joint Bayesian model of OS and TTP. The figure demonstrated that the predicted marginal Weibull model for PFS visually fitted well to the observed PFS KM curve. Moreover, the model-estimated curve for OS was aligned with the observed OS data. Comparable results were observed for each distribution (Supplementary Figures 5–8); however, the Weibull distribution was being utilized to illustrate the findings. demonstrates that the correlation between OS and PFS (median and mean of posterior) was strong. Interestingly, the correlation coefficients were consistent across each probability distribution.
Figure 3. Fitted Weibull distribution overlaid by Kaplan–Meier’s curves of (A) overall survival, and (B) progression-free survival, by treatment.
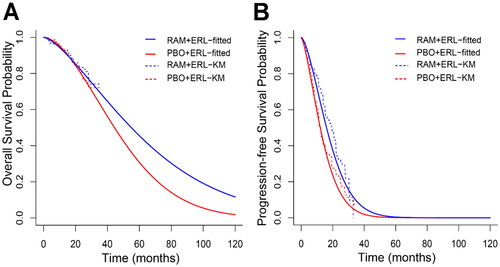
Table 3. Summary of posterior distribution of parameters for overall survival (OS) and progression-free survival (PFS) based on the joint model.
Discussion
As a result of the rapid evolution of the oncology drug therapy landscape, in which patients can receive multiple lines of treatment, the design of clinical oncology trials has shifted away from OS toward PFS as the primary endpoint. Thus, OS data are commonly immature during regulatory approval of oncology therapeutics. Consequently, the level of maturity of OS data required for regulatory approval differs from that required for drug appraisal by HTA bodies, creating a discrepancy that needs to be addressed.
While clinical trial data drive regulatory approval, multiple other sources of data can be used in HTA dossiers to inform how interim OS data are likely to mature based on observed PFS. This includes comparative analyses of published PFS and OS data from competitive treatments to inform the relative treatment effects among comparators in cost-effectiveness models. Still, uncertainty around predicting outcomes based on immature OS data in cost-effectiveness models remains a challenge that needs to be addressed to facilitate decision-making by HTA bodies. In this analysis, the Bayesian framework was applied to unify aggregated published data, and patient-level mature PFS and interim OS data from clinical trials in order to reduce uncertainty around outcomes based on immature OS in the cost-effectiveness models.
A standard partitioned survival model in the metastatic setting requires both PFS and mature OS to estimate life years in progression-free and post-progression health states. Furthermore, for surrogate endpoints like PFS to be accepted along with immature OS by HTA bodies, two independent conditions must be met. First, a clear relationship of PFS with OS must be demonstrated, and second, the relationship must then be validated in clinical studies in the relevant disease setting and target population.
Here, our work applied a new unified modeling approach. We used the RELAY trial as a case study to explore alternative solutions for conducting survival analyses in economic modeling with immature OS data. Weibull distribution was utilized to model and depict survival data as both AFT and proportional hazard models can be formulated based on the same. Moreover, Weibull was the best fit model based on deviance information criteria. Equivalent PFS values were obtained using a univariate Bayesian approach without informative prior compared to the traditional frequentist approach.
After determining that a correlation existed in treatment effects between PFS and OS, a prior belief about OS effect could be built using known PFS effect and the established relationship in treatment effects between OS and PFS in other studies of patients with EGFR-mutated NSCLC. It should be noted that the correlation of PFS and OS in RELAY and in other clinical NSCLC studies enables the success of this approach and is an important initial consideration. Our findings demonstrated that the Bayesian univariate model approach could be utilized to predict OS with reduced uncertainty compared to the frequentist approach by borrowing prior information from SLR findings. These findings were similar between the frequentist and univariate Bayesian approaches when no external information was used. For the joint Bayesian model approach, mature PFS data from the RELAY trial were used to inform immature OS data from the trial. The Pearson coefficient established from 17 clinical trials demonstrated that the correlation between PFS and OS was high enough to be used. The correlation coefficient then acted as an informative prior to accurately estimate the marginal distribution of OS. This suggests that, as expected, the marginal OS distribution borrowed strength from the marginal distribution of PFS through the established correlation coefficient. Moreover, the predicted estimate of OS was superior for the ramucirumab plus erlotinib arm compared to the placebo plus erlotinib arm, confirming the interim OS result. While the predictive model does not resolve problems associated with immature OS data, the consistent narrow credible intervals across all distributions reduces the uncertainty.
Based on these findings, the joint Bayesian model is reasonably predictive for OS, and may be a useful tool for economic modeling. As with the traditional frequentist approach, both the univariate and joint Bayesian models allowed fitting of six standard parametric distributions and used the same model selection and validation process per the NICE guidelines. In addition, the Bayesian framework offers the entire posterior distribution for the model parameters that can be directly used in the probabilistic sensitivity analysis (PSA) required by HTA bodies, as an alternative to extensive simulations of clinical trial data within the cost-effectiveness model. The resulting PSA carrying the uncertainty in survival predictions through posterior distributions of parameters may support addressing HTA driven payer agencies’ criticism of immature OS in economic models.
The use of this methodology has the potential to have a positive impact on a variety of stakeholders. From the perspective of HTA bodies, they have the ability to make more informed evaluations of the drug’s cost-effectiveness in cancers where PFS and OS are correlated. Finally, because this approach provides reasonable predictions before mature OS data are seen, medicines may be evaluated and become accessible to patients earlier. In addition, the approach may allow for resources to be further directed at additional clinical development.
Notwithstanding, this approach has limitations in that it cannot be universally applied to all clinical trials because the associations between OS and PFS can differ between cancer types, and it does not account for differences in trial patient populations. In other studies, PFS has been shown to be a poor predictor of OSCitation25. In colorectal cancer, the correlation seems to be well defined, and several authors have shown that PFS is a good predictor of OS. However, the initial approval of bevacizumab for treatment of metastatic breast cancer based on significant PFS results was followed by the disapproval based on insignificant OS resultsCitation25. Furthermore, some clinical trials may have a limited amount of external data to add to the model’s strength. Thus, the results of the model are a prediction and there is a risk that they may not be the final observed result.
Ultimately, while the proposed methods help reduce the uncertainty around OS in the context of clinical trials, a combination of clinical trial data and real-world data may be ideal for informing this approach, there is a fundamental limitation for all trial data as primary sources for HTA submissions. Both observed KM estimates of survival (OS and PFS) and extrapolations beyond study period would require external validation based real-world data. The proposed approaches in this manuscript are not exceptions in that respect. Nevertheless, we believe that the eligible trials for the construction of the prior correlation must be clinically and methodologically similar to the RELAY trial. In addition, such real-world data are not available for experimental new treatments at the time when the proposed methodology is intended for use. The findings of the proposed methods need to be re-assessed once long-term follow-up data in real-world settings are available. Nevertheless, progression is not assessed systematically in the real-world setting as it is in a clinical trial, and this discrepancy could further introduce potential bias.
Conclusions
As breakthrough cancer therapies continue to extend OS of patients, and especially in the dawning era of precision medicine, we anticipate an increasing number of drug approvals based on strong treatment effects on outcomes such as PFS, accompanied by immature OS data. Here, we demonstrated that both the univariate and joint Bayesian models reduced uncertainty in predicting OS. While Weibull was used to depict the findings, similar results were observed across all distributions analyzed. This work will have a broader impact, with potential applications for other oncology trials in clinical decision-making and optimal treatment decision making when known correlation between PFS and OS exists. If survival prospects are predicted to be positive this may then lead to more informative decision-making among HTA bodies that assess cost-effectiveness of treatments to allow for patient access. In a much wider context, this approach underlines the importance of using a unified framework to bring all available evidence together, including both within and outside the trial, to reduce extrapolation uncertainty of predicting outcomes of clinical trial endpoints. Nevertheless, a combination of clinical trial data and real-world data is ideal for informing this approach for both internal and external validation.
Transparency
Declaration of financial/other relationships
ST, AS, KBW, KLT, and MHJ are current employees of and own shares in Eli Lilly and Company.
Author contributions
ST: study conception, study design, data acquisition, data analysis, data interpretation, drafting, and critical revision for important intellectual content. AS: data interpretation and critical revision for important intellectual content. KBW: study conception, data interpretation, and critical revision for important intellectual content. KLT: data acquisition, data interpretation, and critical revision for important intellectual content. MHJ: study conception, study design, data interpretation, drafting, and critical revision for important intellectual content.
Acknowledgements
The authors would like to thank Declan O’Dea and Sinead O'Loughlin from Eli Lilly and Company, and Keerthana Muthiah and Maanasa Surampally from Eli Lilly Services India Private Limited for their medical writing/editing support.
Reviewer disclosure statements
Peer reviewers on this manuscript have no relevant financial or other relationships to disclose.
Supplemental Material
Download ()Additional information
Funding
References
- FDA. Table of surrogate endpoints that were the basis of drug approval or licensure; 2022. Available from: https://www.fda.gov/drugs/development-resources/table-surrogate-endpoints-were-basis-drug-approval-or-licensure
- Woods BS, Sideris E, Palmer S, et al. Partitioned survival and state transition models for healthcare decision making in oncology: where are we now? Value Health. 2020;23(12):1613–1621. doi: 10.1016/j.jval.2020.08.2094.
- Fitzmaurice C, Dicker D, Pain A, et al. The Global Burden of Cancer 2013. JAMA Oncol. 2015;1(4):505–527.
- Midha A, Dearden S, McCormack R. EGFR mutation incidence in non-small-cell lung cancer of adenocarcinoma histology: a systematic review and global map by ethnicity (mutMapII). Am J Cancer Res. 2015;5(9):2892–2911.
- Duma N, Santana-Davila R, Molina JR. Non-Small cell lung cancer: epidemiology, screening, diagnosis, and treatment. Mayo Clin Proc. 2019;94(8):1623–1640. doi: 10.1016/j.mayocp.2019.01.013.
- Bray F, Ferlay J, Soerjomataram I, et al. Global Cancer Statistics 2018: GLOBOCAN estimates of incidence and mortality worldwide for 36 cancers in 185 countries. CA Cancer J Clin. 2018;68(6):394–424. doi: 10.3322/caac.21492.
- Goldstraw P, Chansky K, Crowley J, et al. The IASLC Lung Cancer Staging Project: proposals for revision of the TNM stage groupings in the forthcoming (eighth) edition of the TNM classification for lung cancer. J Thorac Oncol. 2016;11(1):39–51. doi: 10.1016/j.jtho.2015.09.009.
- Thandra KC, Barsouk A, Saginala K, et al. Epidemiology of lung cancer. Contemp Oncol. 2021;25(1):45–52.
- Blandin Knight S, Crosbie PA, Balata H, et al. Progress and prospects of early detection in lung cancer. Open Biol. 2017;7(9):170070. doi: 10.1098/rsob.170070.
- Chen Z, Fillmore CM, Hammerman PS, et al. Non-small-cell lung cancers: a heterogeneous set of diseases. Nat Rev Cancer. 2014;14(8):535–546. doi: 10.1038/nrc3775.
- Li Y, Appius A, Pattipaka T, et al. Real-world management of patients with epidermal growth factor receptor (EGFR) mutation-positive non-small-cell lung cancer in the USA. PLOS One. 2019;14(1):e0209709. doi: 10.1371/journal.pone.0209709.
- Holleman MS, van Tinteren H, Groen HJ, et al. First-line tyrosine kinase inhibitors in EGFR mutation-positive non-small-cell lung cancer: a network meta-analysis. Onco Targets Ther. 2019;12:1413–1421. doi: 10.2147/OTT.S189438.
- Li J, Kwok HF. Current strategies for treating NSCLC: from biological mechanisms to clinical treatment. Cancers. 2020;12(6):1587. doi: 10.3390/cancers12061587.
- Leonetti A, Sharma S, Minari R, et al. Resistance mechanisms to osimertinib in EGFR-mutated non-small cell lung cancer. Br J Cancer. 2019;121(9):725–737. doi: 10.1038/s41416-019-0573-8.
- Nakagawa K, Garon EB, Seto T, et al. Ramucirumab plus erlotinib in patients with untreated, EGFR-mutated, advanced non-small-cell lung cancer (RELAY): a randomised, double-blind, placebo-controlled, phase 3 trial. Lancet Oncol. 2019;20(12):1655–1669. doi: 10.1016/S1470-2045(19)30634-5.
- EMA. Committee for Medicinal Products for Human Use/676031/2019. Summary of opinion (post authorisation); 2019. Available from: https://www.ema.europa.eu/en/documents/smop/chmp-post-authorisation-summary-positive-opinion-cyramza-ii-33_en.pdf
- FDA. FDA approves ramucirumab plus erlotinib for first-line metastatic NSCLC; 2020. Available from: https://www.fda.gov/drugs/drug-approvals-and-databases/fda-approves-ramucirumab-plus-erlotinib-first-line-metastatic-nsclc
- NICE. Final appraisal document. Osimertinib for untreated EGFR mutation positive non-small-cell lung cancer; 2019. Available from: https://www.nice.org.uk/guidance/ta621/documents/final-appraisal-determination-document
- NICE. Single technology appraisal. Dacomitinib for untreated EGFR-positive non-small-cell lung cancer; 2019. Available from: https://www.nice.org.uk/guidance/ta595/evidence/appraisal-consultation-committee-papers-pdf-6894963614
- Haeussler K, Wang X, Winfree KB, et al. Efficacy and safety of first-line therapies in EGFR-mutated advanced non-small-cell lung cancer: a network meta-analysis. Future Oncol. 2022;18(16):2007–2028. doi: 10.2217/fon-2021-0885.
- Guyot P, Ades AE, Ouwens MJNM, et al. Enhanced secondary analysis of survival data: reconstructing the data from published Kaplan–Meier survival curves. BMC Med Res Methodol. 2012;12(1):9. doi: 10.1186/1471-2288-12-9.
- Fu H, Wang Y, Liu J, et al. Joint modeling of progression-free survival and overall survival by a Bayesian normal induced copula estimation model. Stat Med. 2013;32(2):240–254. doi: 10.1002/sim.5487.
- Fleischer F, Gaschler-Markefski B, Bluhmki E. A statistical model for the dependence between progression-free survival and overall survival. Stat Med. 2009;28(21):2669–2686. doi: 10.1002/sim.3637.
- Li Y, Zhang Q. A Weibull multi-state model for the dependence of progression-free survival and overall survival. Stat Med. 2015;34(17):2497–2513. doi: 10.1002/sim.6501.
- Miles DW, Chan A, Dirix LY, et al. Phase III study of bevacizumab plus docetaxel compared with placebo plus docetaxel for the first-line treatment of human epidermal growth factor receptor 2-negative metastatic breast cancer. J Clin Oncol. 2010;28(20):3239–3247. doi: 10.1200/JCO.2008.21.6457.