
Abstract
Aims
This study aimed to evaluate the value and affordability of insulin glargine 300 U/mL (Gla-300) in a budget impact model from a United States (U.S.) payer perspective by leveraging recent real-world evidence (RWE) studies and incorporating the recent insulin price caps where applicable.
Materials and methods
An economic model for a hypothetical one million U.S. health-plan population was developed to assess the budgetary impact of therapeutic interchanges in either direction between the two long- and longer-acting basal insulins (BIs) for patients with type 2 diabetes over a three-year model horizon. The utilization of long-acting BIs, longer-acting BIs, biosimilar BIs, and insulin degludec (IDeg-100) were informed by IQVIA data and internal forecasting at Sanofi. The DELIVER-2 and DELIVER-naïve studies provided healthcare resource utilization (HCRU) parameters. In the model base case, 24% of patients switched from long-acting BIs to insulin glargine biosimilars, IDeg-100, and other longer-acting BIs (Gla-300) by projected year 3.
Results
The base case total costs were $10,145 per patient per year (PPPY) in year 3 for the cumulative population. When all patients switched to Gla-300, the total costs in year 3 were $8,799, reflecting a net savings of -$660 PPPY compared to the budget increase of $686 PPPY in the base case. However, the longer-acting to long-acting BIs reversal scenario demonstrated a budgetary decrease of $676 PPPY over the model horizon. The reduction in incremental PPPY cost of $93 was observed using net drug costs rather than wholesale acquisition costs (WAC).
Limitations
The market shares for years 1–3 were based on expectations supported by the clinicians’ expert opinions and were not obtained from real-world data.
Conclusions
The economic value of increased utilization of Gla-300 was driven by the reduction in HCRU, costs and market shares assumptions. Budgetary reductions were achieved by switching patients from long-acting BIs to Gla-300.
PLAIN LANGUAGE SUMMARY
Type 2 Diabetes (T2D) is a chronic and debilitating condition that can lead to severe macro or microvascular complications. To mitigate these complications, it is crucial to effectively manage blood glucose levels. When other treatments prove ineffective in achieving adequate glucose control, insulin-based therapy becomes necessary. However, insulin-based treatments often come with the risk of hypoglycemic episodes, which can lead to increased utilization of healthcare resources (HCRU) and have a negative impact on costs.
This study aimed to assess the budgetary impact of higher market shares of longer-acting basal insulins (specifically insulin glargine Gla-300) compared to long-acting basal insulins, insulin glargine biosimilars, and insulin degludec (IDeg) in the treatment of T2D. The perspective taken was that of a U.S. payer, taking into account the recent insulin price caps where applicable.
The economic benefit of increased utilization of Gla-300 was driven by reductions in HCRU, costs, and market share assumptions. This resulted in a budgetary increase of $686 per patient per year (PPPY). In an alternative scenario where all patients transitioned to Gla-300, it led to a net savings of $660 PPPY.
These findings provide valuable insights for decision-makers and healthcare professionals when making choices related to formulary placement and treatment utilization.
Introduction
Diabetes mellitus (DM) represents a major and growing challenge affecting 537 million people worldwideCitation1. The American Diabetes Association (ADA) estimates that there are approximately 37.3 million people in the United States (U.S.) with DM, of which
90–95% have type 2 diabetes (T2D)Citation2. The management of DM imposes a clinical and humanistic burden on patients and a substantial economic burden on public and private payers in the U.S.Citation3 The estimated economic cost associated with diagnosed diabetes in the U.S. was $327 billion (2017 estimates), which included $237 billion in direct medical costs and $69 billion due to reduced productivityCitation4.
Several studies have documented keeping blood glucose levels under control as the cornerstone of reducing long term complications in the management of T2DCitation5–8. The ADA/European Association for the Study of Diabetes (EASD) consensus recommends HBA1c target of <7% to lower the risk of diabetic complicationsCitation9. However, many patients fail to achieve this goal, in part due to hypoglycemia, a condition when blood sugar levels drop lower than standard range, limiting their ability to maintain glycemic controlCitation10. Hypoglycemia is a frequent and potentially fatal adverse effect of insulins and some oral antidiabetic drugs (OADs) in patients with diabetesCitation11,Citation12. In addition to the immediate risk hypoglycemia poses, recurrent episodes result in fear of future episodes, and have been shown to constitute both a patient-led and physician-led barrier to optimal glycemic controlCitation11,Citation12. In the U.S., the estimated cost of severe hypoglycemic events ranges from $1,200–$17,500 per episodeCitation13.
In recent years, treatment options for T2D have expanded to glucagon-like peptide 1 (GLP1s) receptor agonists, dipeptidyl-peptidase 4 (DPP-4) inhibitors, and sodium-glucose cotransporter 2 (SGLT-2) inhibitorsCitation14. Despite new antidiabetic drugs, the progressive nature of the disease necessitates the dependency on exogenous insulin in many patientsCitation15–17. Patients with T2D (PwT2D) who failed to achieve targeted HbA1c levels with metformin, with or without additional OADs, may be initiated on basal-insulin (BI) therapy as per guidelinesCitation18.
BI analogs demonstrate a relatively flatter, more prolonged, and consistent pharmacokinetic and pharmacodynamic profile compared to neutral protamine Hagedorn (NPH) insulinCitation19. Longer-acting, second-generation insulin analogs insulin glargine 300 U/mL (Gla-300) and insulin degludec (IDeg), have shown significant improvements in the treatment of T2DCitation20. The safety and efficacy of both BIs have been well established in randomized clinical trials (RCTs) and real-world settings, with longer-acting BIs being superior to long-acting BIs (Gla-100 and detemir) with lower risk profile of hypoglycemic event ratesCitation21,Citation22. In the EDITION trial, Gla-300 had similar efficacy in reducing HbA1c compared to long-acting insulin therapy (insulin glargine 100 U/mL [Gla-100]) but had a lower risk of hypoglycemia in PwT2DCitation23–26. The DELIVER RWE studies assessed the clinical outcomes of Gla-300 in PwT2D in the U.S.Citation22 The DELIVER-3 study, examined the rates of hypoglycemia in older adults (aged ≥65 years) with T2D. The study results demonstrated that patients switching to Gla-300 were 57% less likely to have hypoglycemic events at 6-month follow-up compared to those who switched to other BisCitation27. These findings were consistent with the DELIVER-2 study which found that adults with T2D who switched to Gla-300 had 19% less hypoglycemic events compared to those switching to other BIs at 6-month follow-upCitation28. Furthermore, the LIGHTNING, which is a retrospective observational study using machine learning, reported that with the use of Gla-300, the rates of severe hypoglycemic events were lower compared to long-acting BI analogs and were similar with IDeg in a wide range of PwT2DCitation29.
The DELIVER studies have also shown lower healthcare resource utilization (HCRU) in PwT2D who switched from long-acting to longer-acting Gla-300Citation27,Citation28. The PwT2D who switched to Gla-300 experienced significantly fewer all-cause hospital inpatient days, emergency department visits, and outpatient visits. In addition, patients in the Gla-300 group reported an overall HCRU savings of U.S. $1,439 PPPY versus patients in another BI analog groupCitation28. In another study comparing diabetes therapy costs, the insulin consumption data based on the BRIGHT clinical trial showed that Gla-300 led to a reduction in pharmacological treatment costs when compared with IDeg-100Citation30.
RWE evidence highlights the HCRU cost savings in patients switching from long-acting to longer-acting BIs. However, in order to develop an economic model that reflects real-world settings and costs, these RWE study findings should be integrated into an economic analysis. Thus, this study aimed to evaluate the value and affordability of Gla-300 in BI therapy for adult PwT2D by leveraging RWE inputs in a value-based budget impact model (BIM) from a U.S. commercial payer perspective.
Methods and inputs
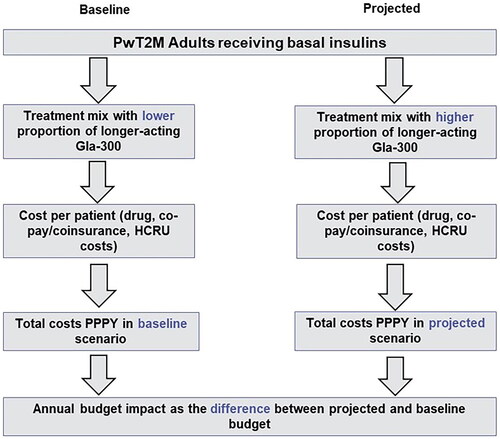
A three-year BIM from a healthcare commercial payer perspective was developed in Microsoft Excel 2010 to assess the economic impact of market utilization of longer-acting BIs (insulin glargine Gla-300) versus long-acting BIs, insulin glargine biosimilars, and IDeg. The model framework is presented below in .
Figure 1. Framework of budget impact model.
Gla-300: Insulin Glargine 300 U/mL; HCRU: Healthcare Resource Utilization, PPPY: Per Patient Per Year; PwT2D: Patients with Type 2 Diabetes.
Population
We assessed a hypothetical US health plan covering one million adultsCitation31. The estimated target population was narrowed to a group of diagnosed adult PwT2D who were receiving BIs, as demonstrated in . Patients were assumed to be receiving 0.2 units/kg/day of insulin, consistent with the FDA labels for each product, and to weigh 83.5 kg on average, which translated to 16.7 units of insulin per day. This study focused exclusively on the proportion of the adult PwT2D receiving BIs who were covered by private health insurance companies. An annual plan population growth rate of 4% was assumed for the entire model time horizon.
Figure 2. Patient type flowchart.
PwT2D: Patients with Type 2 Diabetes.
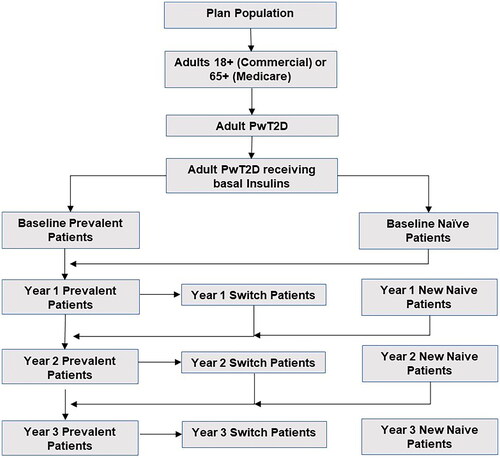
A prevalence-based modelling approach was used, consisting of three types of patients receiving BIs: naïve, switchers, and prevalent. The proportion of PwT2D who were neither naïve nor switchers were assumed to be prevalent patients. The methodology employed for defining the switchers (previously naïve/prevalent patients who have switched insulin treatments) and naïve patients (new to BI treatment, less than one year) was in accordance with the LIGHTNING studyCitation29. The number of switchers on each insulin is calculated in such a way that the total population for each insulin in that year equals the population required to satisfy the projected assumed utilization.
Market shares
The baseline utilization for long-acting BIs, longer-acting BIs, insulin glargine biosimilars, and IDeg were obtained from IQVIA data and internal forecasting at Sanofi, which were then used for projecting the market shares for years 1, 2, and 3. To separate the effect of IDeg from Gla-300, the model does not include IDeg in longer-acting BI category but still allows patients to switch from long-acting BIs to IDeg. Following baseline, where the analysis did not consider switchers, 24% of patients switched to insulin glargine biosimilars from projected year 1 to year 3. Utilization of glargine biosimilars and the most of long-acting BIs were assumed to increase over the study period.
HCRU rates and costs
HCRU rates for long-acting and longer-acting BIs were sourced from published literature and Sanofi data on fileCitation28,Citation32. Where there was insufficient data, a weighted average of existing event rates was usedCitation28. The model assessed the all-cause costs, drug costs, hypoglycemic events (associated with emergency, inpatient, and outpatient visits), and diabetes related HCRU costs (associated with emergency, inpatient, and outpatient visits) obtained from published literatureCitation32. The wholesale acquisition costs (WAC) for all types of insulin were determined based on data on file. In cases where companies implemented price reductions to comply with the restrictions outlined in the U.S. Inflation Reduction Act of 2023 amendments—limiting out-of-pocket insulin costs for Medicare beneficiaries to $35 per month—additional price reductions were applied. All the prices in the analysis were adjusted to 2023 prices using U.S. Bureau of labor statisticsCitation4. Detailed information related to HCRU costs and event rates have been included in Tables S1 and S2, respectively.
Table 1. Potential scenarios and their description.
Table 2. Market shares for base case and scenarios (in %).
Sensitivity analysis
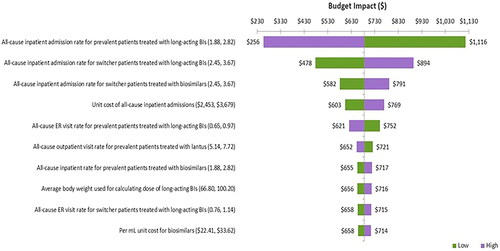
To investigate the robustness of the study, one-way sensitivity analyses (OWSA) were conducted. All parameters were varied by ±20% of the base case to investigate their impact on the results and to confirm which parameter(s) had the highest impact on the findings. The results were presented using a Tornado diagram ().
Figure 3. Tornado diagram for base case.
BIs: Basal Insulins.
Scenario analysis
Scenarios explored potential dynamics by using alternative utilization assumptions, net drug costs and by Medicare perspective. The list of scenarios and their corresponding market shares are presented in and , respectively.
Results
Base case results
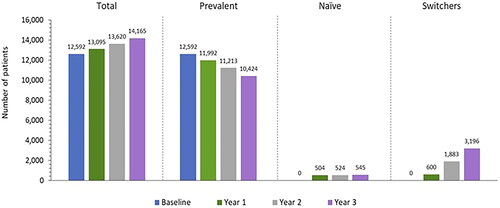
We estimated the baseline population of PwT2D receiving BIs to be 12,592 in a one-million-member plan, which increased to 14,165 by year 3 due to the annual population growth rate of 4%. As a result, the number of naïve patients increased from 504 in projected year 1 to 545 by projected year 3. Additionally, since the utilization assumptions for glargine biosimilars and most of long-acting BIs increase over time, the number of switcher patients grew from 600 in projected year 1 to 3,196 by projected year 3 ().
Figure 4. Number of targeted patients over time categorized by Sub-population.
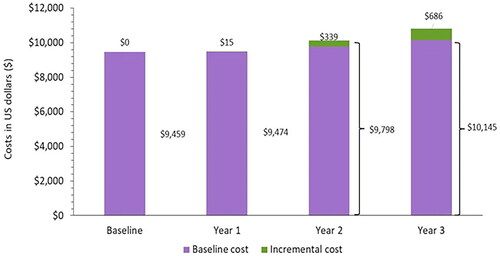
Results showed an incremental PPPY cost of $686 by projected year 3 (). This corresponds to an overall $10,145 PPPY in year 3 versus the $9,459 PPPY cost in the baseline year. This result is mainly driven by changes in the utilization assumptions of the different insulin products, reduced utilization of HCRU for patients using longer-acting BIs and glargine biosimilars (based on RWE evidence) and changes in the patient population (naïve/prevalent/switcher) over the projected yearsCitation33.
Figure 5. Budget impact for PwT2D receiving basal insulins, PY ($).
PY: Per Year; T2D: Type 2 Diabetes; U.S.: United States.
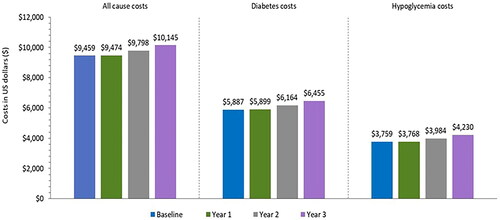
While the overall PPPY costs were $10,145 by year 3, the costs varied by the population subgroup, with lower costs for the prevalent/naïve patients ($9,597/$6,910) and a higher cost for switchers ($12,484; ). The high cost for switcher patients was primarily attributed to the high HCRU event rates per year. Approximately two-thirds of all PPPY costs were diabetes-related with around two-thirds of the diabetes costs being due to hypoglycemia. The all-cause, diabetes-related, and hypoglycemia costs increased by 7.3–12.5% by year 3 relative to baseline ().
Figure 6. Total costs in PwT2D receiving basal insulins, PPPY $ (by patient category).
PPPY: Per Patient Per Year; T2D: Type 2 Diabetes; U.S.: United States.
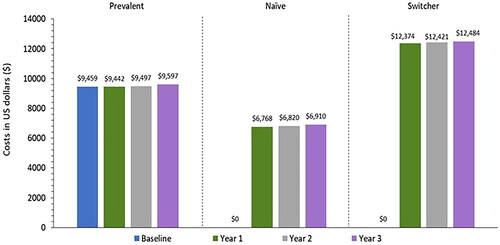
Figure 7. Total costs in PwT2D receiving basal insulins, PPPY $ (by specific HCRU event rates).
HCRU: Healthcare Resource Utilization; PPPY: Per Patient Per Year; T2D: Type 2 Diabetes; U.S.: United States.
Base case sensitivity analysis results
Based on the OWSA results, the inpatient rate due to all cause adverse events for prevalent patients treated with long-acting BIs had the greatest influence on the costs, ranging from $256 to $1,116 PPPY for higher and lower bound values, respectively. Secondly, the results were significantly impacted by the inpatient rate due to all cause adverse events for switcher patients treated with long-acting BIs and biosimilars. Other key variables influencing OWSA results are presented in .
Scenario results
We assessed the BIM for 3 alternative scenarios and found that the resulting incremental PPPY ranged from -$660 to $676 versus the base case value of $686 (see for scenario results and for the OWSA for each scenario). We found the lowest incremental PPPY when evaluating the scenario of longer-acting BIs achieving 100% utilization by projected year 3, where there was a cost savings of $660 PPPY. This is due to the increased utilization of longer-acting BIs that have lower rates of diabetes and hypoglycemic events. The next highest incremental cost was associated with a scenario with increasing market shares for longer-acting BIs (reverse assumptions to the base case), where we found an incremental cost of $676. Lastly, the incremental cost of $593 was observed when net drug costs were used rather than WAC. Net costs were lower than WAC, so the total PPPY costs were lower for all years, resulting in a net decrease in incremental cost as compared to base case budget impact of $686 PPPY.
Figure 8. Tornado diagram for scenario analysis.
BIs: Basal Insulins; WAC: Wholesale Acquisition Cost.
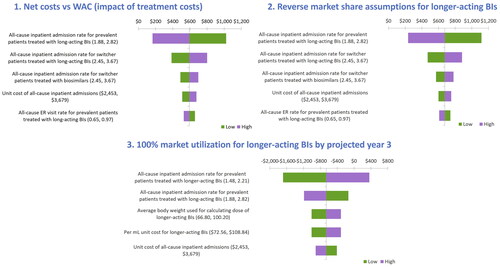
Table 3. Scenario results.
Discussion
Longer-acting BIs have shown improvement in the management of T2D by offering glycemic control with a lower risk of hypoglycemia. The efficacy and safety of Gla-300 and IDeg-100 was established in EDITION and BEGIN clinical trials, respectively, where they demonstrated adequately controlled HbA1c levels with relatively low risk of hypoglycemia compared to Gla-100Citation23–26,Citation34–38. The BRIGHT study, a head-to-head comparison of Gla-300 versus IDeg-100 in insulin naïve patients, observed comparable reduction in HBA1C levels and similar risk of hypoglycemia for both insulins. However, during the titration phase, the incidence of anytime confirmed hypoglycemia was lower with Gla-300 compared to IDeg-100Citation39. RWE studies complementing the benefits of
Gla-300 observed in RCTs have been published over recent yearsCitation22,Citation27–29,Citation40. The DELIVER naïve study, which involved insulin-naïve PwT2D, demonstrated a significant reduction in HBA1C levels for patients using Gla-300 compared to Gla-100. Overall, Gla-300 demonstrated comparable effectiveness along with lower risk of hypoglycemia when compared to long-acting BIs in patients who switched BIs. In addition, data from real-world studies pertaining to the outcomes of switching from long-acting to longer-acting BIs signifies the potential economic benefits associated with Gla-300 treatment in PwT2DCitation27,Citation28,Citation30.
Real-world studies support randomized controlled trial findings and are likely to be more generalizable and pertinent to clinicians and healthcare-delivery systems. In this study, we have developed a BIM using RWE to evaluate the affordability and economic benefits of longer-acting BIs in PwT2D from a U.S. payer perspective. The model developed in the present study addressed the cost-saving hypothesis proposed in earlier studies under the restriction imposed by the U.S. Inflation Reduction Act of 2023 amendmentsCitation41. With the increasing market shares for glargine biosimilars and most of long-acting BIs, the increase in the number of switcher patients was higher compared to the increase in naïve patient population in simultaneous years, which is attributed to higher HCRU event rates for switcher patients. Hence, a decline in the number of prevalent patients was observed over a projected period of 3 years, which again is supported by the decreasing market shares of the longer-acting BIs. Reduction in incremental costs PPPY ($) and overall cumulative costs was also observed in the current analysis.
The substantial economic burden of hypoglycemia among diabetic patients was highlighted in previous real-world studies. Using this BIM analysis, we found that savings in therapy costs were primarily linked with the reduction in hypoglycemic event rates. Given that hypoglycemia represents a major barrier in the treatment of diabetes, these results highlight the cost savings related to hypoglycemia despite the higher drug costs for longer-acting BIs. Thus, these findings may be valuable for physicians and policy makers to make more informed treatment decisions which may drive improved treatment adherence in diabetic patients.
Finally, the results for alternative market share scenarios have shown important implications for the projected years. Lower costs by projected year 3 were demonstrated in the reverse switch scenario, which assumed increasing market shares for longer-acting BIs among switcher patients over the projected years compared to the base case scenario. Furthermore, substantial cost savings were observed when 100% market share was allocated to longer-acting BIs by projected year 3, despite their higher indicated WAC, was associated with lower HCRU event rates per year for longer-acting BIs and resulted in lower overall treatment costs. These findings have long-term implications for expanding the use of longer-acting BIs over time. When using a Medicare population, marginal change was observed ($685, PPPY) compared to base case value ($686, PPPY), though the prevalence of T2D is higher for older patients. However, the results are consistent with those of the commercial population. The OWSA determined that the most influential parameters in the base case are the HCRU event rates and costs, which are consistent with existing literatureCitation28,Citation29,Citation32,Citation42,Citation43.
This analysis encompasses certain limitations. The market shares for projected years 1–3 were based on expectations supported by clinicians’ expert opinions and were not obtained from real-world data. Further, in this analysis patients are not tracked individually. Hence, findings from this study are limited by the quality of the data and robustness of methodology used.
As per our knowledge this is the first attempt for the economic analysis for longer-acting BIs while using budget impact analysis. These findings have important implications for the policymakers who decide on formulary placements and utilization control.
Conclusions
The present study demonstrated the economic impact of redistributing the market shares from long-acting to longer-acting BIs along with increasing market share of glargine biosimilars over three years among adult PwT2D. A budgetary increase of $686 PPPY by year 3 was projected based on market utilization assumptions of more patients switching to insulin biosimilars along with decreasing market shares for longer-acting insulins due to their high unit costs. In contrast, notable budgetary reductions were observed in a hypothetical scenario where all the patients switched from long-acting to longer-acting BIs over the three-year model horizon. The market shares highlighted the economic value of increased utilization of longer-acting BIs. Given that longer-acting BIs have high WAC, the reduction in HCRU event rates per year overrides the high cost and provide a cost saving treatment option for patients with PwT2D. Results from this BIM analysis may be used to guide healthcare professionals and decision-makers in terms of formulary placement and utilization control.
Transparency
Author contributions
All authors contributed to the study design, interpretation of findings, and critical revision of the manuscript. All authors approved the submitted version of the manuscript and agree to be accountable for all aspects of the work.
Acknowledgements
The authors would like to thank Amrita Dubey and Divya Jain of Axtria Pvt. Ltd., India, for providing medical writing/editorial support, which was funded by Sanofi.
Reviewer disclosures
Peer reviewers on this manuscript have no relevant financial or other relationships to disclose.
Previous presentation
This study was presented in part at ISPOR Europe Conference, November 6–9, 2022.
Supplemental Material
Download MS Word (71.4 KB)Declaration of financial/other interests
EP, LS and SSSS are employees of Axtria, which received funding from Sanofi for this analysis. RP, WL, and AR are employees and stockholders of Sanofi stock. SP was an employee and stockholder of Sanofi stock at the time of the analysis.
Additional information
Funding
References
- International Diabetes Federation. Diabetes Data Report. 2000–2045; [cited 2022 Oct 20]. 2022. Available from: https://diabetesatlas.org/data/en/world/
- American Diabetes Association. Statistics About Diabetes; [cited 2022 Oct 14; updated 2022 Jul 28]. 2022. Available from: https://diabetes.org/about-us/statistics/about-diabetes
- Shi L, Fonseca V, Childs B. Economic burden of diabetes-related hypoglycemia on patients, payors, and employers. J Diabetes Complications. 2021;35(6):107916. doi: 10.1016/j.jdiacomp.2021.107916.
- American Diabetes Association. Economic costs of diabetes in the U.S. in 2017. Diabetes Care. 2018;41(5):917–928. doi: 10.2337/dci18-0007.
- Gerstein HC, Miller ME, Byington RP, et al. Effects of intensive glucose lowering in type 2 diabetes. N Engl J Med. 2008;358(24):2545–2559. doi: 10.1056/NEJMoa0802743.
- Duckworth W, Abraira C, Moritz T, et al. Glucose control and vascular complications in veterans with type 2 diabetes. N Engl J Med. 2009;360(2):129–139. doi: 10.1056/NEJMoa0808431.
- Hayward RA, Reaven PD, Emanuele NV, et al. Follow-up of glycemic control and cardiovascular outcomes in type 2 diabetes. N Engl J Med. 2015;372(23):2197–2206. doi: 10.1056/NEJMc1508386.
- Reaven PD, Emanuele NV, Wiitala WL, et al. Intensive glucose control in patients with type 2 diabetes - 15-Year follow-up. N Engl J Med. 2019;380(23):2215–2224. doi: 10.1056/NEJMoa1806802.
- Nathan DM, Buse JB, Davidson MB, et al. Management of hyperglycemia in type 2 diabetes: a consensus algorithm for the initiation and adjustment of therapy: a consensus statement from the American diabetes association and the european association for the study of diabetes. Diabetes Care. 2006;29(8):1963–1972. doi: 10.2337/dc06-9912.
- Harris SB, Parente EB, Karalliedde J. Clinical use of insulin glargine 300 U/mL in adults with type 2 diabetes: hypothetical case studies. Diabetes Ther. 2022;13(5):913–930. doi: 10.1007/s13300-022-01247-7.
- Rowley WR, Bezold C, Arikan Y, et al. Diabetes 2030: insights from yesterday, today, and future trends. Popul Health Manag. 2017;20(1):6–12. doi: 10.1089/pop.2015.0181.
- Cryer PE. Hypoglycaemia: the limiting factor in the glycaemic management of type I and type II diabetes. Diabetologia. 2002;45(7):937–948. doi: 10.1007/s00125-002-0822-9.
- Sussman M, Sierra JA, Garg S, et al. Economic impact of hypoglycemia among insulin-treated patients with diabetes. J Med Econ. 2016;19(11):1099–1106. doi: 10.1080/13696998.2016.1201090.
- Nauck MA, Wefers J, Meier JJ. Treatment of type 2 diabetes: challenges, hopes, and anticipated successes. Lancet Diabetes Endocrinol. 2021;9(8):525–544. doi: 10.1016/S2213-8587(21)00113-3.
- Home P, Riddle M, Cefalu WT, et al. Insulin therapy in people with type 2 diabetes: opportunities and challenges? Diabetes Care. 2014;37(6):1499–1508. doi: 10.2337/dc13-2743.
- Davies MJ, D'Alessio DA, Fradkin J, et al. Management of hyperglycemia in type 2 diabetes, 2018. A consensus report by the American diabetes association (ADA) and the european association for the study of diabetes (EASD). Diabetes Care. 2018;41(12):2669–2701. doi: 10.2337/dci18-0033.
- Garber AJ, Handelsman Y, Grunberger G, et al. Consensus statement by the American association of clinical endocrinologists and American college of endocrinology on the comprehensive type 2 diabetes management algorithm - 2020 executive summary. Endocr Pract. 2020;26(1):107–139. doi: 10.4158/CS-2019-0472.
- Inzucchi SE, Bergenstal RM, Buse JB, et al. Management of hyperglycemia in type 2 diabetes, 2015: a patient-centered approach: update to a position statement of the American diabetes association and the european association for the study of diabetes. Diabetes Care. 2015;38(1):140–149. doi: 10.2337/dc14-2441.
- American Diabetes Association Professional Practice C. 9. Pharmacologic approaches to glycemic treatment: standards of medical care in diabetes-2022. Diabetes Care. 2022;45(Suppl 1):S125–S143. doi: 10.2337/dc22-S009.
- Cheng A, Bailey TS, Mauricio D, et al. Insulin glargine 300 U/mL and insulin degludec: a review of the current evidence comparing these two second-generation basal insulin analogues. Diabetes Metab Res Rev. 2020;36(7):e3329. doi: 10.1002/dmrr.3329.
- Hernando VU, Pablo FJ. Efficacy and safety of the second generation basal insulin analogs in type 2 diabetes mellitus: a critical appraisal. Diabetes Metab Syndr. 2019;13(3):2126–2141. doi: 10.1016/j.dsx.2019.05.001.
- Blonde L, Bailey T, Sullivan SD, et al. Insulin glargine 300 units/mL for the treatment of individuals with type 2 diabetes in the real world: a review of the DELIVER programme. Diabetes Obes Metab. 2021;23(8):1713–1721. doi: 10.1111/dom.14405.
- Yki-Jarvinen H, Bergenstal RM, Bolli GB, et al. Glycaemic control and hypoglycaemia with new insulin glargine 300 U/ml versus insulin glargine 100 U/ml in people with type 2 diabetes using basal insulin and oral antihyperglycaemic drugs: the EDITION 2 randomized 12-month trial including 6-month extension. Diabetes Obes Metab. 2015;17(12):1142–1149. doi: 10.1111/dom.12532.
- Riddle MC, Bolli GB, Ziemen M, et al. New insulin glargine 300 units/mL versus glargine 100 units/mL in people with type 2 diabetes using basal and mealtime insulin: glucose control and hypoglycemia in a 6-month randomized controlled trial (EDITION 1). Diabetes Care. 2014;37(10):2755–2762. doi: 10.2337/dc14-0991.
- Bolli GB, Riddle MC, Bergenstal RM, et al. New insulin glargine 300 U/ml compared with glargine 100 U/ml in insulin-naive people with type 2 diabetes on oral glucose-lowering drugs: a randomized controlled trial (EDITION 3). Diabetes Obes Metab. 2015;17(4):386–394. doi: 10.1111/dom.12438.
- Terauchi Y, Koyama M, Cheng X, et al. New insulin glargine 300 U/ml versus glargine 100 U/ml in japanese people with type 2 diabetes using basal insulin and oral antihyperglycaemic drugs: glucose control and hypoglycaemia in a randomized controlled trial (EDITION JP 2). Diabetes Obes Metab. 2016;18(4):366–374. doi: 10.1111/dom.12618.
- Bailey TS, Wu J, Zhou FL, et al. Switching to insulin glargine 300 units/mL in real-world older patients with type 2 diabetes (DELIVER 3). Diabetes Obes Metab. 2019;21(11):2384–2393. doi: 10.1111/dom.13818.
- Zhou FL, Ye F, Berhanu P, et al. Real-world evidence concerning clinical and economic outcomes of switching to insulin glargine 300 units/mL vs other basal insulins in patients with type 2 diabetes using basal insulin. Diabetes Obes Metab. 2018;20(5):1293–1297. doi: 10.1111/dom.13199.
- Pettus J, Roussel R, Liz Zhou F, et al. Rates of hypoglycemia predicted in patients with type 2 diabetes on insulin glargine 300 U/ml versus first- and Second-Generation basal insulin analogs: the Real-World LIGHTNING study. Diabetes Ther. 2019;10(2):617–633. doi: 10.1007/s13300-019-0568-8.
- Napoli R, Fanelli F, Gazzi L, et al. Using 2nd generation basal insulins in type 2 diabetes: costs and savings in a comparative economic analysis in Italy, based on the BRIGHT study. Nutr Metab Cardiovasc Dis. 2020;30(11):1937–1944. doi: 10.1016/j.numecd.2020.07.005.
- United States Census Bureau. National Population by Characteristics. 2020-2021; [cited 2022 Spt 2]. 2022. Avialble from: https://www.census.gov/data/tables/time-series/demo/popest/2020s-national-detail.html
- Higuchi KN, Wu J, Gill J, et al. Lower Healthcare-Resource Utilization and Associated Costs in Insulin-Naïve Patients With Type 2 Diabetes Initiated on Insulin Glargine 300 U/mL. Sanofi data on file. Virtual poster session presented at: AMCP Nexus.2020 Oct 20-23. Available from: https://www.jmcp.org/doi/pdf/10.18553/jmcp.2020.26.issue-10-a
- U.S. Bureau of Labor Statistics. Databases, Tables, and Calculators by Subject; [cited 2023 June 22]. Available from https://data.bls.gov/timeseries/CUUR0000SAM2
- Garber AJ, King AB, Del Prato S, et al. Insulin degludec, an ultra-longacting basal insulin, versus insulin glargine in basal-bolus treatment with mealtime insulin aspart in type 2 diabetes (BEGIN Basal-Bolus type 2): a phase 3, randomised, open-label, treat-to-target non-inferiority trial. Lancet. 2012;379(9825):1498–1507. doi: 10.1016/S0140-6736(12)60205-0.
- Zinman B, Philis-Tsimikas A, Cariou B, et al. Insulin degludec versus insulin glargine in insulin-naive patients with type 2 diabetes: a 1-year, randomized, treat-to-target trial (BEGIN once long). Diabetes Care. 2012;35(12):2464–2471. doi: 10.2337/dc12-1205.
- Gough SC, Bhargava A, Jain R, et al. Low-volume insulin degludec 200 units/ml once daily improves glycemic control similarly to insulin glargine with a low risk of hypoglycemia in insulin-naive patients with type 2 diabetes: a 26-week, randomized, controlled, multinational, treat-to-target trial: the BEGIN LOW VOLUME trial. Diabetes Care. 2013;36(9):2536–2542. doi: 10.2337/dc12-2329.
- Meneghini L, Atkin SL, Gough SC, et al. The efficacy and safety of insulin degludec given in variable once-daily dosing intervals compared with insulin glargine and insulin degludec dosed at the same time daily: a 26-week, randomized, open-label, parallel-group, treat-to-target trial in individuals with type 2 diabetes. Diabetes Care. 2013;36(4):858–864. doi: 10.2337/dc12-1668.
- Onishi Y, Iwamoto Y, Yoo SJ, et al. Insulin degludec compared with insulin glargine in insulin-naive patients with type 2 diabetes: a 26-week, randomized, controlled, Pan-Asian, treat-to-target trial. J Diabetes Investig. 2013;4(6):605–612. doi: 10.1111/jdi.12102.
- Rosenstock J, Cheng A, Ritzel R, et al. More similarities than differences testing insulin glargine 300 units/mL versus insulin degludec 100 units/mL in Insulin-Naive type 2 diabetes: the randomized head-to-Head BRIGHT trial. Diabetes Care. 2018;41(10):2147–2154. doi: 10.2337/dc18-0559.
- Bailey TS, Zhou FL, Gupta RA, et al. Glycaemic goal attainment and hypoglycaemia outcomes in type 2 diabetes patients initiating insulin glargine 300 units/mL or 100 units/mL: real-world results from the DELIVER naive cohort study. Diabetes Obes Metab. 2019;21(7):1596–1605. doi: 10.1111/dom.13693.
- Sayed BA, Finegold K, et al. Insulin Affordability and the Inflation Reduction Act: medicare Beneficiary Savings by State and Demographics. (Issue Brief No. HP-2023-02). Office of the Assistant Secretary for Planning and Evaluation, U.S. Department of Health and Human Services. 2023.
- Azzoug SL, Aissaoui A, Hachelaf Z. Budget Impact Analysis of Insulin Glargine-300U/mL (Gla-300) for Treatment of T1DM and T2DM in Adults Population in Algerian Setting. Poster session presented at: ISPOR Europe, 2022 Nov 6–9; Vienna, Austria. 2022.
- Wright EE, Jr., Malone DC, Trujillo JM, et al. Real-world persistence, adherence, health care resource utilization, and costs in people with type 2 diabetes switching from a first-generation basal insulin to a second-generation (insulin glargine 300 U/mL) vs an alternative first-generation basal insulin. J Manag Care Spec Pharm. 2022;28(6):592–603. doi: 10.18553/jmcp.2022.21436.